Once labeled a “youth-at-risk,” 30-year old Matt Rutherford risked it all in an attempt to become the first person to sail alone, nonstop around North and South America. www.solotheamericas.org
In June 2011, Matt departed on an incredible, death-defying voyage to sail nonstop around the Americas. On St Brendan, Albin Vega #1147, an old, scrappy 27-foot sailboat he spent the next 309 days alone at sea.
He braved the icebergs of the Arctic and the treacherous waters off Cape Horn.
Red Dot on the Ocean is the story of Matt's death-defying voyage

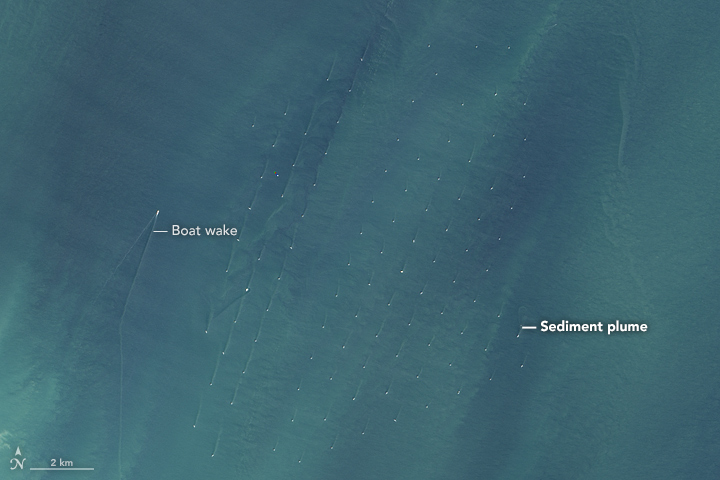
For at least the past decade, satellites have spotted white dots
cropping up in the North Sea.
If viewed from Earth’s surface, you would
see that these dots are actually wind turbines—huge arrays of towers
rising from the sea and topped with electricity-generating rotors.
Kentish Flat wind farm with the GeoGarage platform (UKHO chart)
But
they’re doing more than harvesting the wind.
They appear to also be
giving rise to sediment plumes.
acquired June 30, 2015
Some of the North Sea’s most expansive arrays are visible in these images, acquired on Jun 30, 2015, with the Operational Land Imager (OLI) on the Landsat 8
satellite.
When these images were acquired, there were 84 offshore wind
farms in Europe (including some under construction).
The North Sea
accounts for the most offshore wind capacity—69 percent—in European
seas, followed by the Irish Sea and Baltic Sea.
acquired June 30, 2015
The turbines were built to take advantage of high winds blowing over
the North Sea’s surface.
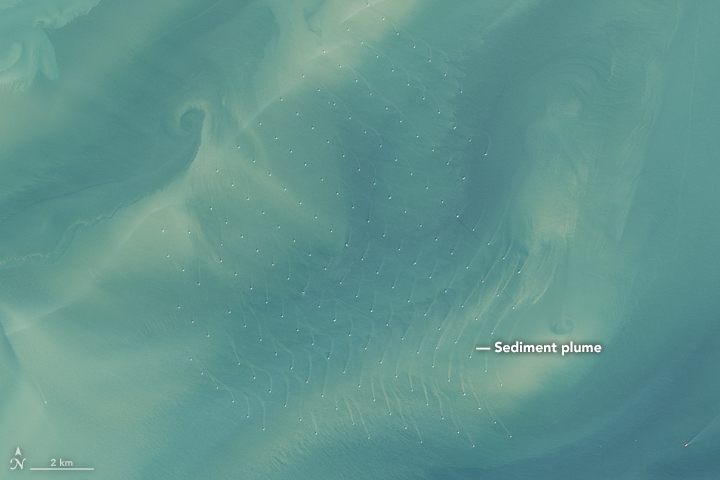
The London Array, visible in the first detailed
image, spans 100 square kilometers (40 square miles). The wind farm,
which first became operational in 2013,
sits on two natural sandbanks in water as deep as 25 meters (80 feet).
The site was chosen because of its proximity to onshore electric power
infrastructure and because it is beyond the main shipping lanes through
the area.
Thanet wind farm with the GeoGarage platform (UKHO chart)
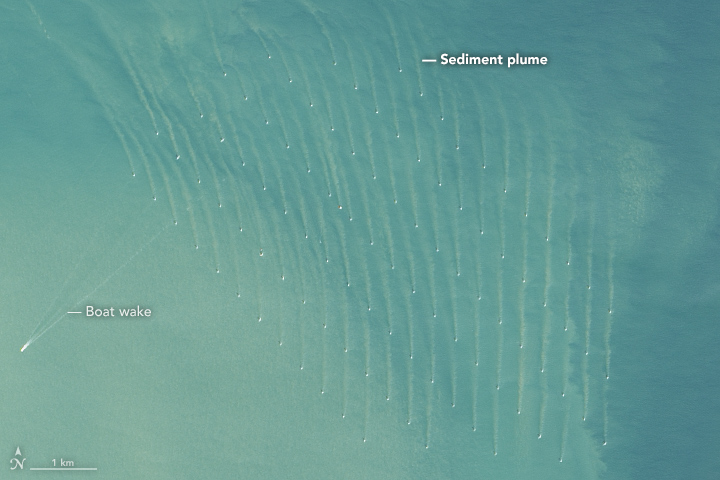
Other significant wind farms, Thanet and the northern half of Greater
Gabbard, are shown in the second and third detailed images.
Thanet
spans 35 square kilometers (14 square miles) and sits in water measuring
20 to 25 meters deep; the entirety of Greater Gabbard spans 147 square
kilometers (57 square miles) and sits in water 24 to 34 meters deep.
acquired June 30, 2015
Greater Gabbard wind farm with the GeoGarage platform (UKHO chart)
But the environment below the water’s surface can also feel the
presence of the turbines.
The detailed views reveal light-brown plumes
of suspended sediments extending from each tower.
In a 2014 paper,
researchers analyzed satellite imagery and found that the wakes (and
plumes) can measure anywhere from 30 to 150 meters wide and up to
several kilometers long.
“The fact that the wakes are browner than the surrounding waters
shows that they contain more suspended sediments,” said Quinten
Vanhellemont, a researcher at the Royal Belgian Institute of Natural
Sciences and lead author of the 2014 paper.
“This shows that the
installation of the wind turbines not only modifies the wind field above
the sea surface (which is expected as they are extracting wind energy),
but that they also modify the currents and sediment transport in the
water.”
London array wind farm with the GeoGarage platform (UKHO chart)
Vanhellemont explained that the wakes are generated by the tidal
current moving around the foundation of the turbine.
The direction and
curvature in the wakes are related to the general direction of the
current.
For example, the image of the London Array was acquired during
flood tide, so the wakes follow the northward current.
But the tide in
this area reverses every six hours, Vanhellemont said, “so the wakes are
quite dynamic over the day.”
It’s not yet clear how these changes in sediment transport could
affect the relatively shallow underwater environment, which is known to
be an important fish nursery.
According to Vanhellemont, researchers at
the University of Hull are currently studying the wakes in greater
detail by investigating their 3D structure.
Algae on drifting plastic waste gives off a sulfur compound which smells similar to the krill many marine birds feed on, researchers have discovered
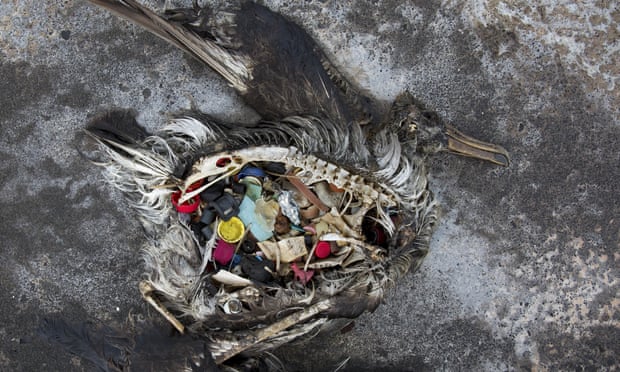
Seabirds are enticed into eating plastic debris because it smells like their food, according to scientists. The study
found that drifting plastic waste accumulates algae and gives off a
smell very similar to the krill that many marine birds feed on.
The
findings could explain why certain birds - including albatrosses and
shearwaters - which rely on their sense of smell for hunting, are particularly vulnerable to swallowing plastic.
Matthew Savoca, the study’s lead author at the University of
California Davis, said: “Animals usually have a reason for the decisions
they make.
If we want to truly understand why animals are eating
plastic in the ocean, we have to think about how animals find food.”
CNN gained rare access to Midway Atoll to see the shocking amounts of plastic that makes its way across the Pacific Ocean and into our food chain.
The rate of plastic pollution is steadily increasing worldwide, with one study last year
estimating that about eight million metric tons of plastic - enough to
cover every foot of coastline in the world - is enters the oceans
annually.
It is known that birds and other marine creatures, including turtles
and fish, ingest plastic.
This can lead to damage to internal organs,
gut blockages or build-ups of chemicals from the plastics in the
animals’ tissues.
Previous studies have shown that some birds feed their
young bits of waste - presumably mistaking it for food.
To investigate what attracts birds to debris, the scientists put
beads made from the three most common types of plastic - high-density
polyethylene, low-density polyethylene, and polypropylene - into the
ocean at Monterey Bay and Bodega Bay, off the California coast.
The beads were sewn into mesh bags and tied to buoys to avoid any of them being eaten by wildlife.
Three weeks later, the beads were collected and the smell they gave
off was analysed at the UC Davis Robert Mondavi Institute for Wine and
Food Science, where scientists normal focus on the chemistry behind the
flavour and fragrance of wines.
The plastic was found to give off a sulfur compound,
dimethyl sulfide (DMS), linked to the algae which coated the floating
plastic.
The same team had previously shown that DMS is the chemical cue
that triggers certain seabirds to forage for krill - or as the
scientists put it “the birds’ version of a dinner bell”.
It is this cue
that is being hijacked by the plastics.
The world ocean's food chain is being polluted with plastics.
This
program has won the Ocean Film Festival Award of Excellence at the NOAA
sponsored Gray's Reef National Marine Sanctuary film festival.
In a second piece of analysis, using data from 55 studies
and 13,315 birds, the scientists showed that seabirds that track the
scent of DMS to find prey - a group known as tube-nosed seabirds and
which includes albatrosses, petrels, and shearwaters - are nearly six
times more likely to eat plastic than other birds.
Birds
could be better protected in future, the scientists argue, by creating
plastics that do not accumulate algae as readily in the sea.
Berry Mulligan, international
marine programme officer at the Royal Society for the Protection of
Birds, said: “While research such as this is raising the alarm about
plastics in our oceans, it is hard to realistically estimate the
magnitude of the problem for seabirds at a global level.
Seabirds are
one of most threatened groups of birds in the world, but untangling the
effects of multiple threats to seabirds is a challenge, one which
underlines the importance of ongoing research such as this which helps
determine vulnerability of different species.”
The findings are published in the journal Science Advances.
World's most influential climate champion elects man who does not believe in the science behind man-made climate change, and has threatened to 'cancel' the Paris Agreement
Climate experts who have been nervously watching the US election from the UN summit in Marrakech will now go into crisis mode at the news that Donald Trump will be the next President of the United States.
Many attendees stayed up through the night to find out whether a man who has previously described “the concept of global warming” as being “created by and for the Chinese” will be named the most powerful leader in the world.
The Morocco summit has seen representatives from around the world gather to discuss how last year’s groundbreaking Paris Agreement will be implemented in practice.
But Mr Trump has previously stated that he wants to dismantle the accord, which aims to limit global warming to within 2C, suggesting the US should not waste "financial resources” on tacking the issue.
What Trump has said about climate change
The new US President has tweeted dozens of times about how he does not accept the overwhelming scientific evidence that man-made climate change is real.
Asked about his views on ScienceDebate, he said: "There is still much that needs to be investigated in the field of 'climate change. We must decide on how best to proceed so that we can make lives better, safer and more prosperous.”
The issue of climate change came up only once in the three live US presidential debates between Mr Trump and his defeated opponent Hillary Clinton.
Ms Clinton said she wanted to make America “the clean energy superpower of the 21st century”, and added: “Donald thinks that climate change is a hoax perpetrated by the Chinese. I think it's real… I think science is real.”
The Republican denied the content of his tweet, saying: “I did not. I did not. I do not say that.”
Whether this gives hope to climate experts that Mr Trump could change his position, or concern that the new US President would say something evidently untrue on live TV, remains to be seen.
How will President Trump impact the climate?
Patricia Espinosa, the UN’s top climate official, said last month that there was “no plan B” for the event of a Trump presidency.
Donald Trump said he would "cancel" the climate-rescue Paris Agreement if elected (AFP Photo/Derek Blair)
Speaking to Climate Home, she admitted the US election result would have serious “implications” for how the world tackles dangerous climate change.
But climate officials have also been bullish since the start of the COP22 summit, saying there is no going back on the Paris Agreement.
“I think everyone in the world is following the election process because of the implications, and we are vigilant, but it’s important to bear in mind the Paris Agreement has an incredible amount of legitimacy,” Ms Espinosa said.
“It remains a treaty that is in force. What we will do is be vigilant and attentive.”
In a report released at the summit on Tuesday, experts warned that the global climate had shown an "increasingly visible human footprint” in the last five years.
The World Meteorological Organization, the UN’s weather agency, said 2011-2015 was the hottest five-year period on record, and that many extreme events during the period were made more likely as a result of man-made climate change.
"The evidence is overwhelming," said Chris Field, director of the Stanford Woods Institute for the Environment.
"The new report from WMO is a clarion call for embracing and going beyond the goals of the Paris Agreement.”
How possible that is, with Donald Trump as US President, remains to be seen.
U.S.
Naval officer Silas Bent used this 1872 map to claim that the Gulf
Stream and other warm currents fed an open sea around the North Pole. Photograph courtesy Osher Map Library
Once just a figment of the imagination, a navigable sea route through the Arctic is becoming reality due to climate change.
This 1563 map by Giovanni Ramusio and Giacomo Gastaldi was the first
accurate map of the Americas sold commercially, but the blank areas at
the poles reflect the lack of geographical knowledge at the time.
Photograph courtesy Osher Map Library
It had to be there: an ocean at the top of the world.
The ancient
Greeks drew it on their maps, and for centuries, the rest of Europe did
too.
Beginning in the 1500s, countless men died trying to find it, hoping
for a maritime shortcut across the Arctic that would open up new trade
routes to Asia.
Now, thanks to a warming planet, the long-sought
Northwest Passage actually exists … at least for part of the year.
Sea
creatures abound in this 1598 map by the Dutch explorer Willem Barents.
He drew it while stuck in sea ice on his third trip to the Arctic. Photograph courtesy Osher Map Library
A new exhibit
at the Osher Map Library at the University of Southern Maine chronicles
this storied quest through centuries of treacherous exploration to the
increasingly open Arctic waters of today (the maps in this post come
from the exhibit).
This scene from the Illustrated London News, published in 1875, depicts a giant iceberg seen by a British expedition to the Arctic. Photograph courtesy Osher Map Library
The idea of a northern ocean passage dates back at least to the
second century A.D. Ptolemy and the ancient Greeks believed that Earth
had four habitable zones balanced by two uninhabitable frigid
zones—often thought to be water—at the top and bottom of the globe.
But
it wasn’t until the early 16th century, after the voyages of Columbus,
that the idea of a Northwest Passage really took hold in the popular
imagination of Europeans, says Ian Fowler, the library’s director.
Columbus, after all, had sailed west looking for a sea route to the
East.
Instead, he found a continent blocking the way.
This 1633 map by Gerhard Mercator depicts the North Pole as a massive rock surrounded by water. Photograph courtesy Osher Map Library
The Northwest
Passage would be a way around this continent.
“After the Spanish and Portuguese took control of the trade routes in
the south, along the coasts of Africa and South America, it once again
becomes a very popular idea as a way for the Dutch and the French and
the English to get access to the East and the riches they believed to be
there,” Fowler says.
This
1645 map by Willem Blaeu incorporates new information from exploratory
expeditions, but its depiction of Greenland connected to mainland North
America runs counter to the idea of a Northwest Passage. Photograph courtesy Osher Map Library
Maps from this period are filled with the wild imaginings and wishful
thinking of mapmakers, from nonexistent bays and islands to sea
monsters (you can see some of these figments of the imagination in the
gallery at the top of this post).
This 1558 map, supposedly based on the travels of the Zeno brothers of Venice, was widely copied. Photograph courtesy Osher Map Library
There was also a lot of gamesmanship and outright deception in the
maps.
The map above comes from a book published in 1558 to describe the
travels of two Venetian brothers in 1380.
The story is almost certainly
bogus, Fowler says, made up in an attempt to retroactively claim the
discovery of the New World for Venice.
Even so, the map was widely
copied and may have led some expeditions astray.
“It’s dangerous,”
Fowler says.
“It shows Greenland connected to Europe, which is obviously
not true. South of Iceland, there’s a number of fictitious islands. And
to the west of Greenland there’s a nice open sea, which at this time
would have been unnavigable because of pack ice.”
Colored
clouds represent the northern lights near the center of this 1709 map
by Jacques Peeters, which, unlike many maps of its time, includes only
geographical features that were confirmed by explorers.
This
detail from Peeters’ map (previous image) includes notes on parts of
the Greenland coast surveyed by different explorers, as well as a dotted
line (on the coast, near the center) to indicate an area of geographic
uncertainty.
Early explorers also occasionally played fast and loose with the
facts. The Englishman Martin Frobisher made three voyages in search of
the Northwest Passage in the late 1500s. He didn’t find it. “He
discovered some straits, pretended to find a lot more,” Fowler says. On
one trip, he returned to England with tons of what he claimed was
gold-containing ore. It was enough to convince his backers to fund
another trip, but it ultimately turned out to be pyrite—fool's gold.
This
1713 map by Jean-Dominique Cassini was the most scientific map of the
world in its day.
It draws on the observations and measurements of many
explorers and depicts two possible routes for a Northwest Passage.
With time, and additional exploration, the maps got better.
This
detail showing the Bering Strait comes from a 1784 map by Captain James
Cook that was the first printed map to accurately depict the west coast
of North America (on the right side).
In contrast to a Russian map
printed the same year (further down in this post), it has relatively
little detail of the Siberian coast (on the left).
The map
below, published in Russia in 1784, was the first to show details
gleaned from a large and highly organized survey of the Arctic coast of
Siberia. It depicts a possible Northwest Passage: On the far right side,
"R. de l'Quest” connects Hudson Bay to the Pacific Ocean. Notice the
level of detail on the Asian side of the Pacific compared to the North
American side—the situation is reversed in a map published the same year
based on Captain James Cook’s exploration of the coast of Alaska (see
slide nine in the gallery above).
This map,
published in Russia in 1784, depicts a possible Northwest Passage: on
the far right side, "R. de l'Quest” connects Hudson Bay to the Pacific
Ocean.
Perhaps the most famous attempt to find the Northwest Passage was the expedition led by Sir John Franklin
in 1845.
Franklin was an officer in the British Navy who had led two
previous expeditions to the Arctic.
But this time the expedition didn’t
return on schedule, and Franklin’s wife, Lady Jane, began pressing the
British government to send a search party, which they did in 1848.
The
search grew to include more ships over the coming years, and newspaper
reports on the hunt for the missing expedition gripped the British
public.
Ultimately, though, all the searchers found were several graves of
men who’d died early on and a few scattered notes and other relics.
The
two boats in the expedition had become trapped in ice, and all 129 men,
including Franklin, perished.
The second of his two boats, the H.M.S. Terror, was finally located only a few weeks ago.
Unbeknownst to Franklin and other explorers, their expeditions
coincided with what scientists call the Little Ice Age, a period of
several centuries of unusual cold in the Arctic.
Published
in 1868, this German map portrays a (nonexistent) land bridge
stretching across the Arctic from Greenland.
The red line coming up from
the bottom is the mapmaker’s suggested route for an expedition.
As temperatures began
to climb toward the end of the 19th century, the long-sought Northwest
Passage finally opened up.
The Norwegian explorer Roald Amundsen completed the first journey entirely by boat through the Northwest Passage in 1906.
It took three years and two winters on the ice.






/cdn0.vox-cdn.com/uploads/chorus_asset/file/7435831/PR_Graphic_11_2_16_650px.jpg)