It’s hard to grasp how deep the ocean is. The video provides a bit of context for measuring––and comprehending––the depth of the ocean. Prepare to have your mind blown when you see how deep humans have gone.
Concentrations of plastic debris in surface waters of the Mediterranean Sea at basin scale, and compared to the plastic concentrations reported for the global ocean.
It's hard to know how much plastic is reaching the seas, let alone what's happening to it. New study estimates Med load alone is one item per four square meters of water.
The Mediterranean Sea is just as badly afflicted by plastic dumping
as the rest of the world's oceans, despite being relatively isolated,
scientists say.
The team, from the universities of Cadiz and
Barcelona in Spain and the King Abdullah University of Science and
Technology in Saudi Arabia, found that an average plastic density of one
item per four square meters of water in the Mediterranean Sea.
Some 250 billion plastic particles weighing a total of 500 tonnes litter the Mediterranean, threatening sea life which can suffocate when eating them
Just as
horrifyingly, they found plastic debris in every single one of the sites
they sampled, the team reported in PLOS ONE this week.
That's about the same as the accumulation level found in the five subtropical ocean gyres – circulating ocean currents.
Bathymetry of the Mediterranean Sea (IBCM)
How much plastic is actually there in the Mediterranean Sea?
The team's best estimate is 1,000 to 3,000 tons and counting.
One would think it possible to reach a narrower
range of estimates, but one would be wrong. Nobody knows how much
plastic is entering the ocean from waste generated on land or by ships.
A
study published in February 2015 (the first of its kind for 40 years)
tried to put together worldwide data, adjusting for population density
and economic status: it estimated that in 2010, the 192 coastal nations
of the world produced 275 million metric tons of plastic waste.
Of that,
anywhere from 5 million tons to 13 million tons wound up in the water.
To put that into proportion, in 2012 scientists
estimated that all humanity together weighed 316 million tons.
In other
words, according to that estimate, humans are putting around 2% of their
total weight worth of plastic into the sea each year.
Moreover, the same 2012 study, which was done by a
team of American scientists and published in Science, forecasts that by
the year 2025, people will have dumped 155 million tons of plastic into the oceans – half of mankind's total weight.
Size distribution and aspect of the floating plastic debris collected in the Mediterranean Sea.
And it will stay there
Plastic famously fails to biodegrade.
Nobody
actually wants to eat it, though plenty of sea animals do so by mistake,
often fatally: it cannot be digested and even if it doesn't choke them,
their digestive systems get impacted.
But over time, plastic does break
down into tiny pieces, eventually down to the level called
"micro-plastics" which can be accidentally – fatally - eaten by the
microscopic animals on which the entire global food chain depends.
Anyway, what plastic does not do is vanish.
The
team estimates that the total amount discarded and floating in the
Mediterranean Sea is between 1,000 and 3,000 tons.
Surface samples found that the dominant plastic debris in the Mediterranean Sea was millimeter-sized fragments.
If the Mediterranean Sea was distinguished from the
great oceanic gyres – the circulating currents - in one way, it was a
higher prevalence of large plastic objects.
That, postulate the
scientists, is because by the time the plastic detritus reaches the
"plastic islands" – such as the famous "Great Pacific Garbage Patch" -
in the oceans, it has traveled a long way and disintegrated into tiny
pieces.
In the small Mediterranean Sea, the distance from the sources of
the pollution to the detritus is small.
Ranges of surface plastic concentrations measured in the Mediterranean Sea,
and reported for the open ocean.
Whodunit? And where is it?
Perhaps the most worrying thing of all, for the
oceans and the Mediterranean Sea too, is that the great garbage islands
turn out to be a drop in the sea, so to speak.
Total global plastic production is at least 300
million tons a year.
If in 1975, a National Academy of Sciences study
estimated that about 0.1% of global plastic went out to sea each year –
now the thinking is that the real proportion is 15% to 40%.
Scientists have long demonstrated the existence of
five so-called "plastic islands" in the oceans, which accumulate plastic
that arrives on the ocean currents.
Each contains millions of pieces of
plastic per square kilometer.
Though make no mistake, the plastic is
everywhere in the water.
Scientists had assumed that most of the plastic
tossed into the sea wound up in these mounting piles on the water
surface, created by powerful oceanic currents.
But if that were the
case, the garbage patches should be much, much bigger than they are.
Ergo, most of the plastic is not ending up in the great plastic islands.
Photograph of typical textile fiber (red) and fishing thread (blue)
So where is it?
Scientists now admit they have no
idea where 99% of ocean plastic ends up, though clearly some
micro-plastic is ending up on the sea floor.
Sadly for them, marine animals are eating at least
some of the missing plastic, mistaking the small bits for food.
It isn't
though.
It isn't nutritious for just about anybody – with one possible
exception.
If there's hope, it's that some of the missing
plastic is actually being eaten by microbes.
If there's one thing that
characterizes life on this planet in general , it's adaptability.
Otherwise there would be no life.
Maybe there's some germ down there in
the depths, or on the surface, that's evolved a taste for plastic. We
just haven't found it yet.
In 2015, NOAA survey ships Thomas Jefferson and Ferdinand R. Hassler
are scheduled to survey nearly 1,800 square nautical miles in the U.S.
coastal waters of the lower 48 states, collecting data that will update
nautical charts for navigation and other uses.
The ships will also conduct several “full bottom” hydrographic survey
projects, acquiring data from over 2,800 square nautical miles in survey
areas along the Alaskan coastline.
We are also planning several projects for our contractual private
sector survey partners, and those projects will be announced after work
orders are finalized.
The Office of Coast Survey will manage the surveys
that measure water depths and collect ocean floor data for charting,
identifying navigational hazards, informing wind farm decisions, mapping
fish habitats, and assisting with coastal resilience.
Check the useful
story map, 2015 Hydrographic Survey projects, for the survey outlines and more information.
Coast Survey will update the map as weather and operational constraints dictate.
Briefly, this year’s NOAA survey projects include:
1. Gulf of Maine, where chart soundings in heavily trafficked and fished areas are decades old and need updating for navigational safety
2. Buzzards Bay (Massachusetts and Rhode Island),
where increased use of deeper-draft double-hull barges – and possible
installation of marine transmission cable routes and wind energy
development — requires updated soundings
3. Rhode Island Sound, where the Bureau of Ocean Energy Management has identified a wind energy lease area
4. Approaches to Chesapeake (North Carolina), where
charts of critical navigational areas need updating for navigation and
to assist the Bureau of Ocean Energy Management manage windfarm
activity.
5. Approaches to Charleston (South Carolina), where
updated soundings will provide the correct under-keel clearance
information for the expected transit of larger and deeper-draft ships
6. Approaches to Savannah (Georgia), where the
Savannah Harbor Expansion Project will increase the authorized depth of
the harbor from 42 to 47 feet and updated soundings will provide the
correct under-keel clearance information for the expected transit of
larger and deeper-draft ships
7. Chatham Strait (Alaska), where charts need to be
updated for cruise liners, ferries, Coast Guard cutters, Navy vessels,
tugs, and barges that use this waterway on a regular basis or when
avoiding storms in the Gulf of Alaska
8. Approaches to Kotzebue (Alaska), where deep-draft vessels have their cargo lightered to shore by shallow draft barges
9. Point Hope (Alaska), where shipping traffic is increasing due to receding ice but charted soundings are sparse and date back to the 1960s
10. West Prince of Wales Island (Alaska), where
updated charts are needed by smaller vessels that use Televak Narrows as
an alternate passage during foul weather
11. Shumagin Islands (Alaska), where Coast Survey needs data to create a new, larger scale, nautical chart
12. Port Clarence (Alaska), where Coast Survey needs data to create a new, larger scale, nautical chart
13. South Arctic Reconnaissance Route, where trackline data will assist consideration of the U.S. Coast Guard’s proposed Bering Strait Port Access Route Study
14. North Coast of Kodiak Island (Alaska), where we need to update charts for Kodiak’s large fishing fleet and increasing levels of passenger vessel traffic
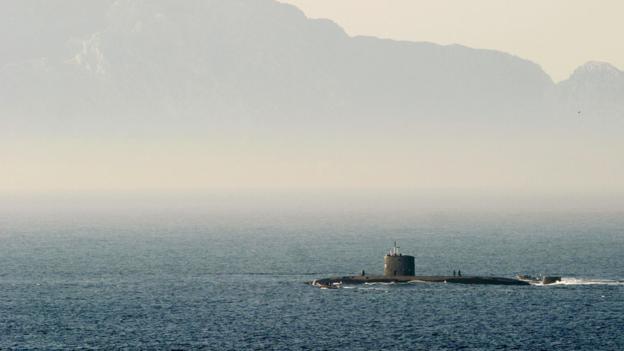
From BBC by Paul Marks When nuclear-powered submarines reach the end of their lives,
dismantling them is a complicated and laborious process.
Nuclear submarines have long been a favourite in popular fiction.
From
movies such as The Hunt for Red October to long-running TV series like
Voyage to the Bottom of the Sea, they have always been portrayed as
awesome instruments of geopolitical power gliding quietly through the
gloomy deep on secret, serious missions.
But at the end of their useful lives the subs essentially become
floating nuclear hazards, fizzing with lethal, spent nuclear fuel that's
extremely hard to get out.
Nuclear navies have had to go to
extraordinary lengths to cope with their bloated and ageing Cold War
fleets of hunter-killer and ballistic missile nuclear subs.
Kara Sea with the Marine GeoGarage (NGA charts)
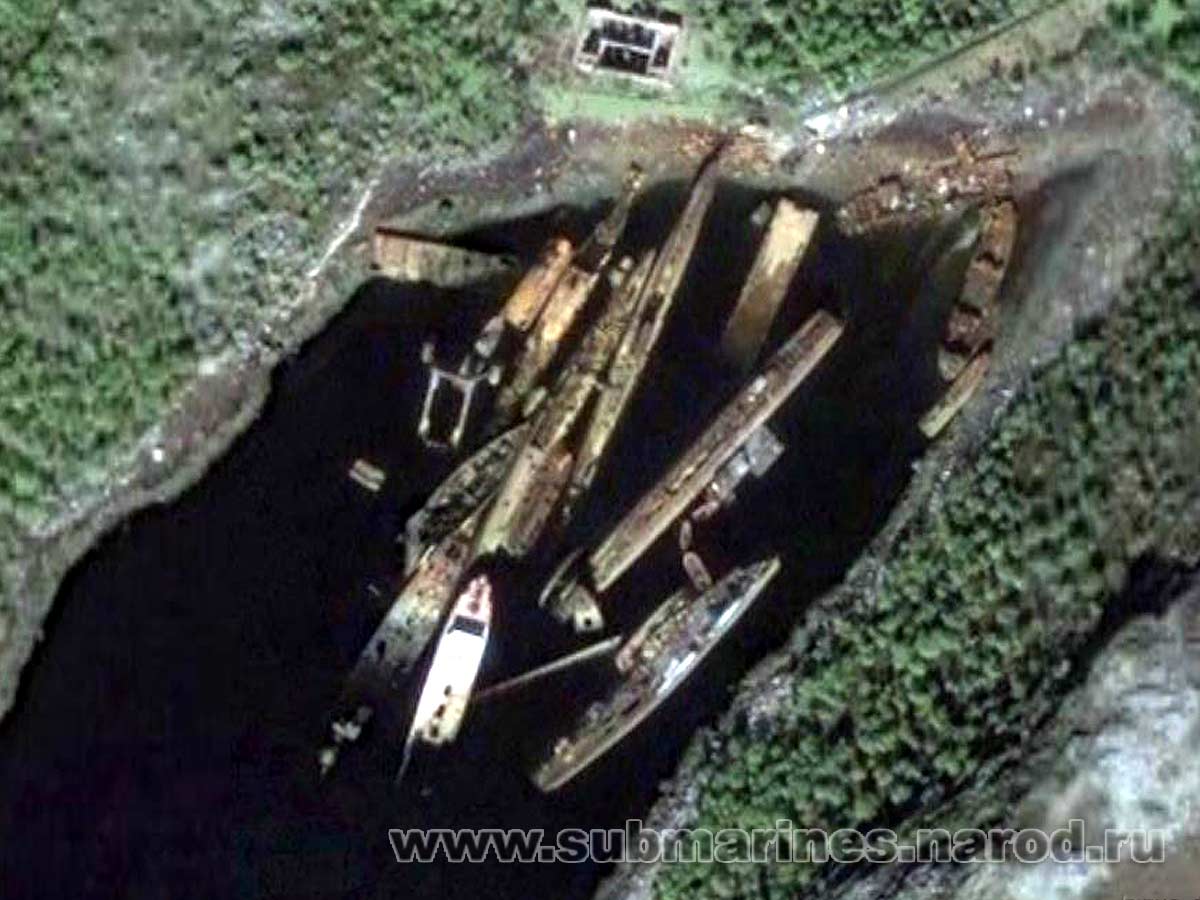
As a result, some of the strangest industrial graveyards on the
planet have been created – stretching from the US Pacific Northwest, via
the Arctic Circle to Russia’s Pacific Fleet home of Vladivostok.
These
submarine cemeteries take many forms.
At the filthy end of the
spectrum, in the Kara Sea north of Siberia, they are essentially nuclear
dumping grounds, with submarine reactors and fuel strewn across the
300m-deep seabed.
Here the Russians appear to have continued, until the
early 1990s, disposing of their nuclear subs in the same manner as their
diesel-powered compatriots: dropping them into the ocean.
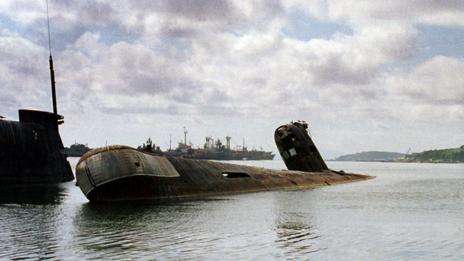
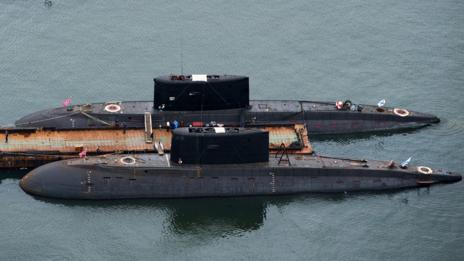
Rusting remains
The diesel sub scrapyard in the inlets around Olenya Bay
in north-west Russia's arctic Kola Peninsula is an arresting sight:
rusted-through prows expose torpedo tubes inside, corroded conning
towers keel over at bizarre angles and hulls are burst asunder, like
mussels smashed on rocks by gulls.
The Soviets turned the Kara Sea
into "an aquarium of radioactive junk" says Norway’s Bellona
Foundation, an environmental watchdog based in Oslo.
The seabed is
littered with some 17,000 naval radioactive waste containers, 16 nuclear
reactors and five complete nuclear submarines – one has both its
reactors still fully fuelled.
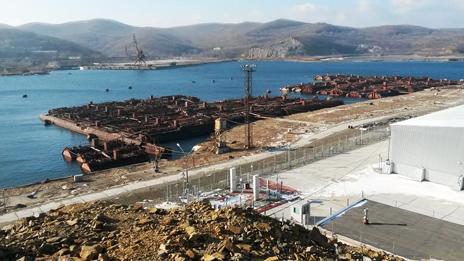
Russian reactors have been stored in the harbour at Vladivostok
The Kara Sea area is now a target for oil and gas companies – and
accidental drilling into such waste could, in principle, breach reactor
containments or fuel rod cladding, and release radionuclides into the
fishing grounds, warns Bellona's managing director Nils Bohmer.
Olenya Bay with the Marine GeoGarage (NGA charts)
Official
submarine graveyards are much more visible: you can even see them on
Google Maps or Google Earth.
Zoom in on America's biggest nuclear waste
repository in Hanford, Washington, Sayda Bay in the arctic Kola Peninsula, or the shipyards near Vladivostok
and you'll see them.
There are row after row of massive steel
canisters, each around 12m long.
They are lined up in ranks in Hanford's
long, earthen pits awaiting a future mass burial, sitting in regimented
rows on a Sayda Bay dockside, or floating on the waters of the Sea of
Japan, shackled to a pier at the Pavlovks sub base near Vladivostok.
Drained and removed
These
canisters are all that remain of hundreds of nuclear subs.
Known as
"three-compartment units" they are the sealed, de-fuelled reactor blocks
produced in a decommissioning process perfected at the US Department of
Defense's Puget Sound Naval Shipyard in Bremerton, Washington.
It’s
a meticulous process.
First, the defunct sub is towed to a secure
de-fuelling dock where its reactor compartment is drained of all liquids
to expose its spent nuclear fuel assemblies.
Each assembly is then
removed and placed in spent nuclear fuel casks and put on secure trains
for disposal at a long-term waste storage and reprocessing plant.
In the
US, this is the Naval Reactor Facility at the sprawling Idaho National
Laboratory, and in Russia the Mayak plutonium production and
reprocessing plant in Siberia is the final destination.
(Credit: Getty Images)
Although the reactor machinery – steam generators, pumps, valves and
piping – now contains no enriched uranium, the metals in it are rendered
radioactive by decades of neutron bombardment shredding their atoms.
So
after fuel removal, the sub is towed into dry dock where cutting tools
and blowtorches are used to sever the reactor compartment, plus an
emptied compartment either side of it, from the submarine's hull.
Then
thick steel seals are welded to either end.
So the canisters are not
merely receptacles: they are giant high-pressure steel segments of the
nuclear submarine itself – all that remains of it, in fact, as all
nonradioactive submarine sections are then recycled.
Russia also
uses this technique because the West feared that its less rigorous
decommissioning processes risked fissile materials getting into
unfriendly hands.
At Andreeva Bay, near Sayda, for instance, Russia
still stores spent fuel from 90 subs from the 1960s and 1970s, for
instance.
So in 2002, the G8 nations started a 10-year, $20bn programme
to transfer Puget Sound's decommissioning knowhow to the Russian
Federation.
That involved vastly improving technology and storage at
their de-fuelling facility in Severodvinsk and their dismantling
facility, and by building a land-based storage dock for the
decommissioned reactors.
Andreeva Bay with te Marine GeoGarage (NGA charts)
Floating menace
Safer
land-based storage matters because the reactor blocks had been left
afloat at Sayda Bay, as the air-filled compartments either side of the
reactor compartment provide buoyancy, says Bohmer.
But at Pavlovks, near
Vladivostok, 54 of the canisters are still afloat and at the mercy of
the weather.
Decommissioning this way is not always possible,
however, says Bohmer.
Some Soviet subs had liquid metal cooled reactors –
using a lead-bismuth mixture to remove heat from the core – rather than
the common pressurised water reactor (PWR).
In a cold, defunct reactor
the lead-bismuth coolant freezes, turning it into an unwieldy solid
block. Bohmer says two such submarines are not yet decommissioned and
have had to be moved to an extremely remote dockyard at Gremikha Bay –
also on the Kola Peninsula – for safety's sake.
When nuclear submarines reach the end of their lives,
some of their
hulks remain dangerously radioactive
(Credit: Science Photo Library)
Using the three-compartment-unit method, Russia has so far
decommissioned 120 nuclear submarines of the Northern Fleet and 75 subs
from its Pacific Fleet.
In the US, meanwhile, 125 Cold War-era subs have
been dismantled this way.
France, too, has used the same procedure.
In
Britain, however, Royal Navy nuclear subs are designed so that the
reactor module can be removed without having to sever compartments from
the midsection.
"The reactor pressure vessel can be removed in one
piece, encased, transported and stored," says a spokesman for the UK
Ministry of Defence.
However Britain's plans to decommission 12
defunct submarines stored at Devonport in the south of England and seven
at Rosyth in Scotland won't happen any time soon as the government
still has to decide which of five possible UK sites will eventually
store those pressure vessels and spent fuel. This has raised community
concerns as the numbers of defunct nuclear-fuelled subs is building up
at Devonport and Rosyth, as BBC News reported last year.
Water fears
Environmental
groups have also raised concerns about fuel storage in the US.
The
Idaho National Lab has been the ultimate destination for all US Navy
high-level spent fuel since the first nuclear sub, USS Nautilus, was
developed in 1953.
"The prototype reactor for the USS Nautilus was
tested at INL and since then every scrap of spent fuel from the nuclear
navy has ended up in Idaho. It is stored above the upstream end of the
Snake River Aquifer, the second largest unified underground body of
water on the North American continent," says Beatrice Brailsford of the
Snake River Alliance, an environmental lobby group.
"The spent
fuel is stored above ground, but the rest of the waste is buried above
the aquifer and that practice may continue for another half century. It
is a source of concern for many people in Idaho."
It's not only the
aquifer's fresh water that's at risk: the state’s signature crop,
potatoes, would also be affected.
Even with high security, radioactive material can occasionally escape – sometimes in bizarre ways.
For instance both INL and Hanford
have suffered unusual radiation leaks from tumbleweeds blowing into
waste cooling ponds, picking up contaminated water, and then being blown
over the facility's perimeter by the wind.
The expensive,
long-term measures that have to be taken to render a defunct nuclear sub
safe don’t seem to deter military planners from building more vessels.
"As far as the US is concerned there is no indication that the Navy
believes nuclear submarines have been anything less than a stellar
success and replacements for the major submarine classes are in the
works." says Edwin Lyman, nuclear policy analyst at the Union of
Concerned Scientists, a pressure group, in Cambridge, Massachusetts.
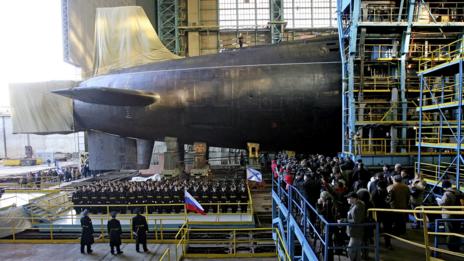
The Russian Navy is planning to launch several new submarines
(Credit: Science Photo Library)
The US is not alone: Russia has four new nuclear subs under construction at Severodvinsk and may build a further eight before 2020.
"Despite limited budgets Russia is committed to building up its nuclear fleet again," says Bohmer. China is doing likewise.
The submarine graveyards and spent fuel stores, it appears, will continue to be busy.
I assume that Google mapped the new island using the latest Landsat satellite imagery.
On Google Maps the island is called Null Island.
I'm not sure where the name originates, and it seems that the UN has yet to officially recognize the island's name as 'Null Island'.
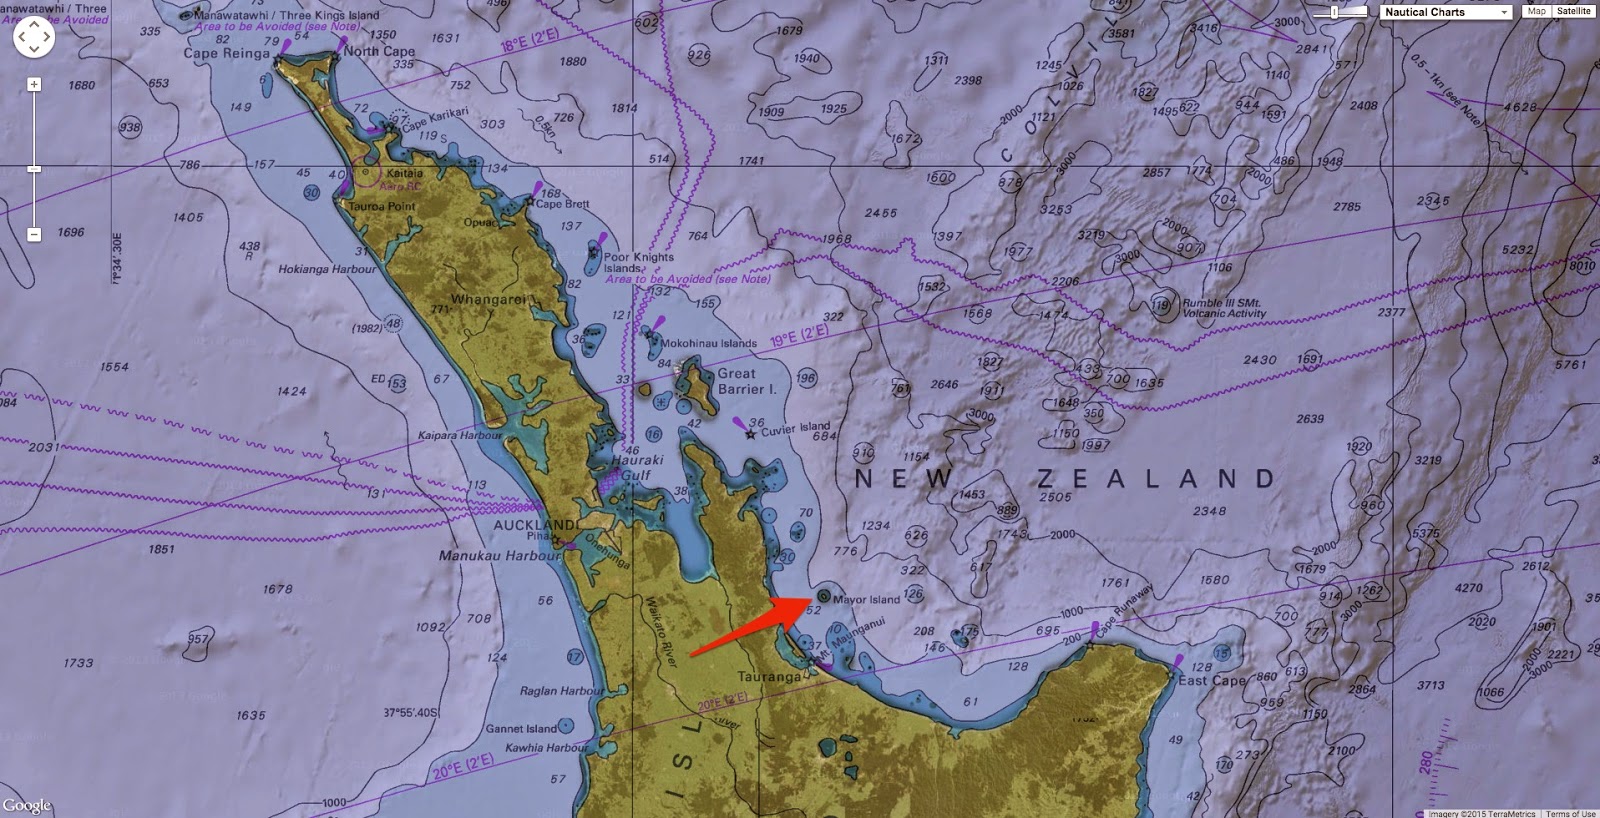
Null Island from the Air : This photo of the uninhabited side of the Island shows both Boundary Ridge and Settlement Lake. The crater of Mayor Island (Tūhua) shows up clearly in this view from the north, with the Bay of Plenty coastline in the distance. The last eruption, around 7,000 years ago, left the crater with a rim breached nearly to sea level on the north side of the island (foreground).
Despite being the world's newest country the island (inevitably) already has its own website, The Republic of Null Island.
The Republic of Null Island website refers to the 'long history' of the inhabitants (referred to on the site as Null Islanders).
It would be safe to assume that The Republic of Null Island website is not meant to be taken entirely seriously.
Actually, the picture of Null Island from the Air used by the website is a real picture of the Mayor Island (Tūhua) in New Zealand, an emergent summit of a caldera volcano roughly 750 m high and 15 km across.
Null Island also already has its own entry on Wikipedia.
Null Island is a fictional island in the Gulf of Guinea added to the Natural Earth public domain map dataset,located where the equator crosses the prime meridian, at coordinates 0°N0°E.
A troubleshooting country has been added with an Indeterminate sovereignty class called Null Island.
It is a fictional, 1 meter square island located off Africa where the equator and prime meridian cross. Being centered at 0,0 (zero latitude, zero longitude) it is useful for flagging geocode failures which are routed to 0,0 by most mapping services.
Aside: “Null Islands” exist for all local coordinate reference systems besides WGS84 like State Plane (and global if not using modern Greenwich prime meridian).
Null Island in Natural Earth is scaleRank 100, indicating it should never be shown in mapping.
Side note: Rank 30 (zoom 29 in Google speak) is 1:1 scale and would require over 288 billion million tiles with a total storage requirement of more than 3.5 billion million megabytes which verges on Borges’ essay On Exactitude in Science, A Map the Size of the World).
Null Island should only be used during analysis and will keep errant points off your maps.
Although intended humorously, the fiction has a serious purpose and is used by mapping systems to trap errors.
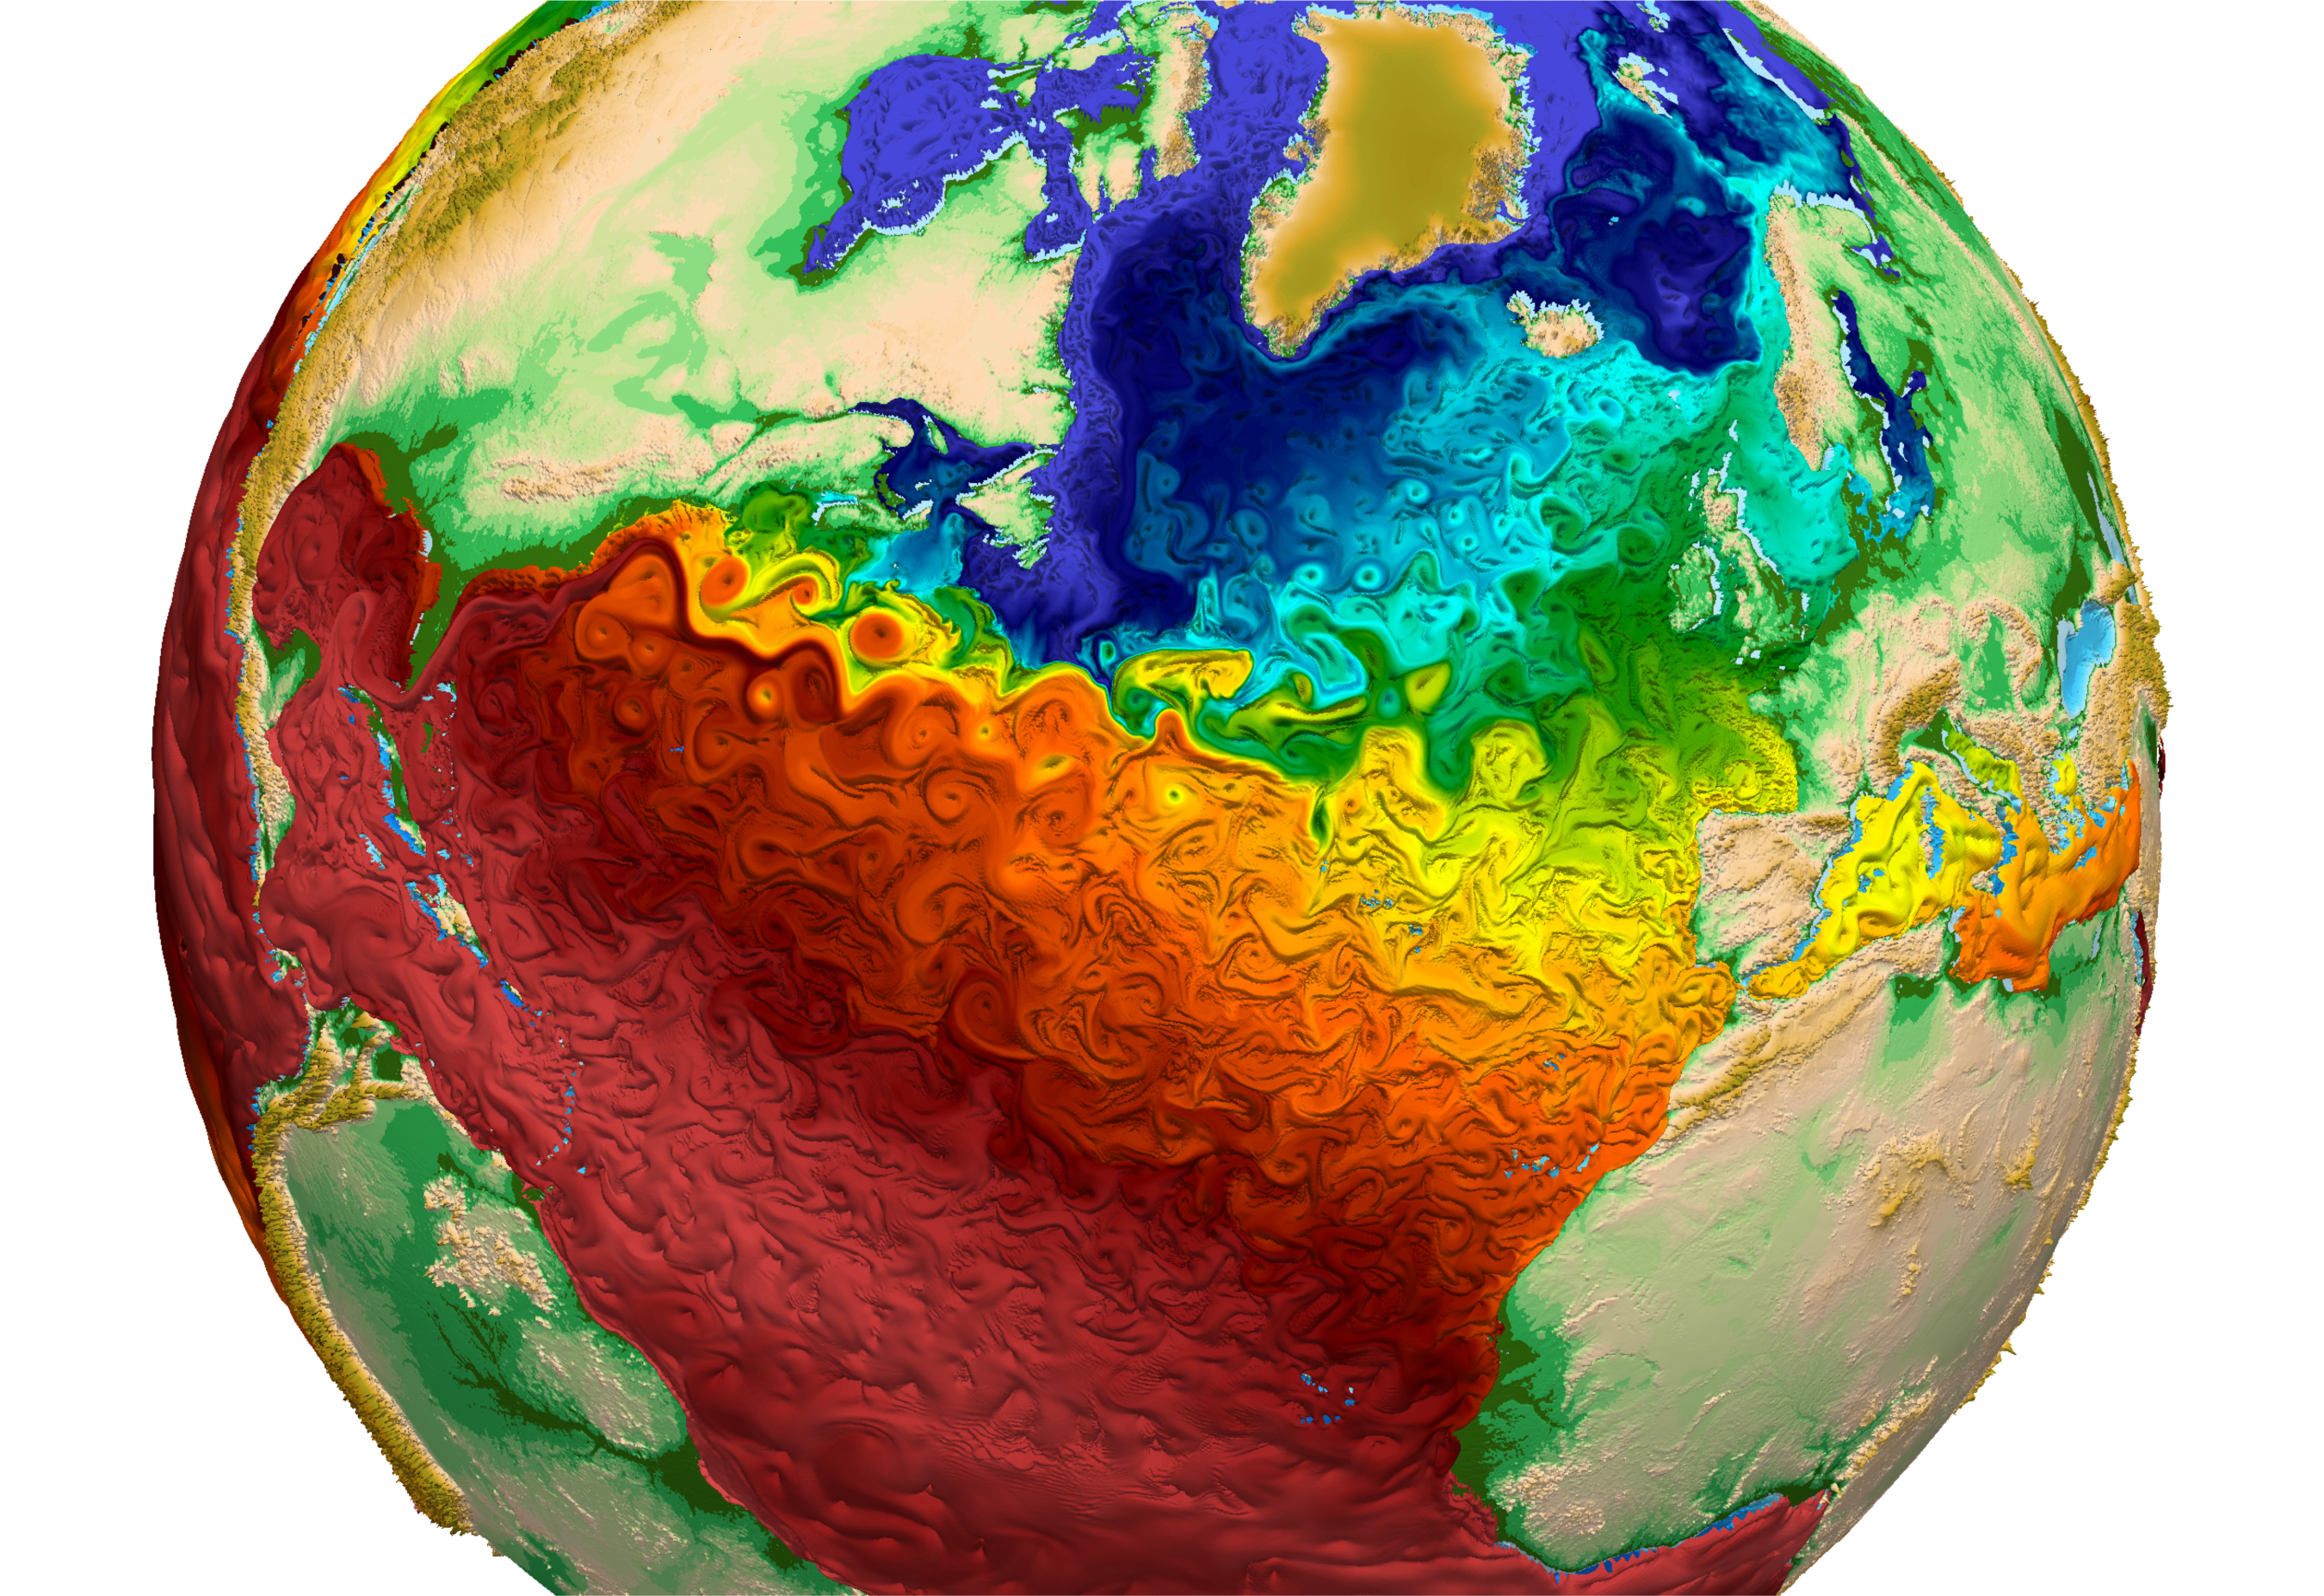
The paint-like swirls of this visualization from Los Alamos National Laboratory depict global water-surface temperatures, with the surface texture driven by vorticity.
Cool temperatures are designated by blues and warmer temperatures by reds.
Trapped regions of warmer water (red) adjacent to the Gulf Stream off the eastern coast of the U.S. indicate the model’s capability to simulate eddy transport of heat within the ocean, a key component necessary to accurately simulate global climate change.
A new global map of the world's oceans is so visually stunning that it could be mistaken for art.
The paintlike swirls of the visualization, which was released earlier this month by Los Alamos National Laboratory, depict global water surface temperatures.
And the resulting image is beautiful.
Blue areas designate cool temperatures, and reds indicate warmer
temperatures.
The map shows a clear divide between the Northern
Hemisphere and the Southern Hemisphere, but finer details — including
trapped regions of hot water adjacent to the Gulf Stream in the Atlantic
Ocean, and warmer water in the Mediterranean — can also be seen.
The simulation is dubbed the Model for Prediction Across Scales Ocean
(MPAS-O).
It's a variable-resolution model, which means researchers can
easily sharpen the simulation's resolution on regional scales (where
they have more data).
In fact, the map has a resolution of 9 miles (15
kilometers) in the North Atlantic and 47 miles (75 km) elsewhere.
MPAS-O uses data from the National Oceanographic Data Center's World
Ocean Circulation Experiment (WOCE) — the most comprehensive data set ever
collected from the global ocean.
For years, researchers sailed the
world's oceans and dropped instruments overboard every 35 miles (56 km).
The instruments measured water temperature and salinity at regular
intervals from the surface to the seafloor.
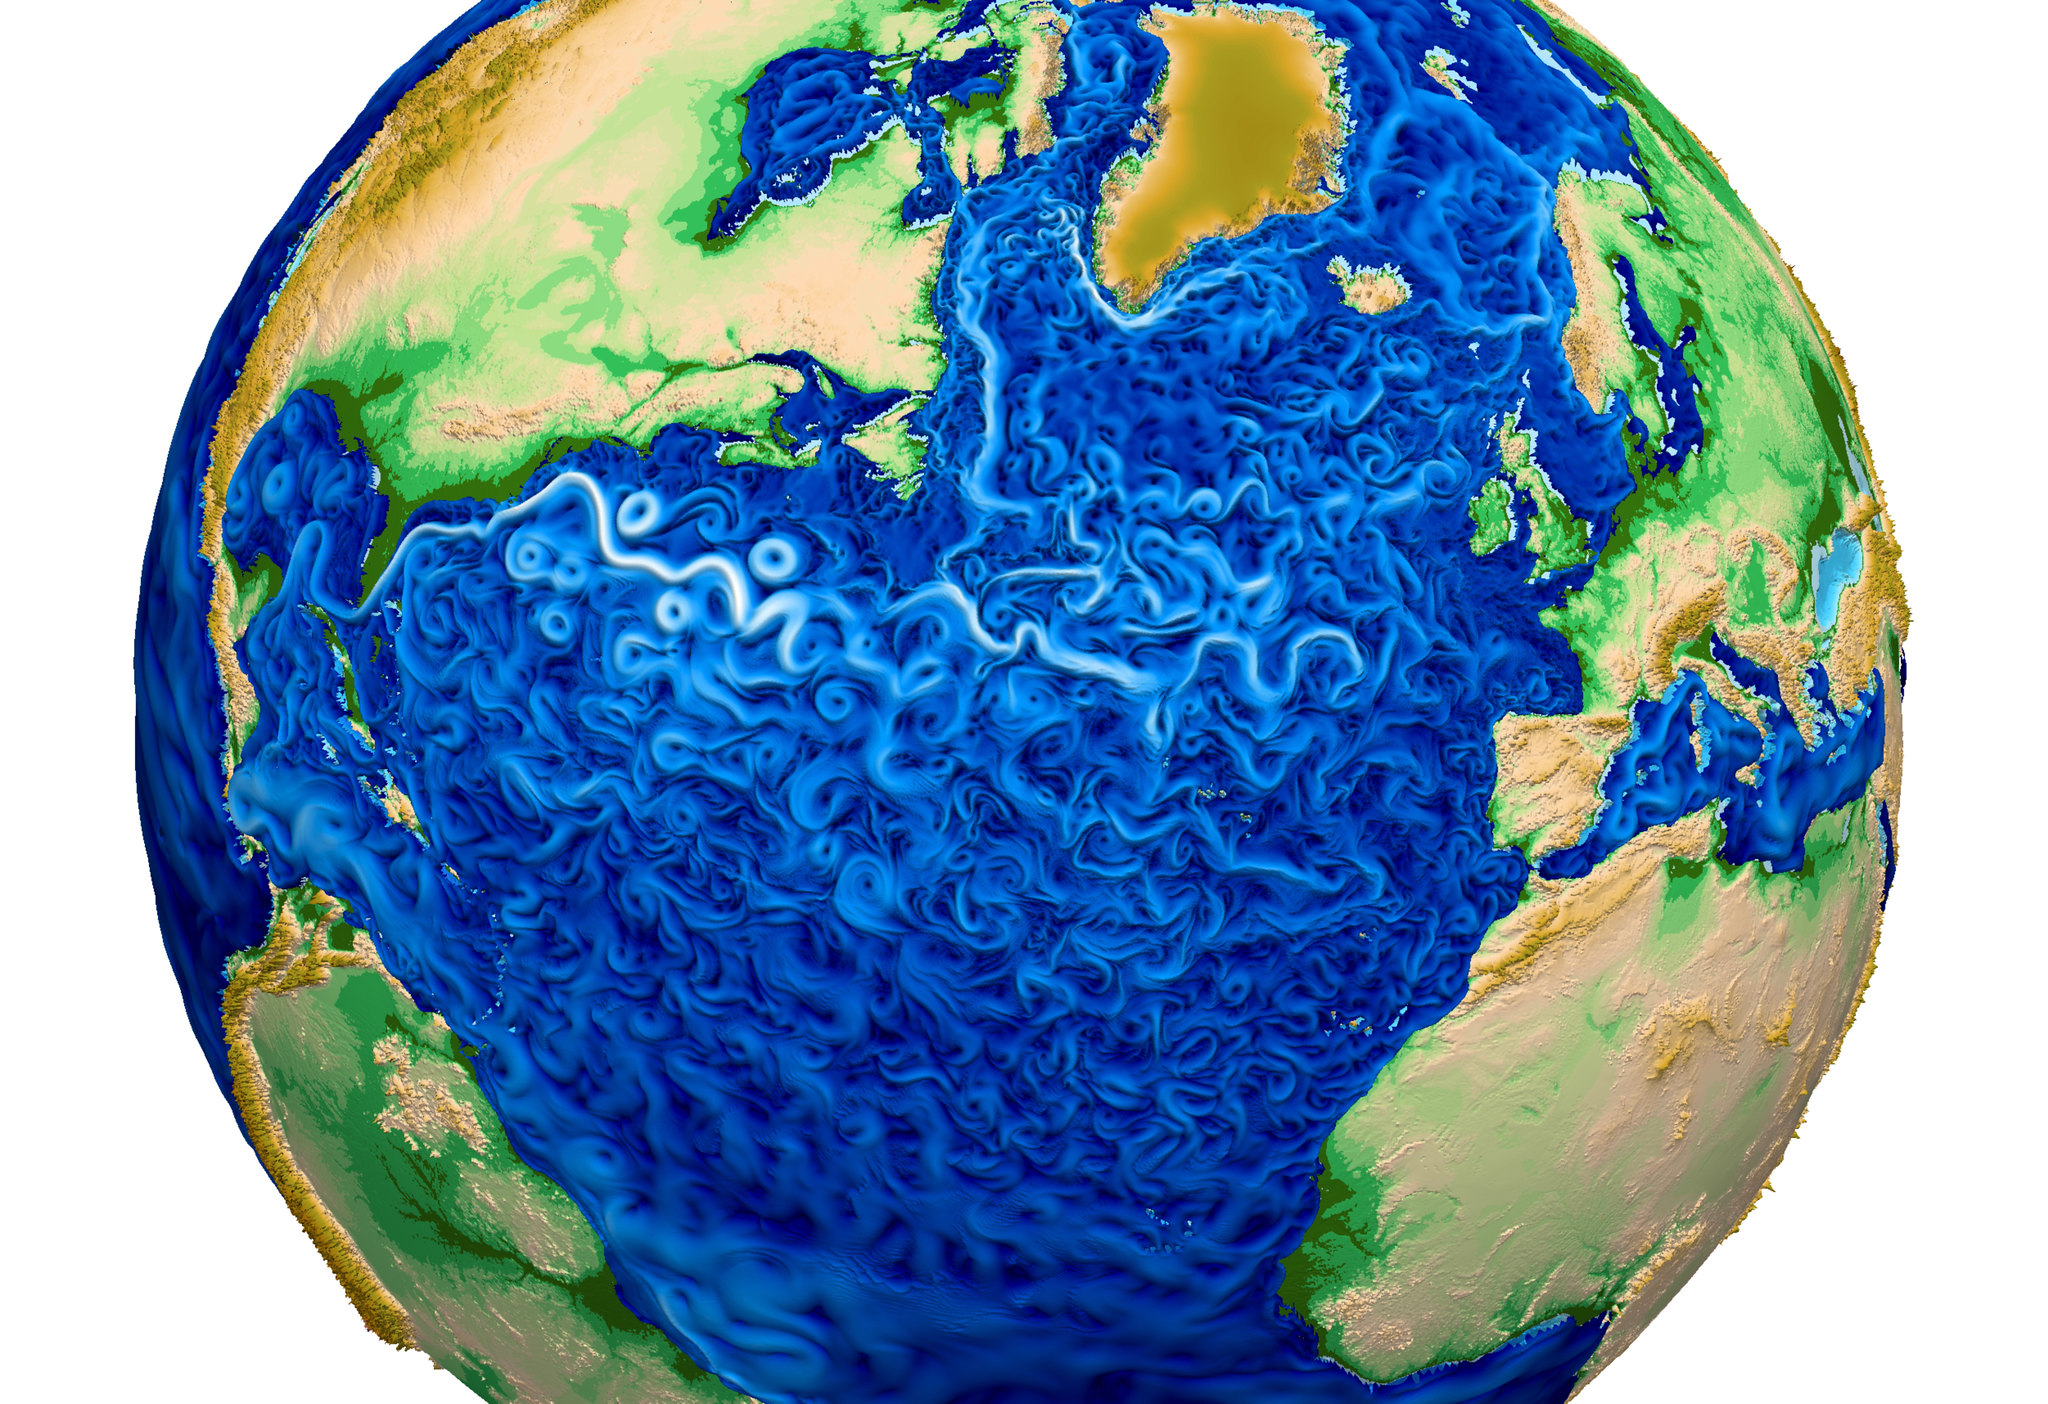
Another visualization (March 2012) shows sea surface current flows.
The flows are colored by corresponding sea surface temperature data.
This visualization is rendered for display on very high resolution devices like hyperwalls or for print media. This visualization was produced using model output from the joint MIT/JPL project: Estimating the Circulation and Climate of the Ocean, Phase II or ECCO2..
ECCO2 uses the MIT general circulation model (MITgcm) to synthesize satellite and in-situ data of the global ocean and sea-ice at resolutions that begin to resolve ocean eddies and other narrow current systems, which transport heat and carbon in the oceans.
The ECCO2 model simulates ocean flows at all depths, but only surface flows are used in this visualization.
The simulation will help researchers understand ocean temperatures,
which add to the climate's complexities by acting like giant sponges
for additional heat.
The model's ability to simulate eddies — small
pockets of moving water that break away from the main current and help
transport heat through the oceans — as broad paint-brush strokes is
already promising.
Such fine details will help researchers accurately
model the effects of climate change.
Global ocean surface kinetic energy with maximum kinetic energy – or movement energy – designated by white with minimum values in black.
Color is on a log scale.
Observe the prominent jet stream off the eastern coast of the U.S. with adjacent eddy rings.
When winds blow across the ocean, kinetic energy is transferred from the wind to water as a result of the friction between the wind and the sea surface. Sunlight on the oceans also adds thermal energy to the surface layer, and currents carry the thermal energy to other regions of the world.
The model itself is only a small part of the U.S. Department of Energy's Accelerated Climate Model for Energy
(ACME), which is expected to be the most complete climate and Earth
system model once it is finished.
The model is being developed with
resources from 14 research institutions across the United States,
including eight national laboratories.
ACME, which will be created on the country's most advanced
supercomputers, will answer questions in three areas that drive climate
change: Earth's water cycle, biogeochemistry and the cryosphere (the
ice-covered regions of the planet).
Another visualization (February 2012) shows the Gulf Stream stretching from the Gulf of Mexico all the way over towards Western Europe.
This visualization was designed for a very wide, high resolution display (e.g., a 5x3 hyperwall display). This visualization was produced using NASA/JPL's computational model called Estimating the Circulation and Climate of the Ocean, Phase II or ECCO2. ECCO2 is high resolution model of the global ocean and sea-ice.
ECCO2 attempts to model the oceans and sea ice to increasingly accurate resolutions that begin to resolve ocean eddies and other narrow-current systems which transport heat and carbon in the oceans.
The ECCO2 model simulates ocean flows at all depths, but only surface flows are used in this visualization.
There are 2 versions provided: one with the flows colored with gray, the other with flows colored using sea surface temperature data.
The sea surface temperature data is also from the ECCO2 model.
The dark patterns under the ocean represent the undersea bathymetry.
Topographic land exaggeration is 20x and bathymetric exaggeration is 40x.
Studies add support to the idea that the oceans are taking up some of the excess heat, at least for the moment. In a reconstruction of Pacific Ocean temperatures in the last 10,000 years, researchers have found that its middle depths have warmed 15 times faster in the last 60 years than they did during apparent natural warming cycles in the previous 10,000.
The main reason soaring greenhouse gas emissions have not caused air temperatures to rise more rapidly is that oceans have soaked up much of the heat. But new evidence suggests the oceans’ heat-buffering ability may be weakening.
For decades, the earth’s oceans have soaked up more than nine-tenths of the atmosphere’s excess heat trapped by greenhouse gas emissions.
By stowing that extra energy in their depths, oceans have spared the planet from feeling the full effects of humanity’s carbon overindulgence.
But as those gases build in the air, an energy overload is rising below the waves.
A raft of recent research finds that the ocean has been heating faster and deeper than scientists had previously thought.
And there are new signs that the oceans might be starting to release some of that pent-up thermal
energy, which could contribute to significant global temperature increases in the coming years.
This map shows trends in global ocean heat content, from the surface to 2,000 meters deep. Yellow, orange, and red zones represent increases in ocean temperatures since 2006, as measured by the Argo network of 3,500 floating sensors. Green, blue, and violet zones depict temperature decreases, as measured in watts per square meter. The map shows that much of ocean warming in the past decade has occurred in the Southern Hemisphere. (Image credit: Roemmich et al., Nature Climate Change)
The ocean has been heating at a rate of around 0.5 to 1 watt of energy per square meter over the past decade, amassing more than 2 X 10²³
joules of energy — the equivalent of roughly five Hiroshima bombs
exploding every second — since 1990.
Vast and slow to change
temperature, the oceans have a huge capacity to sequester heat,
especially the deep ocean, which is playing an increasingly large uptake and storage role.
That is a major reason the planet’s surface temperatures have risen less
than expected in the past dozen or so years, given the large greenhouse
gas hike during the same period, said Kevin Trenberth, senior scientist
with the National Center for Atmospheric Research.
The phenomenon, which some call the “hiatus,” has challenged scientists
to explain its cause.
But new studies indicate that the forces behind
the supposed hiatus are natural — and temporary — ocean processes that may already be changing course.
Pacific trade winds, for instance, which have been unusually strong for the past two decades thanks to a 20- to 30-year cycle called the Interdecadal Pacific Oscillation, have been pumping atmospheric heat down
into the western Pacific.
The winds are powered up by the cycle’s
current negative, or cool, phase.
But scientists say that when the cycle
eventually swings back to its positive, warm phase, which history
suggests could occur within a decade, the winds will wind down, the
pumping will let up, and buried heat will rise back into the atmosphere.
“There’s a hint this might already be starting to happen,” said Matthew
England, an ocean sciences professor at the University of New South
Wales in Sydney, Australia. Without the winds’ cooling action,
atmospheric temperatures could surge as they did in the 1980s and 1990s,
the last time the oscillation was positive. During the next positive
phase, “it’s very much likely that [warming] will be as fast or even
faster,” he said, “because those greenhouse gases are now more
elevated.”
Scientists are also learning that the ocean has gained more heat, and at
greater depth, than they had realized.
That means the entire climate is
even more out-of-whack than is evident today.
“If you want to measure the energy imbalance of the earth, the ocean
temperature gives you nearly the whole story,” said Dean Roemmich,
oceanography professor at the University of California San Diego’s
Scripps Institution of Oceanography,
The long-term heat gain in the top 700 meters (.43 miles) of the world’s oceans has likely been underestimated by as much as half,
according to Lawrence Livermore National Laboratories research
scientist Paul Durack.
Earlier measurements had lowballed heat
accumulation due to historically sparse observations for large parts of
the ocean.
The figures were especially low for the Southern Hemisphere,
which contains about 60 percent of the planet’s oceans but was very
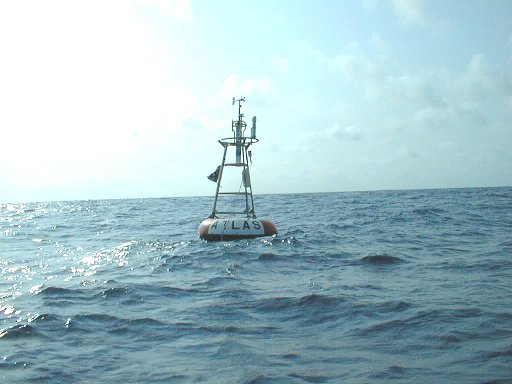
poorly sampled — until Argo, an array of around 3,500 floating sensors, was deployed worldwide in 2005.
Argo is a system for observing temperature, salinity, and currents in the Earth's oceans which has been operational since the early 2000s.
An updated analysis by Durack and colleagues found that from 1970 to
2004, the upper 700 meters of oceans in the Southern Hemisphere had
gained from 48 to 166 percent more heat than earlier observations had
estimated.
Globally, the findings suggest, upper oceans hold 24 to 58
percent more heat than most current climate models assumed.
“We have likely been missing a portion of the heat,” said Durack.
His
study and other recent research, he said, suggests that “we may need to
go back and start recalculating the climate sensitivity estimates of the
earth.”
Argo, a network devoted to recording the state of the oceans
Excess energy is also penetrating deeper into the ocean and farther
south, Roemmich and colleagues found, analyzing Argo data measuring heat
down to 2,000 meters (1.24 miles).
The network provides the first
comprehensive measurements of the deeper ocean; most prior readings
stopped at 700 meters.
The researchers found that from two-thirds to 98 percent
of the substantial ocean heat gain between 2006 and 2013 took place
well south of the equator, where giant gyres drew it down.
And half of
the gain occurred from 500 to 2,000 meters deep.
This graph from the U.S. National Oceanic and Atmospheric Administration shows the increase in the global ocean heat content from 1955 to the present, as measured in joules — a unit of thermal energy. Recent research finds that the ocean has been heating faster and deeper than scientists had previously thought. (Image credit: NOAA)
Roemmich estimates that at depths from 500 to 2000 meters, oceans are
warming by .002 degrees Celsius every year, and in the top 500 meters,
they’re gaining .005 degrees C. annually.
While that may not seem like a
big temperature jump, it amounts to a staggering load of heat when
multiplied throughout the depths of this immense system that covers 70
percent of the planet.
Temperature gains are larger at the sea surface, which heats faster than the ocean as a whole.
The top 75 meters
have warmed an average of .01 degrees C per year since 1971.
But forces
like winds and currents have strong effects on the ocean surface, and
temperature measurements there are highly variable.
Still, they indicate that some areas of the ocean are heating up especially fast, such as the Arctic Ocean
— which this year had its lowest winter ice year on record — and is
absorbing much more solar energy as melting ice cover exposes new dark
surfaces.
Summer sea surface temperatures in some sections have risen
around 1 degree C over the past two decades — nearly five times the
global average.
Parts of the Indian Ocean, North Atlantic, and waters
surrounding Antarctica are warming at nearly the same rate.
More heat stored in the ocean now means more will inevitably return to the atmosphere.
“A couple of El Niño events will do the trick,” said England.
The warm
water and calm winds of this periodic Pacific tropical condition are “a
big way to get subsurface heat back to the surface.”
Meteorologists say a
mild El Niño condition is underway this year.
The oceans won’t eject all that excess heat in a giant gush, of course —
seawater’s heat capacity is huge and a portion will be locked away for
millennia.
Some of that banked energy will discharge into air at the
ocean surface, however, and the atmosphere will heat up.
Given the enormity of
the ocean’s thermal load, even a tiny change has a big impact.
“But the other thing I want to point out,” England added, “is that
greenhouse gases in the atmosphere are at such high concentrations
compared to what they were 100 years ago that you don’t need to bring
heat back up from the ocean to the surface to get future warming — you
just need to slow down the heat uptake by the ocean, and greenhouse
gases will do the rest.”
Recent weather trends suggest that uptake mechanisms like subsurface
heat burial in the tropical Pacific and vertical heat transfer to the
ocean depths could already be declining.
“And so this is why 2014 is now the warmest year on record,”
said Trenberth.
“In other words, the heat is no longer going deep into
the ocean. The wind patterns have changed, the surface of the Pacific
Ocean has warmed up. And that has consequences.”
One of the major consequences is higher sea levels.
Thermal expansion —
water swells as it heats — accounts for a substantial portion of rising
seas, so warmer oceans mean even worse news for already threatened
islands and coasts.
The effects on sea circulation patterns and weather are complex and
difficult to tease out from natural variation, requiring long-term
observation.
But mounting evidence points to a variety of likely
impacts.
Among them: Rapidly warming Arctic waters could worsen summer
heat waves in Europe and North America by lowering the temperature
differential that drives mid-latitude circulation.
And a recent rash of unusually intense cyclones may be linked to changes in the tropical Pacific.
As for marine life, ocean heating already presents multiple,
intensifying dangers.
Warmer water holds less oxygen and other gases.
On
top of that, warming increases ocean stratification, which blocks the
movement of oxygen-rich surface waters to lower depths.
The resulting
low-oxygen zones are now spreading, and climate models predict they
could be 50 percent larger by the end of this century.
Not only are the
zones inhospitable to most sea creatures, they squeeze critical upper
ocean habitat as they enlarge, said Sarah Moffitt, a postdoctoral
researcher at the University of California, Davis’ Bodega Marine
Laboratory.
“So you are losing this substantial habitat footprint for
oxygen-respiring organisms,” she said.
“We are seeing signals of oxygen
loss in every ocean basin in the global ocean.”
A recent study
by Moffitt and colleagues of seafloor sediments from the end of the
last Ice Age, around 10,000 to 17,000 years ago, revealed that Pacific
Ocean ecosystems from the Arctic to Chile “extensively and abruptly lost
oxygen when the planet warmed through deglaciation,” she said.
The
findings offer a glimpse of what may lie ahead.
“It shows us that in a
carbon-rich, warm future, ocean systems have the capacity to change in a
way that has no analogue” in today’s world, Moffitt said.
A further concern is that temperature increases could diminish the
ocean’s vital role as a carbon sink. Absorbing CO2 from the atmosphere
is another way oceans mitigate greenhouse gas impacts, although marine
waters are growing increasingly acidic as a result.
Currently, up to
nearly half of humanity’s carbon dioxide output ends up dissolved in
seawater, with most landing in the Southern Hemisphere oceans,
where wind-driven eddies bury it deeply.
But warm waters also hold less
CO2.
And those cyclical winds likely will someday decrease.
The outcome
of rising ocean temperatures and decreasing winds would be faster ocean
CO2 saturation and far more heat-trapping gas entering the atmosphere — a scenario potentially akin to the massive ocean carbon release that helped end the last Ice Age.
There’s still time to turn things around, scientists say.
“We have the technology today to make a positive impact on climate, and
all we lack is the political will,” said John Abraham, a thermal
sciences professor at the University of St. Thomas in St. Paul,
Minnesota.
But he and others worry that by covering up the effects of
our long fossil fuel bender, oceans are keeping us from realizing just
how off-kilter the earth’s climate system has become.
“The ocean’s doing us a favor by grabbing about 90 percent of our heat,” Abraham said.
“But it’s not going to do it forever.”
Links :
CSMonitor : Oceans could take thousands of years to recover from climate change, study says
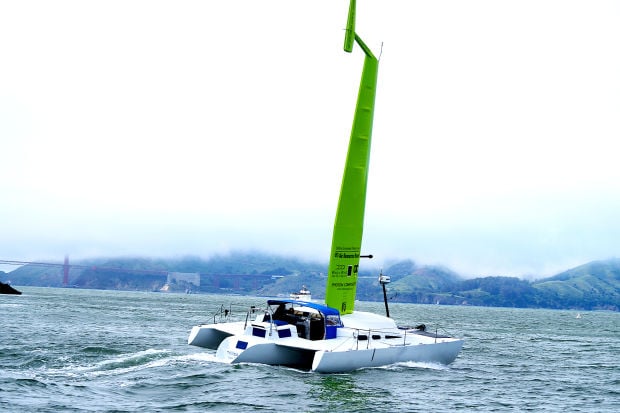
The Trillizas, a trimaran owned by Jay and Pam Gardner of Napa, is a testing bed for the WingSail, a 40-foot-tall rigid sail that allows a boat to propel itself using less engine power for reduced air pollution.
After Bay Area testing that began in February 2014, the WingSail project, which has received funds from regional and state air quality authorities, had its public debut in May 2014 in San Francisco. Wind+Wing Technologies photo
For all their convenience, most commuter ferries are dirty machines.
A high-speed one burns 6,600 gallons of fuel a day, on average.
Multiply that by the number of passenger boats on a busy waterway, like San Francisco Bay, and you’ve got a lot of spent diesel.
“You can drive your Cadillac Escalade across the Golden Gate Bridge and get 19 miles to the gallon and you’d still be far more environmentally correct than to take the ferry system in the way it’s currently operated,” says Jay Gardner, president of Wind+Wing Technologies (WWT) in Napa, California.
Gardner claims his company can reduce that diesel consumption by up to 40 percent.
WWT is developing a ferry that makes use of an abundant--and free--natural resource: wind.
Instead of relying solely on engine power, specially designed catamarans will be equipped with vertical carbon-fiber “wing sails” similar to those introduced in the last America’s Cup sailing race.
The substantial area of the wings--nearly 3,000 square feet--will catch up to 72,000 pounds of wind force.
(WWT is working with nautical engineers to ensure the ferries remain stable by designing interior bulkheads that have textured ribbing, which disperses these large forces over the two hulls of the boats.)
The wings will be equipped with GPS systems and vessel data recorders, and powered by photovoltaic cells.
Used in conjunction with an electric or clean diesel engine, the wings automatically adjust position to capture the wind, providing additional propulsion.
Unlike traditional cloth sails, the wings require no expertise to operate, which has been a big stumbling block for wind-powered commercial vessels in the past.
When ferryboat operators want to disengage the wings, such as during docking or especially windy conditions, they won’t have to fold them down.
Instead, crew members can simply set the wings in a neutral position. Even better, the process of using and disengaging the wings is completely autonomous.
“The crew doesn’t need to know anything about the wing or how it works,” explains Richard Jenkins, president of Photon Composites, the company constructing the wings.
“It’s literally an on-off system.”
WWT plans to outfit custom, 149-passenger ferryboats with two 75-foot-tall wings.
Ultimately, the design can be scaled up to carry 500 passengers.
And while $2 million for a pair of wings ain’t cheap, WWT says they would likely pay for themselves in fuel savings in less than two years.
The company has already run tests on a smaller 42-foot prototype vessel and is now in talks with public and private investors to service the route between San Francisco and Treasure Island
The project could be live by 2020.
Finally, ferryboat travel will be befitting of a modern, environmentally conscious city.
How It Works
Illustration by Graham Murdoch
Wing : Each wing weighs about 4,000 pounds and is connected to the vessel by a 75-foot spine that turns freely. Three microphones measure audio signals from the wind. A computer then analyzes the readings to determine the wind’s direction.
Trim Tab : Based on real-time wind direction, an actuator offsets the thin, outermost piece on the top of the wing by 15 degrees. This action forces the trim tab to move the wing, which provides thrust to the ferry, propelling it forward.
Counterweight : A 200-pound lead beam balances the weight of the wing, making it sensitive to even tiny changes in wind direction.
Solar Cell : A nine-square-foot photovoltaic cell generates about 50 watts of power to operate the wind sensor, wing controls, GPS, and communication tools.5.
Bulkhead : Unlike traditional sailboats, these ferries need an interior bulkhead that runs the width of the catamaran. It will evenly disperse the wings’ force on the boat--up to 72,000 pounds--between the two hulls to ensure stability.