Saturday, February 15, 2014

Petra storm in aerial pictures


"Yesterday, with my trusty pilot Thierry Leygnac and Christophe Potter, my assistant with me for 16 years, we had the deep feeling of never having experimented so many emotions flying in a storm on our shores !


Other pictures of the storm with Benoit Stichelbaut

 Storm Petra, February 5th, Pointe du Raz, France. 
Erik Brin

 Ar Men by Charles Marion

 Petra (February 5th) in the fishing harbour of Porthleven (Cornwall)
photo Bernie Pettersen

Links :
  • Vimeo : Petra storm, port Coton Belle-Ile (02/2014) by Louis-Alban Kim
  • Vimeo : shooting helico by Valery Joncheray
  • YouTube : Ruth storm (8 au 9 février 2014) by Nefertiti Productions

Friday, February 14, 2014

Climate change is here now and it could lead to global conflict

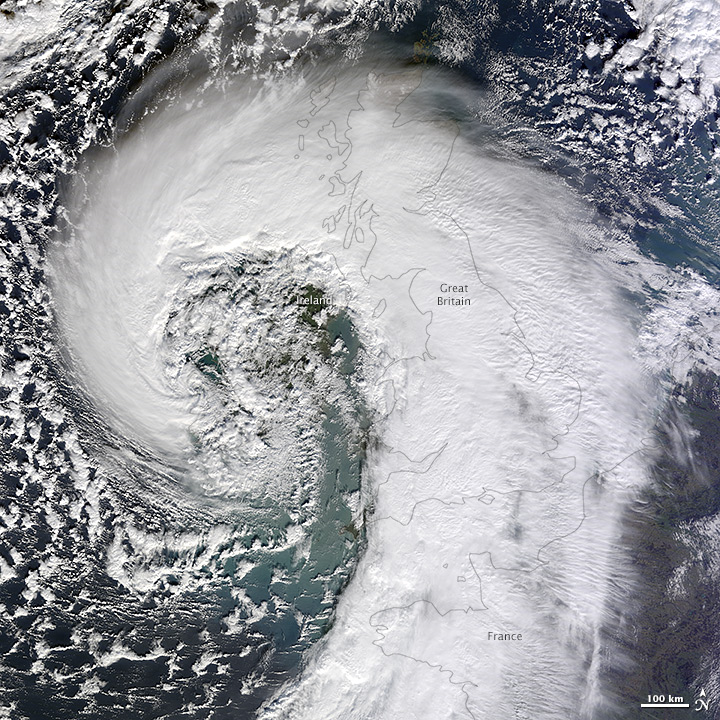
Satellite image shows scale of storm that hit the UK.
(see NASA : extratropical cyclone over the UK)

From The Guardian by Nicolas Stern, chair of the Grantham Research Institute on Climate Change and the Environment at the LSE and president of the British Academy.

Extreme weather events in the UK and overseas are part of a growing pattern that it would be very unwise for us, or our leaders, to ignore, writes the author of the influential 2006 report on the economics of climate change

The record rainfall and storm surges that have brought flooding across the UK are a clear sign that we are already experiencing the impacts of climate change.
Many commentators have suggested that we are suffering from unprecedented extreme weather. There are powerful grounds for arguing that this is part of a trend.
Four of the five wettest years recorded in the UK have occurred from the year 2000 onwards.
Over that same period, we have also had the seven warmest years.
That is not a coincidence.
There is an increasing body of evidence that extreme daily rainfall rates are becoming more intense, in line with what is expected from fundamental physics, as the Met Office pointed out earlier this week.
A warmer atmosphere holds more water.
Add to this the increase in sea level, particularly along the English Channel, which is making storm surges bigger, and it is clear why the risk of flooding in the UK is rising.

Infra-red satellite animation from EUMETSAT showing a series of storms which have affected the United Kingdom and Ireland over the past two weeks.

But it is not just here that the impacts of climate change have been felt through extreme weather events over the past few months.
Australia has just had its hottest year on record, during which it suffered record-breaking heatwaves and severe bushfires in many parts of the country.
And there has been more extreme heat over the past few weeks.
Argentina had one of its worst heatwaves in late December, while parts of Brazil were struck by floods and landslides following record rainfall.

MDG : A ship washed ashore by Super Typhoon Haiyan at Anibong in Tacloban, Philippines 
A ship washed ashore by typhoon Haiyan at Anibong in Tacloban, Philippines, 5 February 2014. Photograph: Mark Tran for The Guardian 
 
And very warm surface waters in the north-west Pacific during November fuelled Typhoon Haiyan, the strongest tropical cyclone to make landfall anywhere in the world, which killed more than 5,700 people in the Philippines.

This is a pattern of global change that it would be very unwise to ignore.
The Intergovernmental Panel on Climate Change last September pointed to a changing pattern of extreme weather since 1950, with more heatwaves and downpours in many parts of the world, as the Earth has warmed by about 0.7C.
The IPCC has concluded from all of the available scientific evidence that it is 95% likely that most of the rise in global average temperature since the middle of the 20th century is due to emissions of greenhouse gases, deforestation and other human activities.

floods 
Sussex police search and rescue officers evacute residents through a flooded street in Egham, Surrey.
Photograph: Sang Tan/AP

The upward trend in temperature is undeniable, despite the effects of natural variability in the climate which causes the rate of warming to temporarily accelerate or slow for short periods, as we have seen over the past 15 years.
If we do not cut emissions, we face even more devastating consequences, as unchecked they could raise global average temperature to 4C or more above pre-industrial levels by the end of the century.
This would be far above the threshold warming of 2C that countries have already agreed that it would be dangerous to breach.
The average temperature has not been 2C above pre-industrial levels for about 115,000 years, when the ice-caps were smaller and global sea level was at least five metres higher than today.
The shift to such a world could cause mass migrations of hundreds of millions of people away from the worst-affected areas.
That would lead to conflict and war, not peace and prosperity.

Satellite photos of the River Parrett on the Somerset Levels taken before the recent flooding and on 8 February. 
Satellite photos of the river Parrett on the Somerset Levels
taken before the recent flooding and on 8 February.
Photograph: UK Space Agency/SWNS.com 
 
In fact, the risks are even bigger than I realised when I was working on the review of the economics of climate change for the UK government in 2006.
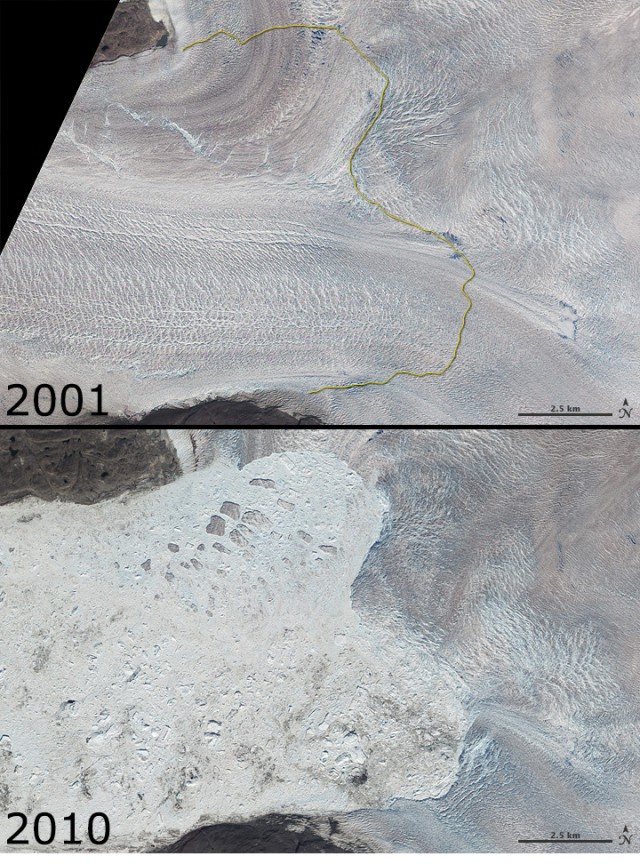
Since then, annual greenhouse gas emissions have increased steeply and some of the impacts, such as the decline of Arctic sea ice, have started to happen much more quickly.

We also underestimated the potential importance of strong feedbacks, such as the thawing of the permafrost to release methane, a powerful greenhouse gas, as well as tipping points beyond which some changes in the climate may become effectively irreversible.
What we have experienced so far is surely small relative to what could happen in the future.
We should remember that the last time global temperature was 5C different from today, the Earth was gripped by an ice age.
So the risks are immense and can only be sensibly managed by reducing greenhouse gas emissions, which will require a new low-carbon industrial revolution.
History teaches us how quickly industrial transformations can occur through waves of technological development, such as the introduction of electricity, based on innovation and discovery.
We are already seeing low-carbon technologies being deployed across the world, but further progress will require investment and facing up to the real prices of energy, including the very damaging emissions from fossil fuels.

Floods in Worcester  
Christian Gander makes his way through floodwater as he leaves his home on Waterworks Road in Worcester.
Photograph: Joe Giddens/PA 
 
Unfortunately, the current pace of progress is not nearly rapid enough, with many rich industrialised countries being slow to make the transition to cleaner and more efficient forms of economic growth.
The lack of vision and political will from the leaders of many developed countries is not just harming their long-term competitiveness, but is also endangering efforts to create international co-operation and reach a new agreement that should be signed in Paris in December 2015.

Delay is dangerous.
Inaction could be justified only if we could have great confidence that the risks posed by climate change are small.
But that is not what 200 years of climate science is telling us.
The risks are huge.

Fortunately poorer countries, such as China, are showing leadership and beginning to demonstrate to the world how to invest in low-carbon growth.
The UK must continue to set an example to other countries.
The 2008 Climate Change Act, which commits the UK to cut its emissions by at least 80% by 2050, is regarded around the world as a model for how politicians can create the kind of clear policy signal to the private sector which could generate billions of pounds of investment.
Weakening the Act would be a great mistake and would undermine a strong commitment made by all of the main political parties.
Squabbling and inconsistent messages from ministers, as well as uncertainty about the policies of possible future governments, are already eroding the confidence of businesses.
Government-induced policy risk has become a serious deterrent to private investment.
Instead, the UK should work with the rest of the European Union to create a unified and much better functioning energy market and power grid structure.
This would also increase energy security, lower costs and reduce emissions.
What better way is there to bring Europe together?

Datchet floods 
A car lies half submerged after the Thames flooded in Datchet, Berkshire. Photograph: Peter Macdiarmid/Getty Images 
 
The government will also have to ensure the country becomes more resilient to those impacts of climate change that cannot now be avoided, including by investing greater sums in flood defences.
It should resist calls from some politicians and parts of media to fund adaptation to climate change by cutting overseas aid.
It would be deeply immoral to penalise the 1.2 billion people around the world who live in extreme poverty.
In fact, the UK should be increasing aid to poor countries to help them develop economically in a climate that is becoming more hostile largely because of past emissions by rich countries.
A much more sensible way to raise money would be to implement a strong price on greenhouse gas pollution across the economy, which would also help to reduce emissions.
It is essential that the government seizes this opportunity to foster the wave of low-carbon technological development and innovation that will drive economic growth and avoid the enormous risks of unmanaged climate change.
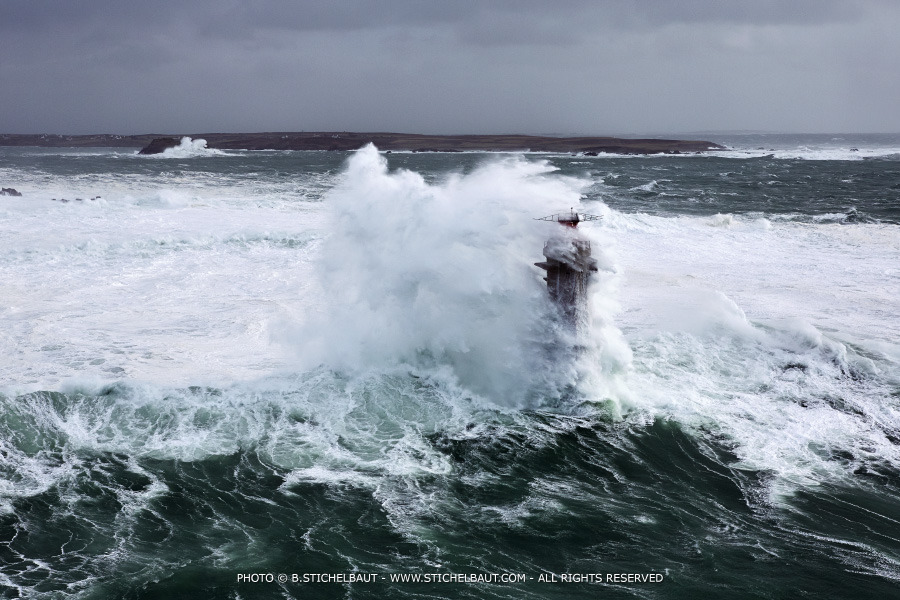
Thursday, February 13, 2014

Canada CHS update in the Marine GeoGarage

As our public viewer is not yet available
(currently under construction, upgrading to Google Maps API v3 as v2 is officially no more supported),
this info is primarily intended to our B2B customers which use our nautical charts layers
in their own webmapping applications through our GeoGarage API.

41 charts have been updated (February 3, 2014) in the GeoGarage platform :
    • 1202 CAP ÉTERNITÉ À/TO SAINT-FULGENCE
    • 1209 SAINT-FULGENCE À / TO RIVIÈRE SHIPSHAW
    • 1313 BATISCAN AU/TO LAC SAINT-PIERRE
    • 3058A ARROWHEAD TO/À BLANKET CREEK
    • 3058B BLANKET CREEK TO/À REVELSTOKE
    • 3549 QUEEN CHARLOTTE STRAIT WESTERN PORTION/PARTIE QUEST
    • 3550 APPROACHES TO/APPROCHES À SEYMOUR INLET AND/ET BELIZE INLET
    • 3598 CAPE SCOTT TO CAPE CALVERT
    • 3605 QUATSINO SOUND TO / À QUEEN CHARLOTTE STRAIT
    • 3624 CAPE COOK TO CAPE SCOTT
    • 3741 OTTER PASSAGE TO BONILLA ISLAND
    • 4001 GULF OF MAINE TO STRAIT OF BELLE ISLE / AU DÉTROIT DE BELLE ISLE
    • 4015 SYDNEY TO/À SAINT-PIERRE
    • 4016 SAINT-PIERRE TO/À ST JOHN'S
    • 4017 CAPE RACE TO / À CAPE FREELS
    • 4023 NORTHUMBERLAND STRAIT / DÉTROIT DE NORTHUMBERLAND
    • 4202 HALIFAX HARBOUR POINT PLEASANT TO/À BEDFORD BASIN
    • 4203 HALIFAX HARBOUR BLACK POINT TO/À POINT PLEASANT
    • 4237 APPROACHES TO / APPROCHES DE HALIFAX HARBOUR
    • 4277 GREAT BRAS D'OR / ST. ANDREWS AND / ET ST. ANNS BAY
    • 4278 GREAT BRAS D'OR AND / ET ST PATRICKS CHANNEL
    • 4279 BRAS D'OR LAKE
    • 4308 ST. PETERS BAY TO/À STRAIT OF CANSO
    • 4340 GRAND MANAN
    • 4422 CARDIGAN BAY
    • 4593 SUNDAY COVE ISLAND TO\À THIMBLE TICKLES
    • 4625 BURIN PENINSULA TO/À SAINT-PIERRE
    • 4639 GARIA BAY AND/ET LE MOINE BAY
    • 4641 PORT AUX BASQUES AND APPROACHES / ET LES APPROCHES
    • 4667 SAVAGE COVE TO/À ST BARBE BAY
    • 4679 HAWKES BAY \ PORT SAUNDERS\ BACK ARM
    • 4826 BURGEO TO/À FRANÇOIS
    • 4827 HARE BAY TO / À FORTUNE HEAD
    • 4831 FORTUNE BAY NORTHERN PORTION/PARTIE NORD
    • 4839 HEAD OF/FOND DE PLACENTIA BAY
    • 4847 CONCEPTION BAY
    • 4851 TRINITY BAY - SOUTHERN PORTION / PARTIE SUD
    • 4855 BONAVISTA BAY SOUTHERN PORTION / PARTIE SUD
    • 4864 BACK ISLAND TO/À LITTLE DENIER ISLAND
    • 4906 WEST POINT À/TO BAIE DE TRACADIE
    • 4911 ENTRÉE À/ENTRANCE TO MIRAMICHI RIVER
      So 690 charts (1665 including sub-charts) are available in the Canada CHS layer. (see coverage)

      Note : don't forget to visit 'Notices to Mariners' published monthly and available from the Canadian Coast Guard both online or through a free hardcopy subscription service.
      This essential publication provides the latest information on changes to the aids to navigation system, as well as updates from CHS regarding CHS charts and publications.
      See also written Notices to Shipping and Navarea warnings : NOTSHIP

      This startup wants to reverse the tide on our overfished oceans

      Fish being raised in protected farms.
      Image credit : Bryce Groark

      From Entrepreneur by Catherine Clifford

      People are eating a lot of fish.
      More than ever before.
      Without some clever innovation, we may very well eat all the fish in the sea.
      That’s hardly an exaggeration, either.
      Where each person ate an average of 10 kilograms, or 22 pounds, of fish in 1960, the average person ate 19 kilograms, or almost 42 pounds, of fish in 2011, according to a report from the Food and Agriculture Organization of the United Nations.


      The report claims that about 85 percent of the world's oceans are at their fishing limits.
      Which means that, if current rates continue, the oceans will be near barren in 35 years.


      That’s where aquaculture comes in.
      Aquaculture, or the breeding and harvesting of aquatic animals and plants, has become a growing practice and is seen as a solution to the fish consumption crisis.
      In 1951, aquaculture netted 640,000 kilograms, or 1.4 million pounds, of fish around the world.
      By 2011, aquaculture was bringing in 84 billion kilograms, or 185 billion pounds, of fish.

      Image credit: Made by Aqua-Spark with data from a 2012 report released by
      the Food and Agriculture Department of the United Nations.

      “Beyond 2030, aquaculture will likely dominate future global fish supply. Consequently, ensuring successful and sustainable development of global aquaculture is an imperative agenda for the global economy,” says a report on the fish industry from the World Bank released this month.
      Hoping to foster innovation in this space, two entrepreneurs, Amy Novogratz and Mike Velings, have launched an investment fund called Aqua-Spark.
      The fund seeks out sustainable fish-farming techniques and innovations and invests in them.
      In particular, the Netherlands-based investment fund will seek out best-in-class hatcheries to invest in, or new technologies to battle disease epidemics that fish battle in the fish farms.

      Prior to founding Aqua-Spark last year, Novogratz was the director of the TED Prize, an award given to an individual who demonstrates extraordinary global vision.
      Velings, meanwhile, is a serial entrepreneur and investor.
      He started Connexie, a payroll service in the Netherlands, and A-Spark Good Ventures, a company that invests in entrepreneurs around the world.

      This Startup Wants to Reverse the Tide on Our Overfished Oceans
      Aquaculture farms.
      Image credit: Bryce Groark.

      Novogratz and Velings met on a boat trip in the Galapagos inspired by TED Prize winner Sylvia Earle, a life-long oceanographer and explorer.
      Earle won the TED prize in 2009 and then took 100 people on the Galapagos voyage in 2010.
      There, Novogratz and Velings determined that they would make preservation of the oceans their passion. They also fell in love and ended up getting married.
      Aqua-Spark had raised $5 million in seed funding as of early February, but the goal is to raise at least 15 million euro to get started. In the next 10 years, Velings says he wants Aqua-Spark to be a 200 to 300 million euro fund (about $270 million to $410 million).
      Unlike a venture capital company, Aqua-Spark does not expect to cash out of the investment.
      So, while a VC will invest in a startup and then look for a return on that investment either by the entrepreneur selling the company or going public, Aqua-Spark does not look for entrepreneurs to cash out quickly.

       
      That’s because aquaculture is a long-term cash-intensive business.
      Building fish farms is expensive.
      And the infrastructure required to build recirculating aquaculture systems, which are completely closed systems and entirely self-sustaining, is particularly expensive.
      Initial investments in aquaculture businesses will run from 250,000 euros to 5 million euros (about $340,000 to $7 million), depending on the idea.
      Rather than looking for a quick cash-out, Aqua-Spark will make money through dividend returns. And because of the steady nature of the industry, the company expects to make revenues from dividends of 12 percent per year after the first five to seven years.
      Returns of 12 percent or higher are pretty impressive, and that’s exactly part of Aqua-Spark’s pitch to investors.
      “This is one of the few places you can make an old-fashioned, handsome return combined with social and environmental good. You can feel good about it but you can also -- it is a very solid investment,” says Velings.

      Wednesday, February 12, 2014

      NZ Linz update in the Marine GeoGarage

      As our public viewer is not yet available
      (currently under construction, upgrading to Google Maps API v3 as v2 is officially no more supported),
      this info is primarily intended to
      our iPhone/iPad universal mobile application users
      (Marine NZ on the App Store) 
      and our B2B customers which use our nautical charts layers
      in their own webmapping applications through our GeoGarage API.  


      9 charts have been updated in the Marine GeoGarage
      (Linz January update published February 7, 2014

      • NZ51 Tauroa Point to Cape Brett
      • NZ52 Cape Brett to Cuvier Island
      • NZ512 Cape Karikari to Cape Brett
      • NZ521 Cape Brett to Bream Tail
      • NZ4314 LPG Terminal
      • NZ5214 Marsden Point
      • NZ5216 Poor Knights Islands, High Peak Rocks and Sugarloaf Rock
      • NZ5219 Approaches to Marsden Point
      • NZ5612 Napier Harbour
      Today NZ Linz charts (180 charts / 313 including sub-charts) are displayed in the Marine GeoGarage.

      Note :  LINZ produces official nautical charts to aid safe navigation in New Zealand waters and certain areas of Antarctica and the South-West Pacific.


      Using charts safely involves keeping them up-to-date using Notices to Mariners
      Reporting a Hazard to Navigation - H Note :
      Mariners are requested to advise the New Zealand Hydrographic Authority at LINZ of the discovery of new or suspected dangers to navigation, or shortcomings in charts or publications.

      Greenland glacier sets glacial speed record

      Water pressure greases the skids for Jakobshavn, clocked at 2 meters per hour.

      From Ars Technica by

      If the term “ice stream” sounds like an oxymoron to you, you haven't seen the Jakobshavn. (Pronounced “yah-cobes-hah-ven”.)
      This glacier on the western coast of Greenland is one of the few things in the crysophere that can’t really be said to move at a glacial pace.
      As ice flows from the center of Greenland to the edges, it gets funneled into low spots, forming outlet glaciers.
      In some places where that funneling is extreme and the ground surface is slick, the ice behaves like toothpaste being squeezed from a tube.
      These places are ice streams.

      Almost seven percent of the Greenland ice sheet gets forced through the Jakobshavn Glacier.
      This tremendous flow of ice makes Jakobshavn stand out—it once filled a fjord with a floating shelf of ice that was more than 35 km long.
      Once, but no more.
      That shelf has disappeared over the past 150 years as the glacier has receded; since the mid-1990s, it has retreated more than 10 kilometers.

       Satellite images of the Jakobshavn Glacier in 2001 and 2010.
      source : NASA

      Because so much ice moves through the Jakobshavn, it has been intensely studied.
      Since 2009, the University of Washington’s Ian Joughin and several collaborators have been using the German Aerospace Center’s TerraSAR-X satellite to precisely track the glacier’s velocity.
      (Records using other methods go back further.)
      The satellite data reveals that the Jakobshavn got even faster over the past two years, setting a new glacial speed record at over 46 meters per day in the summer of 2012.
      That’s almost 2 meters per hour.

      So why the acceleration? It has to do with the topography beneath the ice.
      Many factors that affect the flow of a glacier, and the conditions at the base make a huge difference.
      Where the ground isn’t frozen (which is more common than you might think), water pressure counteracts some portion of the glacier’s weight, reducing the friction that slows the glacier.
      Anything that raises that water pressure greases the skids and lets the glacier speed up.

      Much of the bedrock beneath Jakobshavn’s final stretch is well below sea level and filled with seawater, though the ice is thick enough that it sits on the bottom rather than floating.
      The ground below the end (or “terminus”) of the Jakobshavn isn’t flat, so as it retreats, the terminus finds itself in deeper or shallower water.
      In 2012, it retreated into the bottom of a depression several hundred meters deeper than its previous location.
      Since deeper water means higher water pressure, the ice there could flow more quickly, pulling on the ice behind it.
      The peak flow rate near the terminus in the summer of 2012 was about four times faster than speeds in the mid-1990s.
      The average speed for the year was nearly 3 times faster.

      What goes down will come up in this case, and the terminus will soon retreat to the shallower backside of this depression, which should slow it down a bit.
      The researchers believe that slower flow rate could last a few decades.
      Beyond that high point, however, is a much broader basin.
      Once the terminus starts to retreat into that basin, flow will ramp up again, surpassing even the current rate.
      It will then likely retreat 50 km to the other side of the basin before the end of the century as the increased flow rate helps it shed more ice.
      Between 2000 and 2011, the Jakobshavn Glacier alone lost ice equal to nearly 3 percent of global sea level rise.
      As it retreats and shrinks further, it will continue to make a sizeable contribution because Jakobshavn is what a big glacier looks like on fast-forward.

      Links :
      • Cryosphere : further summer speedup of Jakobshavn Isbræ

      Tuesday, February 11, 2014

      Mystery of huge underwater 'crop circles' solved

      This image shows mysterious ‘crop circles’ on the seabed off the Island of Møn, Denmark. 
      Image credit: Jacob Topsøe Johansen.


      Mysterious underwater rings of eelgrass, off the coast of Denmark, are the result of poison, biologists say.
      The rings weren't created by fairies, bombs, or visiting aliens, say researchers.

      They're not the work of World War II bombs or aliens or fairies.
      Instead, mysterious underwater rings spotted off the coast of Denmark are the result of poison, biologists say.

      Striking rings of green eelgrass — some of them up to 49 feet (15 meters) wide — can occasionally be spotted in the clear Baltic water off the coast of Denmark's island of Møn.
      The formations were captured in tourist photos in 2008 and again in 2011, sparking the type of speculation that's usually reserved for crop circles.

       This is an eelgrass plant growing off the cliffs of Island Mon in Denmark.
      The plants create a circle formation. Credit: Ole Pedersen

      But biologists Marianne Holmer from University of Southern Denmark and Jens Borum from University of Copenhagen assure that the circles have "nothing to do with either bomb craters or landing marks for aliens."
      "Nor with fairies, who in the old days got the blame for similar phenomena on land, the fairy rings in lawns being a well known example," Holmer and Borum said in a statement today (Jan. 30).

       On Sunday, June 19, 2011, this quincunx of five circles
      was videotaped underwater where Nils Natorp, Manager of the Mons Klint
      Research Center on the eastern coast of the Danish island of Mon in the Baltic
      Sea, was taking visitors on a field trip.
      Mr. Natorp contacted two divers to go in the water to see what the circles were made of and the divers confirmed the plants are eelgrass.
      But how the circles were made to persist in the water was still a mystery.
      Aerial video of the June 19, 2011,

      The biologists concluded that the rings formed because of the radiating pattern in which the eelgrass grows — and dies when exposed to toxins.
      In the mud around the eelgrass, the scientists detected high levels of sulfide, a substance that's poisonous to eelgrass and can build up naturally in a chalky seabed like the one off Møn (or unnaturally when agricultural pollutants enter an ecosystem).
      "Most mud gets washed away from the barren, chalky seabed, but like trees trap soil on an exposed hillside, eelgrass plants trap the mud," Holmer and Borum explained.
      "And therefore there will be a high concentration of sulfide-rich mud among the eelgrass plants."
      Though it might resemble a type of seaweed, eelgrass is actually a flowering plant.
      And when it grows, it expands outward in all directions, creating circle-shaped colonies.
      While healthy adult eelgrass plants seem to be able to withstand the sulfide in their environment, the old plants at the heart of the colonies drop dead, the researchers said.

      "The result is an exceptional circular shape, where only the rim of the circle survives — like fairy rings in a lawn," Holmer and Borum added.
      Fairy rings in a lawn are typically blamed on the outward growth of fungi, but other fairy circles on land have long puzzled scientists.
      A famous example can be found in the desert grasslands of Namibia in southern Africa, where researchers have offered up a wide range of explanations for the vast field of circular patches, from ants and termites to gas seeps and resource competition.

      The explanation for the eelgrass fair rings is detailed in this month's edition of the journal Marine Biology.

      Monday, February 10, 2014

      Bahamas WLP update in the Marine GeoGarage

      14 charts have been updated since the last release :

      • B12   Abaco Chart
      • B28   Ab- Sandy Pt.
      • B35   Ab-Foxown
      • B155   Ab- Gorda Cay
      • B156   Ab- Mores Island
      • B161   Abaco, Western Bight
      • B165   Ab- Allens-Pen Area
      • B171   Ab- West End Rocks
      • B185   Abacoight - Redshanks Cay
      • B186   Abacoight - Burrows & Water Cay
      • B187   Ab- Normans Castle
      • B188   Ab- Basin Harbour Cay
      • B189   Ab- Point of Bank Anchorage
      • B222   Ab- Schooner Bay
      Today, 295 charts for Bahamas (from WLP) are published on the Marine GeoGarage

      Unprecedented trade wind strength is shifting global warming to the oceans, but for how much longer?

      Méditerranean sea-surface temperature
      Sea-surface temperature in the Mediterranean Sea from January 2011 to May 2012
      as measured by multiple Earth-observation missions.

      From The Guardian

      New research attributes the surface warming slowdown to accelerating trade winds mixing more heat into the oceans
        

        Research looking at the effects of Pacific Ocean cycles has been gradually piecing together the puzzle explaining why the rise of global surface temperatures has slowed over the past 10 to 15 years.
      A new study just published in Nature Climate Change, led by Matthew England at the University of New South Wales, adds yet another piece to the puzzle by examining the influence of Pacific trade winds.

      Pacific trade winds

      While the rate of surface temperature warming has slowed in recent years, several studies have shown that the warming of the planet as a whole has not.
      This suggests that the slowed surface warming is not due as much to external factors like decreased solar activity or more pollutants in the atmosphere blocking sunlight, but more due to internal factors shifting the heat into the oceans.
      In particular, the rate at which the deep oceans have warmed over the past 10 to 15 years is unprecedented in the past half century.

      Research led by Masahiro Watanabe of the Japanese Atmosphere and Ocean Research Institute suggests this is mainly due to more efficient transfer of heat to the deep oceans.
      Consistent with model simulations led by Gerald Meehl, Watanabe finds that we sometimes expect "hiatus decades" to occur, when surface air temperatures don't warm because more heat is transferred to the deep ocean layers.
      A paper published last year by Yu Kosaka and Shang-Ping Xie from the Scripps Institution of Oceanography found that accounting for the changes in Pacific Ocean surface temperatures allowed their model to reproduce the slowed global surface warming over the past 10 to 15 years.
      However, the mechanism causing these Pacific Ocean changes has remained elusive.

      The new study published by Matthew England's team helps explain how and why more heat is being funneled into the deeper ocean layers.
      The study indicates that a dramatic acceleration in equatorial trade winds, associated with a negative phase of a cycle called the Interdecadal Pacific Oscillation (IPO) has invigorated the circulation of the Pacific Ocean.
      This has caused more heat from the surface to be mixed down into deeper ocean layers, while bringing cooler waters to the surface.
      The combination of these two processes cools global surface temperatures.
      Like the rate at which heat is accumulating in the deep oceans, the recent strengthening of the trade winds is unprecedented, as the bottom frame in the figure below shows.

      Top frame: Global surface temperature anomalies.  Bottom frame: Pacific wind stress anomalies.  From England et al. (2014).
      Top frame: Global surface temperature anomalies.
      Bottom frame: Pacific wind stress anomalies. From England et al. (2014).

      Not only is this acceleration of trade winds unprecedented, but it also far exceeds anything captured by climate models.
      Hence they have difficulty reproducing the recent slowdown in surface warming.
      The catch is that oscillations eventually change phases, so as England notes, the strengthened trade winds and faster rate of ocean heat accumulation are only temporary.
      "the heat uptake is by no means permanent: when the trade wind strength returns to normal - as it inevitably will - our research suggests heat will quickly accumulate in the atmosphere. So global temperatures look set to rise rapidly out of the hiatus, returning to the levels projected within as little as a decade."
      The study estimates that by shifting more heat into the oceans, the strengthening trade winds can account for 0.1–0.2°C cooling of surface temperatures over the past 10 to 15 years. This would account for most of the slowed rate of warming, especially when combined with a recent study showing that the global surface warming slowdown is not as large as previously thought. The lead author of that paper, Kevin Cowtan said of this study,
      "I think Professor England has uncovered the biggest piece in the puzzle of recent temperature trends"
      In the figure below, the England study compares observed surface temperature changes (black and grey) with IPCC model projections (red), and projections made by models that incorporate these changes in trade winds (green and blue). The models including trade winds can reproduce the surface warming slowdown. However, once the IPO cycle shifts and winds return to previous levels, the models see an accelerated warming at the surface, and temperatures start to catch back up to the IPCC model projections.

      Annual (grey bars) and a five-year running mean (black solid line) global surface temperature measurements. Climate model projections are shown in red. The blue and green show results from an ocean and a coupled climate model adjusted by the trade-wind-induced surface cooling.  From England et al. (2014).
      Annual (grey bars) and a five-year running mean (black solid line) global surface temperature measurements. Climate model projections are shown in red.
      The blue and green show results from an ocean and a coupled climate model adjusted by the trade-wind-induced surface cooling.
      From England et al. (2014).

      A consistent picture is emerging in the climate research; increases in the strength of trade winds force more heat to be mixed down into the ocean, leading to a temporary slowing of rising surface temperatures.
      The next piece of the puzzle will involve explaining the cause of the dramatic, unprecedented trade wind acceleration.
      The IPO cycle can explain about half of the wind changes, but climate scientists are still investigating other possible contributing factors.
      In any case, England concludes that surface temperatures may rapidly warm when the IPO phase shifts again in the next decade or so, and it will eventually be as though the surface warming slowdown never occurred.
      "We should be very clear: the current hiatus offers no comfort - we are just seeing another pause in [surface] warming before the next inevitable rise in global temperatures."
      Links :
      • The Guardian : Global warming 'pause' due to unusual trade winds in Pacific ocean, study finds
      • ESA : Is global warming hiding underwater ?

      Sunday, February 9, 2014

      Earth's magnetic field : lesson from ESA


      An introduction to Earth's magnetic field: what it is, where it comes from and what it's used for.


      Why it matters
      Earth's magnetic field is continuously changing.
      Magnetic north wanders, and every few hundred thousand years the polarity gradually flips, so that a compass would point south instead of north.


      To learn more about Earth's magnetic field, the three Swarm satellites were launched on 22 November.
      Like 3D compasses, they are measuring the strength and direction of the magnetic field.