Saturday, December 20, 2014
Friday, December 19, 2014
Brazil DHN update in the Marine GeoGarage
As our public viewer is not yet available
(currently under construction, upgrading to a new webmapping technology as Google Maps v2 is officially no more supported),
this info is primarily intended to our universal mobile application users
(Marine Brazil iPhone-iPad on the Apple Store / Weather 4D Android -App-in- on the PlayStore)
and also to our B2B customers which use our nautical charts layers
in their own webmapping applications through our GeoGarage API.
 DHN coverage
(currently under construction, upgrading to a new webmapping technology as Google Maps v2 is officially no more supported),
this info is primarily intended to our universal mobile application users
(Marine Brazil iPhone-iPad on the Apple Store / Weather 4D Android -App-in- on the PlayStore)
and also to our B2B customers which use our nautical charts layers
in their own webmapping applications through our GeoGarage API.
17 charts has been updated and 2 charts have been added since the last update
DHN update November 1, 2014
- 1405 PORTO DE AÇU NEW
- 1406 PROXIMIDADES DO PORTO DE AÇU NEW
- 701 PORTO DE MUCURIPE (Fortaleza)
- 901 PORTO DE MACEIÓ
- 906 PORTO DE SUAPE
- 920 PROXIMIDADES DO PORTO DE MACEIÓ
- 930 PROXIMIDADES DO PORTO DO RECIFE
- 1511 BARRA DO RIO DE JANEIRO
- 1512 PORTO DO RIO DE JANEIRO
- 1622 BAÍA DE SEPETIBA
- 1631 BAÍA DA ILHA GRANDE - PARTE CENTRAL
- 1636 PORTO DE ANGRA DOS REIS E PROXIMIDADES
- 1804 PORTO DE SÃO FRANCISCO DO SUL
- 1902 PROXIMIDADES DA ILHA DE SANTA CATARINA
- 23100 (INT.2124) DO RIO DE JANEIRO À SANTOS
- 201 BARRA NORTE DO RIO AMAZONAS
- 204 DAS ILHAS PEDREIRA À ILHA DE SANTANA
- 242 DA ILHA DOS PORCOS À BAÍA DO VIEIRA GRANDE
- 243 DA ILHA ITAQUARA À ILHA DOS PORCOS
Today 444 charts (510 including sub-charts) from DHN are displayed in the Marine GeoGarage
Don't forget to visit the NtM Notices to Mariners (Avisos aos Navegantes)
Navy develops ‘GhostSwimmer’ drone that looks like a shark
The US Navy is testing a fish like robot designed to carry out stealthy, silent and secure underwater surveillance missions - from intelligence gathering to hull inspections, where its silent operation and mission endurance would provide great advantages to sailors and marines.
(other video)
(other video)
From Wired by Jordan Golson
The American military does a lot of work in the field of biomimicry, stealing designs from nature for use in new technology.
After all, if you’re going to design a robot, where better to draw inspiration than from billions of years of evolution?
The latest result of these efforts is the GhostSwimmer: The Navy’s underwater drone designed to look and swim like a real fish, and a liability to spook the bejeezus out of any beach goer who’s familiar with Jaws.

The functions of the Ghost Swimmer, a biomimetic device modeled after the bluefin tuna, is demonstrated at the Joint Expeditionary Base Little Creek
(Edwar Guttierrez/US Navy)
The new gizmo, at five feet long and nearly 100 pounds, is about the size of an albacore tuna but looks more like a shark, at least from a distance.
It’s part of an experiment to explore the possibilities of using biomimetic, unmanned, underwater vehicles, and the Navy announced it wrapped up testing of the design last week.
The robot uses its tail for propulsion and control, like a real fish.
It can operate in water as shallow as 10 inches or dive down to 300 feet.
It can be controlled remotely via a 500-foot tether, or swim independently, periodically returning to the surface to communicate.
Complete with dorsal and pectoral fins, the robofish is stealthy too: It looks like a fish and moves like a fish, and, like other underwater vehicles, is difficult to spot even if you know to look for it.
Down the line, it could be used for intelligence, surveillance, and reconnaissance missions, when it’s not assigned to more mundane tasks like inspecting the hulls of friendly ships.
Animal lovers will be glad to hear that the GhostSwimmer could take the jobs of the bottlenose dolphins and California sea lions the Navy currently trains to spot underwater mines and recover equipment.
The GhostSwimmer joins the ranks of animal-based awesome/creepy robots like the “Cheetah” that can run at nearly 30 mph, the Stickybot that climbs like a gecko, and the cockroach-inspired iSprawl that can cover 7.5 feet per second.
And it may get a baby brother: The Department of Homeland Security has been funding development of a similar, smaller robot called the BIOSwimmer.
This robotic tuna is the final product of a team of students from the Olin College of Engineering.
True to military form, there’s a whole suite of acronyms to go along with the new toy: The UUV (unmanned underwater vehicle) has been in testing at the JEBLC-FS (Joint Expeditionary Base Little Creek-Fort Story), and was developed by the CRIC (Chief of Naval Operations Rapid Innovation Cell) project, called Silent NEMO (actually, this one doesn’t seem to stand for anything).
It was developed by the Advanced Systems Group at Boston Engineering, a Navy contractor that specializes in the development of robotics, unmanned systems and something called “special tactical equipment”.
The company and Navy haven’t said much about when GhostSwimmer might be deployed or how much it would cost, but next time you’re at the beach and see a fin sticking out of the water, it might be a killer shark—or it might just be a Navy robot.
Links :
- DefenseUpdate : Robotic spy fish conducts underwater surveillance
- GeoGarage blog : Protecting harbors and ships with a robotic tuna fish
Grounding of the Arafenua on the Tikei atoll

Arafenua customs patrol boat on the reef
During a surveillance mission, the Arafenua customs patrol boat set sail from the island of Fatu Hiva (Marquesas archipelago) to Tikei atoll (Tuamotu archipelago) on 30 May 2014 at 22:00 and grounded there on 1 June at about 04:00 (14°56’,504 S et 144°32’,436 W on the North coast of Tikei)

Tikei with SHOM nautical chart correctly shifted on the the GeoGarage platform
Tikei is a small coral island 2 miles long, wooded, without lagoon, uninhabited and unmarked, from northern Tuamotu in French Polynesia.
It is 345 miles from the port of Papeete in Tahiti.
It is difficult to land there because the island is surrounded on all sides by a reef which consists of a first barrier at the surface of water then a platier covered with 20 cm of water.
The tidal range is very low, about 30 cm.
The 1000 metre probe line is located approximately 0.6 miles from the reef.
Before leaving Fatu Hiva on Friday 30 May, the captain overboard gathered part of the crew to explain the mission.
At the end, it traces the road on the MaxSea PC installed in 2012 which is connected to a GPS and a Furuno radar.
Starting outside Fatu Hiva's Bay of Virgins, the road tangents the 1,000 metre sounding line in northwest Tikei.
The vessel sailed on a dark night to an uninhabited islet without any light source, making optical detection impossible.
Furthermore, overcast weather with squalls increases the watchman's difficulties and reduces the quality of the radar watch.
Other weather conditions (wind and swell) have no influence on the circumstances of the occurrence.
During the day, the optical watch would have made it possible to warn the shift manager that he was on his way to the platier.
The arrival at night can therefore be considered as a determining factor.
The weather conditions on June 4 were as forecast, 1.50 to 2 m swell.
The arrival of a swell train that generated a series of waves breaking whose height was above average is the determining factor.
The patroller has an electronic mapping equipment that works with MaxSea software.
This equipment is a ECS and not an ECDIS.
This ECS is not recognised by the IMO as a replacement for the paper charts.
The electronic chart used comes from a private publisher, it is not an ENC published by an official hydrographic service.
Consequently, electronic charting equipment can only be an aid to navigation; it cannot be the primary navigation or reference system.

Copy of map 7347 used "from the Tuamotu Archipelago to the Southern Islands".
There is no landing map of the island.
The most accurate paper chart is the "6689 - Tuamotu Islands (western part)", the one used for the approach.
It is, seen the scale (1/595 000), unusable for navigation in the direct vicinity of Tikei.
It was based on bathymetric information collected by SHOM until 1977.
It was last updated in 2010.
The geodetic reference does not appear on this map.
According the scale (1:595 000), the thickness of the pencil line (0.3 mm) is 178.5 m.
A cartridge indicates that the chart should not be used without consulting other documents, in particular Volume 1 of the Navigator's Guide for information on charts, their accuracy and limitations.
With regard to other navigation aids (radars, GPS, depth sounder), no malfunction was reported.
The lack of a landing card is an underlying factor.
The course was plotted by the captain at sea on MaxSea to arrive in the northwest of Tikéi near the 1000 m sounding line.
It is in fact an approximate isobath (broken line).
The master on board requested to plot this route on the two paper charts (7347 and 6689).
The road passes 1 mm from the islet of Tikéi on map 6689 (less than 600 m) and the landing point is not formalized although it is the first time that Arafenua approaches Tikéi.
It appears that the rules of caution set out in the navigator's guide volume 1 and its supplementary booklet entitled "L'hydrographie, les documents nautiques, leurs imperfections et leur bon usage" were not respected.
In particular the main advice for the layout of a road so as to ward off dangers which is the "thumb rule".
As specified in the above documents, the thumb refers to both an old length (2.7cm) and the width of the browser thumb.
The guard distance from the coast of Tikéi to the scale of the larger paper chart (6689) is nearly 9 miles (36 minutes at 14 knots).
Within this distance Tikéi should only be approached with great care.
The "thumb rule" also applies to electronic maps provided that the map is used at compilation scale, i.e. the scale of the paper map used to develop the electronic map.
The ease of use of the mapping software and the illusion of precision given by the electronic map that can be zoomed at will associated with GPS have made us forget the basic rules of caution.
In particular the constructive doubt with which aids to navigation should be exploited.
The habit of sailing together, for many years and in areas known for transits of a few hours, has blunted the knowledge acquired during initial training.
The master at sea's brief elaboration of the route and the absence of remarks on the route by the various watchkeepers were a determining factor in the grounding.
During the 0100 to 0400 watch, watch leader B could not accurately determine the island's position on the radar due to rain.
Having failed to adjust the anticlutter, he focuses on tracking the course on MaxSea without using the overlay function of the second radar.
He does not master the use of this equipment installed in 2012.
The island does not appear on the MaxSea map because the zoom is set to maximum.
Watch leader B loses track of the distance between him and Tikéi until he prepares his relief. Although the optical and radar watches were severely degraded, he did not take any action while approaching Tikéi at night.
It was only about 5 minutes before the grounding that he asked to intuitively reduce the engines by 100 revolutions.
The conduct of the landing watch is inadequate.
This is a determining factor.

The grounding
The ARAFENUA grounded because the actual position of the island is 1500 m further north than that indicated on the MaxSea mapping.

DF 48 Arafenua was deemed irrecoverable after grounding on 1 June in French Polynesia.
This shift in the island's position is a contributing factor.

Extract from the Arafenua MaxSea mapping with overprinting of the satellite image where the edge of the 'platier' appears on the 2000 m probe line

Import in Google Earth of the route drawn on MaxSea

Screenshot of 'Arapo' ECDIS, with Arafenua position and radar overlay
According to SHOM information, the Tikéi atoll was the subject of geodesy work in 1948 (astronomical geodesy) and 2001 (GPS).
These geodetic measurements are consistent with the uncertainties of the astronomical measurements: the difference is 150 m (approximate value, the precise location of the astronomical geodesy station has not been found).
The paper chart 6689 (scale 1/595000), published in 1978, was based on chart 6057 (1/510000), which it replaced.
The paper chart 6689 (scale 1/595000), published in 1978, was based on chart 6057 (1/510000), which it replaced.
Map 6057, published in 1952, uses one minute of topography also produced by the 1948 geodetic mission.


original geoTIFF 6689 chart overlaid on Google Earth
- showing original 1500 meters shift with satellite imagery because datum none WGS84-
Analysis of the documents shows that this minute is not consistent with the geodetic measurements, which was not identified during the preparation of the mission documents and during the cartographic work: the position of the island on the topographic minute is 1 mile further south, probably due to a transcription error during the preparation of this document.
This shift affected the chart 6057 then the current chart 6689, as well as the electronic navigation chart ENC FR266890 which were elaborated from this same paper chart.
This shift affected the chart 6057 then the current chart 6689, as well as the electronic navigation chart ENC FR266890 which were elaborated from this same paper chart.

6689 Iles Tuamotu (partie Ouest), de Tahiti à Rangiroa et Makemo
scale : 1:593,700 / pub 1978 / ed 2009/ datum : unknown -non WGS84-


ENC FR266890 (ed : 30/11/2010) scale 1:350,000
Polynésie Française - Iles Tuamotu (Western part)
The force of habit and the absence of constructive doubt in the use of navigational aids combined with a lack of vigilance in the development and monitoring of navigation led to the grounding.
Note : SHOM issued offset information for paper map 6689 "Tuamotu Islands (western part)" (Preliminary Notice 14 37-P-07), and associated ENC FR266890.

Other notes from BEA mer :
- To the software publisher MaxSea :
3 2014-R-028 : to display on the vector map a blatant warning when the user uses the zoom beyond the compilation scale.
- At SHOM :
4 2014-R-029: to propose to IHO an amendment to the standard to show on ENC maps a clear warning when the user uses the zoom beyond the compilation scale.

Links :
Thursday, December 18, 2014
World Magnetic Model updated

Compasses have been used for several thousand years to determine direction.
They point in the direction of magnetic force at the user’s location, and the direction it points is, more often than not, in a different direction than geographic north (toward the North Pole), a more precise direction is achieved by knowing the angle between them (magnetic declination).
However, declination changes with location and time, and a geomagnetic model is often used to correct for it.
Since the changes in geomagnetic fields are difficult to predict, timely model updates (every 5 years for the WMM) are required for navigational accuracy.
The WMM satisfies all these criteria and is therefore widely used in navigation.
Examples include, but are not limited to, ships, aircraft and submarines.
Magnetometer based attitude (roll and pitch) control is commonly used in aircraft and satellites.
NOAA and British Geological Survey update World Magnetic Model :
Critical changes made to ensure accurate navigation
NOAA officials announced today the World Magnetic Model (WMM), a representation of Earth’s large-scale magnetic field and an indispensable complement to GPS devices used by NATO, the United States and United Kingdom militaries, as well as civil applications ranging from mineral exploration to smartphone apps, has been updated.

Annual rate of change of declination for 2015.0 to 2020.0 from the World Magnetic Model (WMM2015).
Red –easterly change, blue – westerly change, black – zero change.
Contour interval is 1’/year (sixtieth of a degree) up to ± 20’/year,
thereafter 5’/year, and projection is Mercator
Changes in the Earth's outer core trigger unpredictable changes in its magnetic field, an invisible force that extends from Earth's interior to where it meets a stream of charged particles emanating from the Sun.
For example, over the past few decades the North magnetic pole has been drifting toward Siberia at an irregular speed.
This migration can adversely affect the accuracy of navigation if not compensated for by an updated WMM.
Declination (magnetic variation) from the WMM2015
The WMM2015 is a large-scale representation of Earth’s magnetic field.
The blue and red lines indicate the positive and negative difference between where a compass points the compass direction and geographic North.
Green lines indicate zero degrees of declination.
(Credit: NOAA)
The WMM2015 is a large-scale representation of Earth’s magnetic field.
The blue and red lines indicate the positive and negative difference between where a compass points the compass direction and geographic North.
Green lines indicate zero degrees of declination.
(Credit: NOAA)
“We know the Earth’s magnetic field is constantly changing,” said Stephen Volz, Ph.D., assistant NOAA administrator for NOAA’s Satellite and Information Service.
“But thanks to the environmental intelligence gathered from a wide array of platforms, including satellite observations, we can make vital updates to the World Magnetic Model and ensure the most accurate navigation for commercial applications.”
Estimated WMM2015 declination inaccuracy
without considering crustal and disturbance field contributions.
 Global distribution of the declination error provided by the WMM2015 error model
Updated every five years, the WMM, created using satellite observations of the Earth’s magnetic field, provides accurate magnetic field declination, the difference between true north and magnetic north critical for navigational safety.
Scientists continuously survey the magnetic field and can precisely map the present field and its rate of change and then extrapolate changes into the future.
WMM-corrected magnetic compass readings are not subject to ionospheric disturbances and work everywhere, including under the sea and in deep canyons.

Declination in region of North Pole at 2010. from WMM2010
Red -positive (East), blue -negative (West), black -zeroContour interval is 5° and projection is Polar Stereographic
credit : BGS NERC
"Although GPS is a great tool for navigation, it is limited in that it only provides your position. Your orientation, the direction you are facing, comes from the magnetic field," said James Friederich, a geodetic scientist at the U. S. National Geospatial-Intelligence Agency.
"Our war fighters use magnetics to orient their maps. Your smartphone camera and various apps can use the magnetic field to help determine the direction you are facing. All of these examples need the WMM to provide your proper orientation."
The WMM is the standard navigation model for the U.S. Department of Defense, North Atlantic Treaty Organization, International Hydrographic Organization and consumer electronics.
For the last 10 years, NOAA’s National Geophysical Data Center (NGDC) in Boulder, Colorado, working with the British Geological Survey in Edinburgh, Scotland, has co-developed the WMM on behalf of the U.S. National Geospatial-Intelligence Agency and the United Kingdom’s Defence Geographic Centre.
NOAA’s partner, the Cooperative Institute for Research in Environmental Studies (CIRES), contributed key science to this project.
Links :
- WBGS WMM2015 calculator / NOAA magnetic declination estimated value calculator
- NOAA WMM
- NOAA CrowdMag (allows users to collect their own magnetic field data using the magnetometers in their smartphone): Androïd / iOS
Wednesday, December 17, 2014
Questions about electronic charts in a twenty-first century ship grounding

On Saturday, November 29, Team Vestas Wind’s boat grounded on the Cargados Carajos Shoals, Mauritius, in the Indian Ocean.
Fortunately, no one has been injured.
photo : NCG Operations Room – MRCC Mauritius
We showed in our previous GeoGarage blog article that the grounding of the Vestas had no relationship with some positional discrepancy in the nautical charts, contrary to a similar grounding such as the USS Guardian in the Tubbataha reefs (Philippines) which occurred last year (see GeoGarage blog)
Charging through the Indian Ocean at high speed and in total darkness, nothingness ahead, nothingness around. Speed is good, sailing is supreme. And then …BANG
A spokesman for the Volvo Ocean race said that it would be reasonable to assume a large reef formation would be easily detected early on and avoided by changing course as 4 other boats did before Vestas grounding but during the day time not in the darkness.
At a press conference on Monday, Team Vestas admitted that the crash appears to have been caused by “a simple human error”: the navigator, Wouter Verbraak, did not zoom in enough on his charts, worried by a a high-stress situation caused by approaching bad weather.

Note that an independent report into the grounding of Team Vestas Wind's boat has been set up by the Volvo Ocean race.
David Burch in his own blog writes some interesting articles 'How a big, well-run, high-tech race boat, can go aground... almost' & 'Don't blame eCharts for anything' completing our first article.
Following to his different comments, we must add that private vector charts displayed in ECS software or in some plotters or tablets call for comments regarding cartographic generalization issues.
Positions of the tropical cyclone 02S,
located East-Northeast of Mauritius island
(Joint Typhoon Warning Center)
 Meteosat 7 IR picture (courtesy of MTOTEC) 29-11-2014 09:00Z
(Joint Typhoon Warning Center)
Low pressure forecast from South African weather service / other satellite pictures 1 & 2
“Prior to the crash in the preceding 48 hours, Wouter
and I in regard to our normal duties of looking where the boat was
going with the routing, noticed that there would be some seamounts. When
I saw those I asked what the depths and the currents and the wave
conditions would be." said Skipper Chris Nicholson.
“Wouter’s reply was that the depths went from 3000m to 40m, (which) were the extremes of the depths, the current was negligible and we would monitor the wave state as we approached...”
“Wouter’s reply was that the depths went from 3000m to 40m, (which) were the extremes of the depths, the current was negligible and we would monitor the wave state as we approached...”
Wouter explained the reason for the accident to the media:
“In hindsight we would’ve continued to zoom in on the area much more, on the electronic charts. Not doing so is the big mistake that I made, but the good thing is that we didn’t make any more.”
“In hindsight we would’ve continued to zoom in on the area much more, on the electronic charts. Not doing so is the big mistake that I made, but the good thing is that we didn’t make any more.”
(see his own statement / SailingAnarchy / Zeilen / NewYorker / SailingScuttlebut)
Racing navigation isn't ordinary navigation.
Before they left Cape Town in 40 knots of wind, the teams had already been warned of a possible cyclone. They then skirted an iceberg exclusion zone in the Southern Ocean, dodged a tropical depression and had to keep clear of a new Indian Ocean exclusion zone (released one day before the start of the leg) in case of pirates, which lead to set the Cargados shoas in the direction of the Abu Dhabi final destination.
Note that an independent report into the grounding of Team Vestas Wind's boat has been set up by the Volvo Ocean race.
David Burch in his own blog writes some interesting articles 'How a big, well-run, high-tech race boat, can go aground... almost' & 'Don't blame eCharts for anything' completing our first article.

zooming animation on the Marine GeoGarage with NGA raster charts layer :
showing a continuous vision of the Cargados Carajos shoals,
with 'exaggerated' shallow (land) parts on zoomed out views
Other example : same continuous vision of raster charts zooming from general to detail
with British Admiralty charts :
see zooming animation on the Marine GeoGarage with UKHO raster charts layer
In our case, 3 ENC charts coming from 3 different Hydrographic Offices (UKHO, SHOM and NHO) are today available in the worldwide ENC catalog of charts :showing a continuous vision of the Cargados Carajos shoals,
with 'exaggerated' shallow (land) parts on zoomed out views
Other example : same continuous vision of raster charts zooming from general to detail
with British Admiralty charts :
see zooming animation on the Marine GeoGarage with UKHO raster charts layer
With official vector ENCs, we have also the same continuous vision zooming from low scales to high scales.

respectively overview (GB104702), general (FR274880) and approach (IN42503A) charts
- GB104702 Indian Ocean - Seychelles group to Nazareth Bank and Agalega Islands (overview) scale 1:3,500,000 (updated 31-05-2012)
- FR274880 Ile de la Reunion to Rodrigues island and Ile Tromelin (general) scale 1:1,700,000 (updated 21-03-2014)
- IN42503A Cargados Carajos shoals (approach) scale 1:45,000 (updated 25-03-2014)

GeoGarage ENC webmapping with s63 vector ENCs (GB104702, FR274880, IN42503A)
showing continuity in the display of the Cargados shoals during scaling

showing that the shoals are not correctly displayed on one of the chart levels.
Note : the same behavior occurs on other commercial nautical vector charts : Navionics / Transas

showing at high scale depth soundings (on the South East part of the shoals)
whose source are probably coming from the Indian official IN42503A ENC
Transas
These above behaviors -with commercial electronic charts- underlines the issues in matter of cartographic generalization of vector-based data especially with computer automation.
Extract from NOAA document (1988) :
All charts are reductions of some part of the environment.
The reduction of the environment to a more comprehensible scale concomitantly yields a variety of undesirable consequences.
These include:
Also, entire features might have to be eliminated, enlarged, combined, and or displaced to fit within the graphic constraints of a typical chart.
To this end, the cartographer must apply a series of manipulations to the chart data in order to depict the important information at the reduced chart scale.
Extract from NOAA document (1988) :
All charts are reductions of some part of the environment.
The reduction of the environment to a more comprehensible scale concomitantly yields a variety of undesirable consequences.
These include:
- a decrease in the distances separating features on the chart;
- a loss of visual clarity due to overcrowding; and
- a shift of visual importance from the specific to the general.
Also, entire features might have to be eliminated, enlarged, combined, and or displaced to fit within the graphic constraints of a typical chart.
To this end, the cartographer must apply a series of manipulations to the chart data in order to depict the important information at the reduced chart scale.

showing how the chart accuracy and display of a coastal area
will be varied related to the selected scale range.
Large-scale charts encompass relatively small areas and show a great amount of detail.
Small-scale charts cover a large area, but show less detail.
The establishment of rigid guidelines for generalization has heretofore been a cartographic enigma.
Regardless of the apparent disparity in the definition of the term, cartographic generalization will be defined as the selection and simplified representation of detail appropriate to the scale and/or purpose of the chart.
Well known cartographic expert M. Eckert (1921) considered cartographic generalization as an subjective process dependable only on cartographers skill.
Today with the some advanced computer aid tools, automated algorithms are used to help the cartographer in the generalization processes especially for the coastline and bathymetry (soundings and isobaths).
The ENC data creation is the process to design and plan an ENC database, taking into account digital generalization factors.
Multiple representation of ENC data is controlled by SCAMIN attributes in the s-57 norm.
The SCAMIN (abbreviation of Scale Minimum) value of an object determines the display scale below which the object is no longer visible on an ECDIS, in order to reduce the amount of clutter displayed and to assign priority to the display of the different objects.
e.g SOUNDG objects -depth soundings- with SCAMIN=10,000 are not be displayed when viewed at smaller scales (>10,000)
So when presented in shipboard compatible Electronic Chart Systems (ECS) or Electronic Chart Display and Information Systems (ECDIS), the user can zoom in to the ENC and be presented with an increasing number of features, which only become visible once an assigned scaling minimum is reached, the SCAMIN s-57 attribut.
Note that in the next version of the ENC norm (s-101), an ENC should ideally be displayed between two scales: Minimum Display Scale and Maximum Display Scale. (see IHO)
But some spatial objects in the usual s-57 norm such as natural coastlines (COALNE) may not be included within SCAMIN.
For example, a lower scale coastline is a generalized version of a higher scale coastline achieved by automated line simplification and smoothing techniques.
Following to some Email discussion with Nick White (navigator and Expedition software developer), it must be remembered that the 3 navigation software used in the Volvo Ocean Race (Expedition, Adrena or B&G Deckman for Windows) are ECS dedicated at first to weather routing, each using commercial electronic charts (C-Map MAX in this case, but are not compatible with raster ARCS from UKHO) and not ECDIS systems (with ENC charts) fulfilling the requirement under SOLAS regulation so they can not be used to replace official paper nautical charts which are available onboard (Use of private produced charts is not officially approved for navigation).
As ECS are at first dedicated to routing (weather optimization function for racing and performance), so usually displayed at low scale charts and are not really related to navigation as such : they might be only used as additional navigation aids to complement the usual job with the paper maps.
But it's also true that today, modern race boats have rudimentary room for A0 paper charts : so it's not obvious to always get all the relevant charts accessible on the chart table.

By the way, routing software on the markets offer the possibility to launch routing calculations with land avoidance for a performance point of view, so really used for large land masses as sailing can be done quite close to land/reefs.
Generally, the land avoidance routing algorithm uses high resolution shoreline files in order to check the route does not cross the land, or any shallow areas (via depth/hazard avoidance).

Another interesting point is the fact that the Volvo organization (which receives satellite tracking positions at a couple of minutes of interval) didn't alert the Vestas team once it became quite obvious the boat were heading straight to the shoal (even if Vestas might have been going to sail up to half a mile off the reef and gybe to sail along it -see the other tracks-).

In conclusion, it's quite common nowadays -especially with the newer generation of sailors using electronics as a primary means of navigation-, to see that all these charting systems (plotters, software and mobile applications) lull people into an excessive sense of security, with the risk of encouraging them to rely too much on these tools they have come to trust, but which can't be the only key for safety of life at sea.
Well known cartographic expert M. Eckert (1921) considered cartographic generalization as an subjective process dependable only on cartographers skill.
Today with the some advanced computer aid tools, automated algorithms are used to help the cartographer in the generalization processes especially for the coastline and bathymetry (soundings and isobaths).
The ENC data creation is the process to design and plan an ENC database, taking into account digital generalization factors.
Multiple representation of ENC data is controlled by SCAMIN attributes in the s-57 norm.
The SCAMIN (abbreviation of Scale Minimum) value of an object determines the display scale below which the object is no longer visible on an ECDIS, in order to reduce the amount of clutter displayed and to assign priority to the display of the different objects.
e.g SOUNDG objects -depth soundings- with SCAMIN=10,000 are not be displayed when viewed at smaller scales (>10,000)
So when presented in shipboard compatible Electronic Chart Systems (ECS) or Electronic Chart Display and Information Systems (ECDIS), the user can zoom in to the ENC and be presented with an increasing number of features, which only become visible once an assigned scaling minimum is reached, the SCAMIN s-57 attribut.
Note that in the next version of the ENC norm (s-101), an ENC should ideally be displayed between two scales: Minimum Display Scale and Maximum Display Scale. (see IHO)
But some spatial objects in the usual s-57 norm such as natural coastlines (COALNE) may not be included within SCAMIN.
For example, a lower scale coastline is a generalized version of a higher scale coastline achieved by automated line simplification and smoothing techniques.
Following to some Email discussion with Nick White (navigator and Expedition software developer), it must be remembered that the 3 navigation software used in the Volvo Ocean Race (Expedition, Adrena or B&G Deckman for Windows) are ECS dedicated at first to weather routing, each using commercial electronic charts (C-Map MAX in this case, but are not compatible with raster ARCS from UKHO) and not ECDIS systems (with ENC charts) fulfilling the requirement under SOLAS regulation so they can not be used to replace official paper nautical charts which are available onboard (Use of private produced charts is not officially approved for navigation).
As ECS are at first dedicated to routing (weather optimization function for racing and performance), so usually displayed at low scale charts and are not really related to navigation as such : they might be only used as additional navigation aids to complement the usual job with the paper maps.
But it's also true that today, modern race boats have rudimentary room for A0 paper charts : so it's not obvious to always get all the relevant charts accessible on the chart table.
General coastlines for land determination in the area
GSHHS World Vector Shorelines file (WVS) in black spots (general & detailed) + the one from Google in yellow
GSHHS World Vector Shorelines file (WVS) in black spots (general & detailed) + the one from Google in yellow
By the way, routing software on the markets offer the possibility to launch routing calculations with land avoidance for a performance point of view, so really used for large land masses as sailing can be done quite close to land/reefs.
Generally, the land avoidance routing algorithm uses high resolution shoreline files in order to check the route does not cross the land, or any shallow areas (via depth/hazard avoidance).
Vestas in blue / Dongfeng in red closer of the South West part of the reef
see zoom in the South of the Cargados
(courtesy of Volodia)
see zoom in the South of the Cargados
(courtesy of Volodia)

Knut Frostad, CEO Volvo Ocean Race watching C-Map/Jeppesen nautical charts
Crédit : A Sanchez
In conclusion, it's quite common nowadays -especially with the newer generation of sailors using electronics as a primary means of navigation-, to see that all these charting systems (plotters, software and mobile applications) lull people into an excessive sense of security, with the risk of encouraging them to rely too much on these tools they have come to trust, but which can't be the only key for safety of life at sea.
Links :
- NOAA : Behind the accuracy of electronic charts--What every mariner should know about electronic and paper charts / Differences Between RNCs and ENCs
- NGA : Electronic charts
- ESRI : MapGen (1996)
- Cartographic generalization and contributions to its automation
- Specifying requirements for automatic generalization of ENC
- Panbo : Lessons of Vestas Volvo wreck but what about the C-Map grounding alarm similar
- Vimeo : Team Vestas Wind skipper Chris Nicholson and Sailing Anarchy's Alan Block after shipwreck - First video interview
MH370: Bathymetric survey
Geoscience Australia is providing extensive advice, expertise and support to the Australian Transport Safety Bureau (ATSB).
The ATSB is leading a seabed mapping and underwater search for missing Malaysia Airlines flight 370 in the southern Indian Ocean.
Bathymetry is the study and mapping of the sea floor.
It involves obtaining measurements of the depth of the ocean and is equivalent to mapping on land. Before the underwater search for MH370 could begin, it was necessary to accurately map the sea floor to ensure that the search is undertaken safely and effectively.
Bathymetry survey vessels spent months at sea, scanning the sea floor with multibeam sonar to gather detailed, high-resolution data.
The data has revealed many seabed features for the first time.
This computer-animated ‘flythrough’ shows a visualisation of some of the sea floor terrain in the search area.
Geoscience Australia is applying specialist knowledge and capability in the search for missing flight MH370.
This expertise proved critical in understanding the environment in which the search is operating.
This expertise proved critical in understanding the environment in which the search is operating.
The Joint Agency Coordination Centre (JACC)
is the lead agency in the search for missing Malaysia Airlines Flight
MH370, coordinating all Australian Government assistance and is
responsible for whole-of-government information, including keeping the
families of those onboard and the general public, informed of the
progress of the search.
The Australian Transport Safety Bureau (ATSB) is Australia's national transport safety investigator and is leading the search operations for MH370.
Geoscience
Australia provides advice, expertise and support to the ATSB in sea
floor mapping (bathymetric survey) and the underwater search.
The
search for MH370 includes a bathymetric survey, providing a detailed
map of the sea floor topography of the search area; and an underwater
search using scanning equipment or towed submersible vehicles.
The information gained in the bathymetric survey is used to build a map of the sea floor in the search area, aiding navigation during the underwater search.

The information gained in the bathymetric survey is used to build a map of the sea floor in the search area, aiding navigation during the underwater search.

The image on the left shows data at around 3400-metre resolution (data acquired predominantly by satellite altimetry), while the image on the right shows data with a combination of 250-metre and 50-metre resolutions (data acquired by bathymetric surveys from a vessel).
The higher resolution data on the right shows underwater features much more clearly.
This figure is for illustrative purposes only and does not show data from the search area.
The bathymetric survey was conducted from May to October 2014, collecting data over 150,000 square kilometres in the search area and producing high resolution maps of the sea floor to safely conduct the underwater search.
Survey vessels undertaking the bathymetric survey used a multibeam sonar
mounted on the hull to obtain measurements and produce a map charting
the water depth and hardness of the sea floor.
High resolution multibeam data acquisition is time-consuming.
It is a little like mowing grass, where bathymetry is mapped line by line.
High resolution multibeam data acquisition is time-consuming.
It is a little like mowing grass, where bathymetry is mapped line by line.
In general, the world's
deep oceans have had little exploration.
Previous maps of the sea floor in the search area were derived from satellites and only indicated the depth of the ocean at a coarse resolution, not showing the shape of the sea floor in enough detail for safe navigation of underwater vehicles.
These coarse maps provide data at a low resolution of approximately 1500 metres (per pixel), while the recent multibeam bathymetric survey collected data at 50 to 150 metres (per pixel).
This newly acquired data is some of the first high resolution data available for these areas.
Sea floor in MH370 search area
Very
little is known about the sea floor in the MH370 search area, as few
marine surveys have taken place there.
What was known, however, was that the search area encompasses the seabed on and around Broken Ridge, an extensive linear, mountainous sea floor structure that once formed the margin between two geological plates.
These plates evolved and spread apart between 20 and 100 million years ago, under similar processes found today at spreading plate margins (such as the Mid-Atlantic Ridge).
The
sea floor around Broken Ridge still retains many of the large
geological structures typical of spreading plate margins where volcanism
and tectonic movements produce volcanoes (now extinct), high rugged
ridges and deep trenches.
The high resolution bathymetry data
collected in the search for MH370 has revealed many finer-scale seabed
features for the first time that were not visible in the previous low
resolution, satellite-derived bathymetry data.
It has also revealed regions of harder and softer sea floor composition (sediment versus rock).
This information has been useful in identifying and discriminating certain features, but also in providing a guide on the complexity of the sea floor for the underwater search.
The following 3D models present some of the features.
Visualisation of Sea Floor Terrain
Before the underwater search for MH370 could begin, it was necessary to accurately map the sea floor to ensure that the search is undertaken safely and effectively.
Bathymetry survey vessels spent months at sea, scanning the sea floor with multibeam sonar to gather detailed, high-resolution data.
The data has revealed many seabed features for the first time.
This computer-animated `flythrough' (above) shows a visualisation of some of the sea floor terrain in the search area.

Three-dimensional models of the sea floor terrain
Before the underwater search for MH370 could begin, it was necessary to accurately map the sea floor to ensure that the search is undertaken safely and effectively.
Bathymetry survey vessels spent months at sea, scanning the sea floor with multibeam sonar to gather detailed, high-resolution data.
The data has revealed many seabed features for the first time.
This computer-animated `flythrough' (above) shows a visualisation of some of the sea floor terrain in the search area.

3D models of sea floor terrain gallery
Three-dimensional models of the sea floor terrain
These three-dimensional models of the sea floor terrain have been
developed from high resolution (90 metre grid) bathymetric data from the
survey in the southern part of the Indian Ocean.
These models show newly discovered sea floor features including:
Scientific understanding
These models show newly discovered sea floor features including:
- seamounts (remnant submarine volcanoes), up to 1400 metres high and often forming a semi-linear chain
- ridges (semi-parallel) up to 300 meters high, and
- depressions up to 1400 metres deep (compared to the surrounding seafloor depths) and often perpendicular to the smaller semi-parallel ridges.
Scientific understanding
The data acquired as part of the bathymetric survey has been collected for the sole purpose of finding the missing plane and to bring closure to the families of those on-board.
However, as it is some of the first high resolution data available in these areas, it is of great interest to the scientific community and will be released to the public by Geoscience Australia in due course.
For scientists, a greater understanding of deep ocean bathymetry is useful for a range of purposes, including geological interpretation to better understand plate tectonic history; as a baseline product in the creation of hydrodynamic models to gain knowledge on ocean currents and connectivity; the identification of sea floor features; and with the depth of oceans playing a major role in defining the habitat for flora and fauna - to locate areas where unique biological communities may exist.
Links :
- GeoGarage blog : Search for MH370 : hopes fresh drift model will improve debris search in Australia / New map exposes previously unseen details of seafloor / Flight MH370: New search images reveal seabed details / Malaysia Airlines flight MH370: Satellite data to be re-examined as ‘more difficult’ phase begins, search on ocean floor widened / MH370: How do underwater sonar subs work? / Appeal to search missing Malaysian flight / Why locating MH370 in the Southern Ocean is so difficult / Malaysia Airlines Flight MH370: Search reveals extent of ocean garbage / Malaysia missing plane search China ship 'picks up signal'
- ATSB : MH370
- EGU : Using seafloor mapping to find missing Malaysia Airlines flight MH 370 (Guest Post: Dr. John W. Jamieson)
Tuesday, December 16, 2014
Rolls-Royce sets sail for robotic shipping with virtual bridge concept
Rolls-Royce created this concept under FIMECC (Finnish Metals and
Engineering Competence Cluster) user experience and usability program,
UXUS.
This future bridge operation experience concept (oX) for platform
support vessels is envisioned together with VTT Technical Research
Centre of Finland in 2012-2014.
(video for cargo vessels)
(video for cargo vessels)
From GizMag by David Szondy
Rolls-Royce, VTT Technical Research Centre of Finland, and Aalto University are expanding on their ideas for a virtual bridge that could soon lead to a future where the line between manned and robotic ships becomes completely blurred. Combining automated ship systems and constant high-data level communications, it's part of what Rolls-Royce see as the "next major transition for the shipping industry."
Today, there's more shipping than ever.
Ships are becoming more complex, requiring large amounts of data streaming within and without the hull, regulations are growing by the day, fuel costs increase, and environmental pressures become more acute.
At the same time, skilled crews willing to spend weeks at sea are becoming harder to find.
According to Rolls-Royce, this, combined with the requirements of the latest developments in propulsion, navigation, and other on-board systems, will require complex interactive data and control systems that could one day lead to autonomous ships that don't require crews
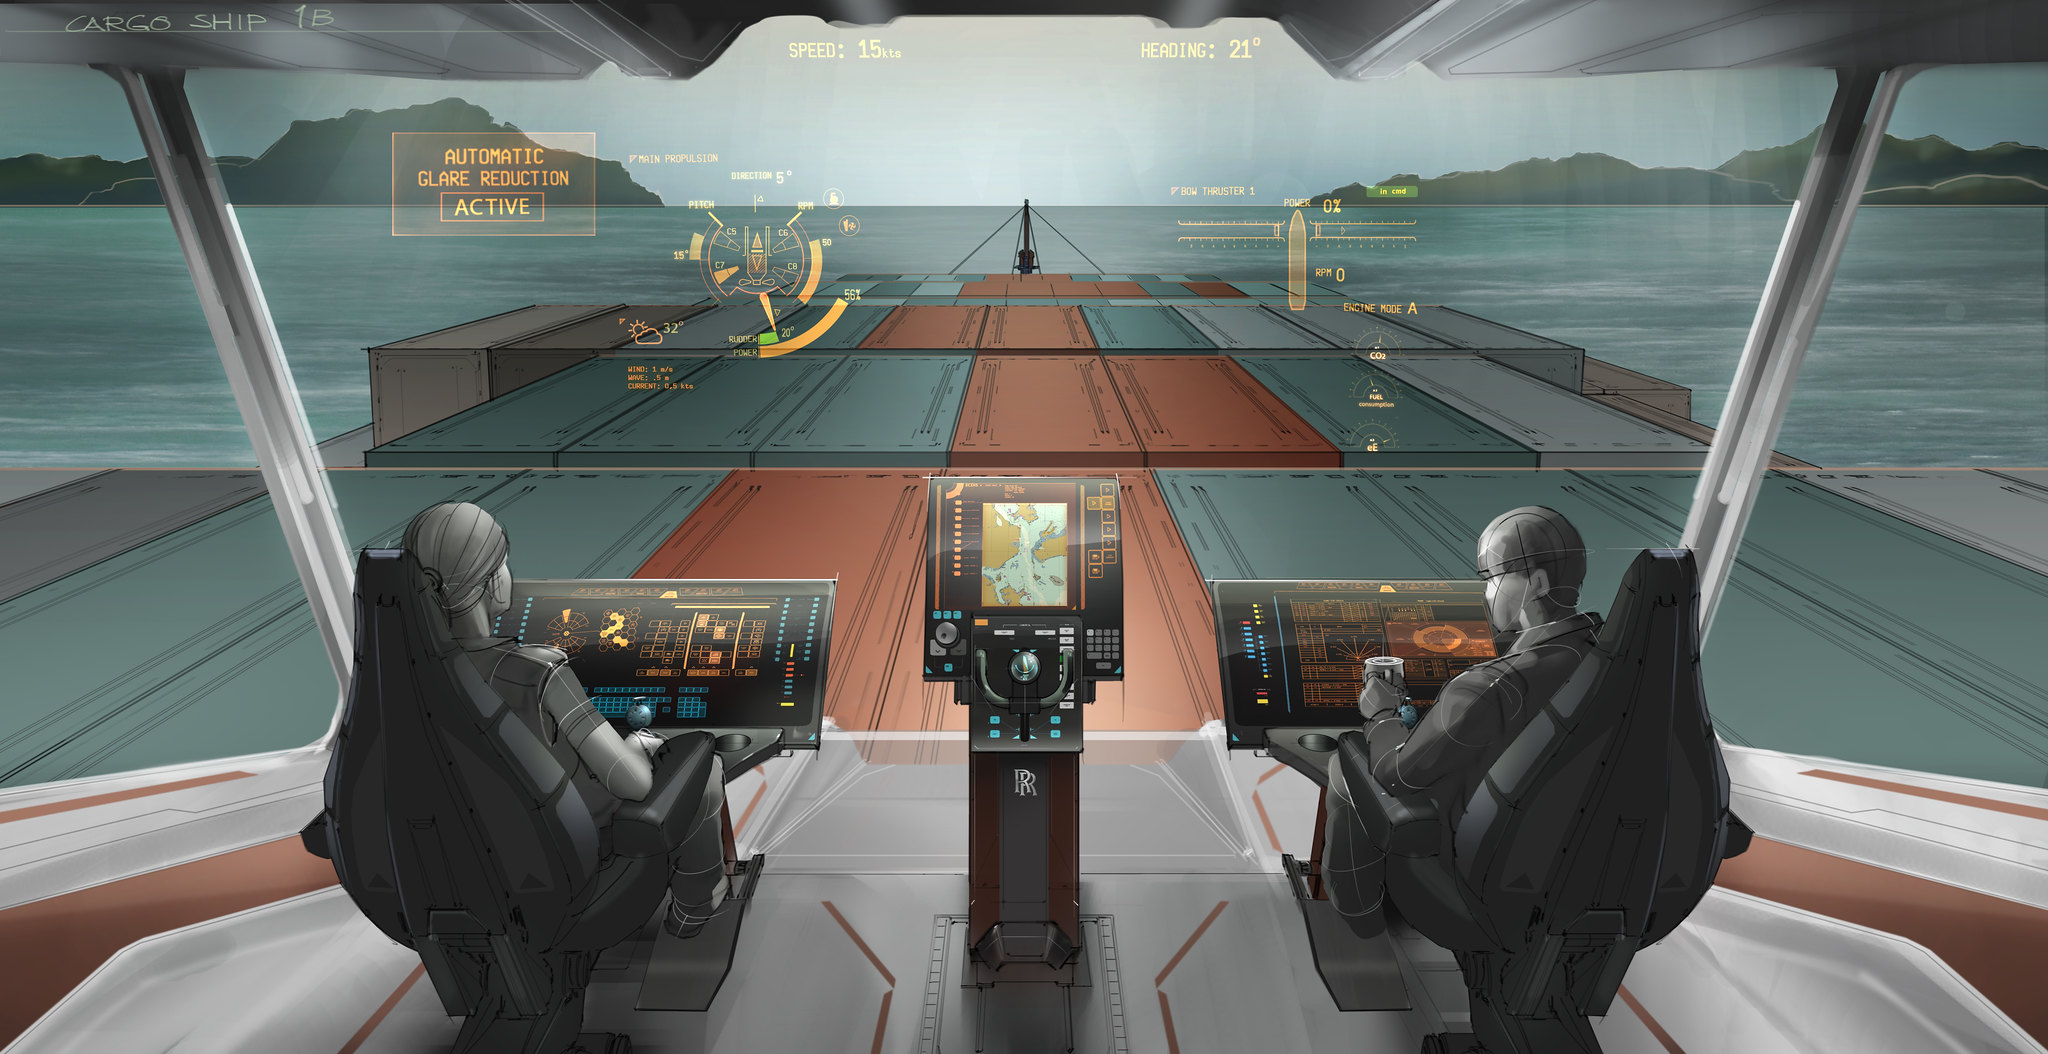
The concept, Ship Intelligence, is based on a new bridge called the Future Operator Experience Concept or "oX."
This turns bridge positions into smart work stations and the bridge itself into an augmented reality control center.
This week, Rolls-Royce unveiled its latest version of the concept, which it says could become a reality in ten years.

The difference between the oX and a bridge of today is more than the science fictiony consoles and futuristic chairs.
This is obvious the moment one of the crew walks on the bridge, where sensors identify them, call up their individual duties and specifications, and reconfigure their stations accordingly to suit the the task at hand and the ergonomics of the user.
The windows of the bridge are actually augmented reality displays that overlay information and enhance visibility of the ship's surroundings by means of an array of cameras and other sensors.
This display can show navigation tracks and hazards, provide warnings and data about other ships in the area, and highlight ice, shoals, and other things that might not otherwise be visible – including the ability to make the ship "invisible" and eliminate blind spots or show up deckhands who might otherwise be hidden behind equipment.
Based on a study of user experiences and preferences, the oX system is designed to be used on a wide array of ships, from giant cargo container ships to platform support vessels.
According to Rolls-Royce, oX is more than a glorified autopilot or data display device.
It's designed to operate in concert with fleets of vessels and other facilities coordinating with shore control centers and exchanging massive amounts of data.
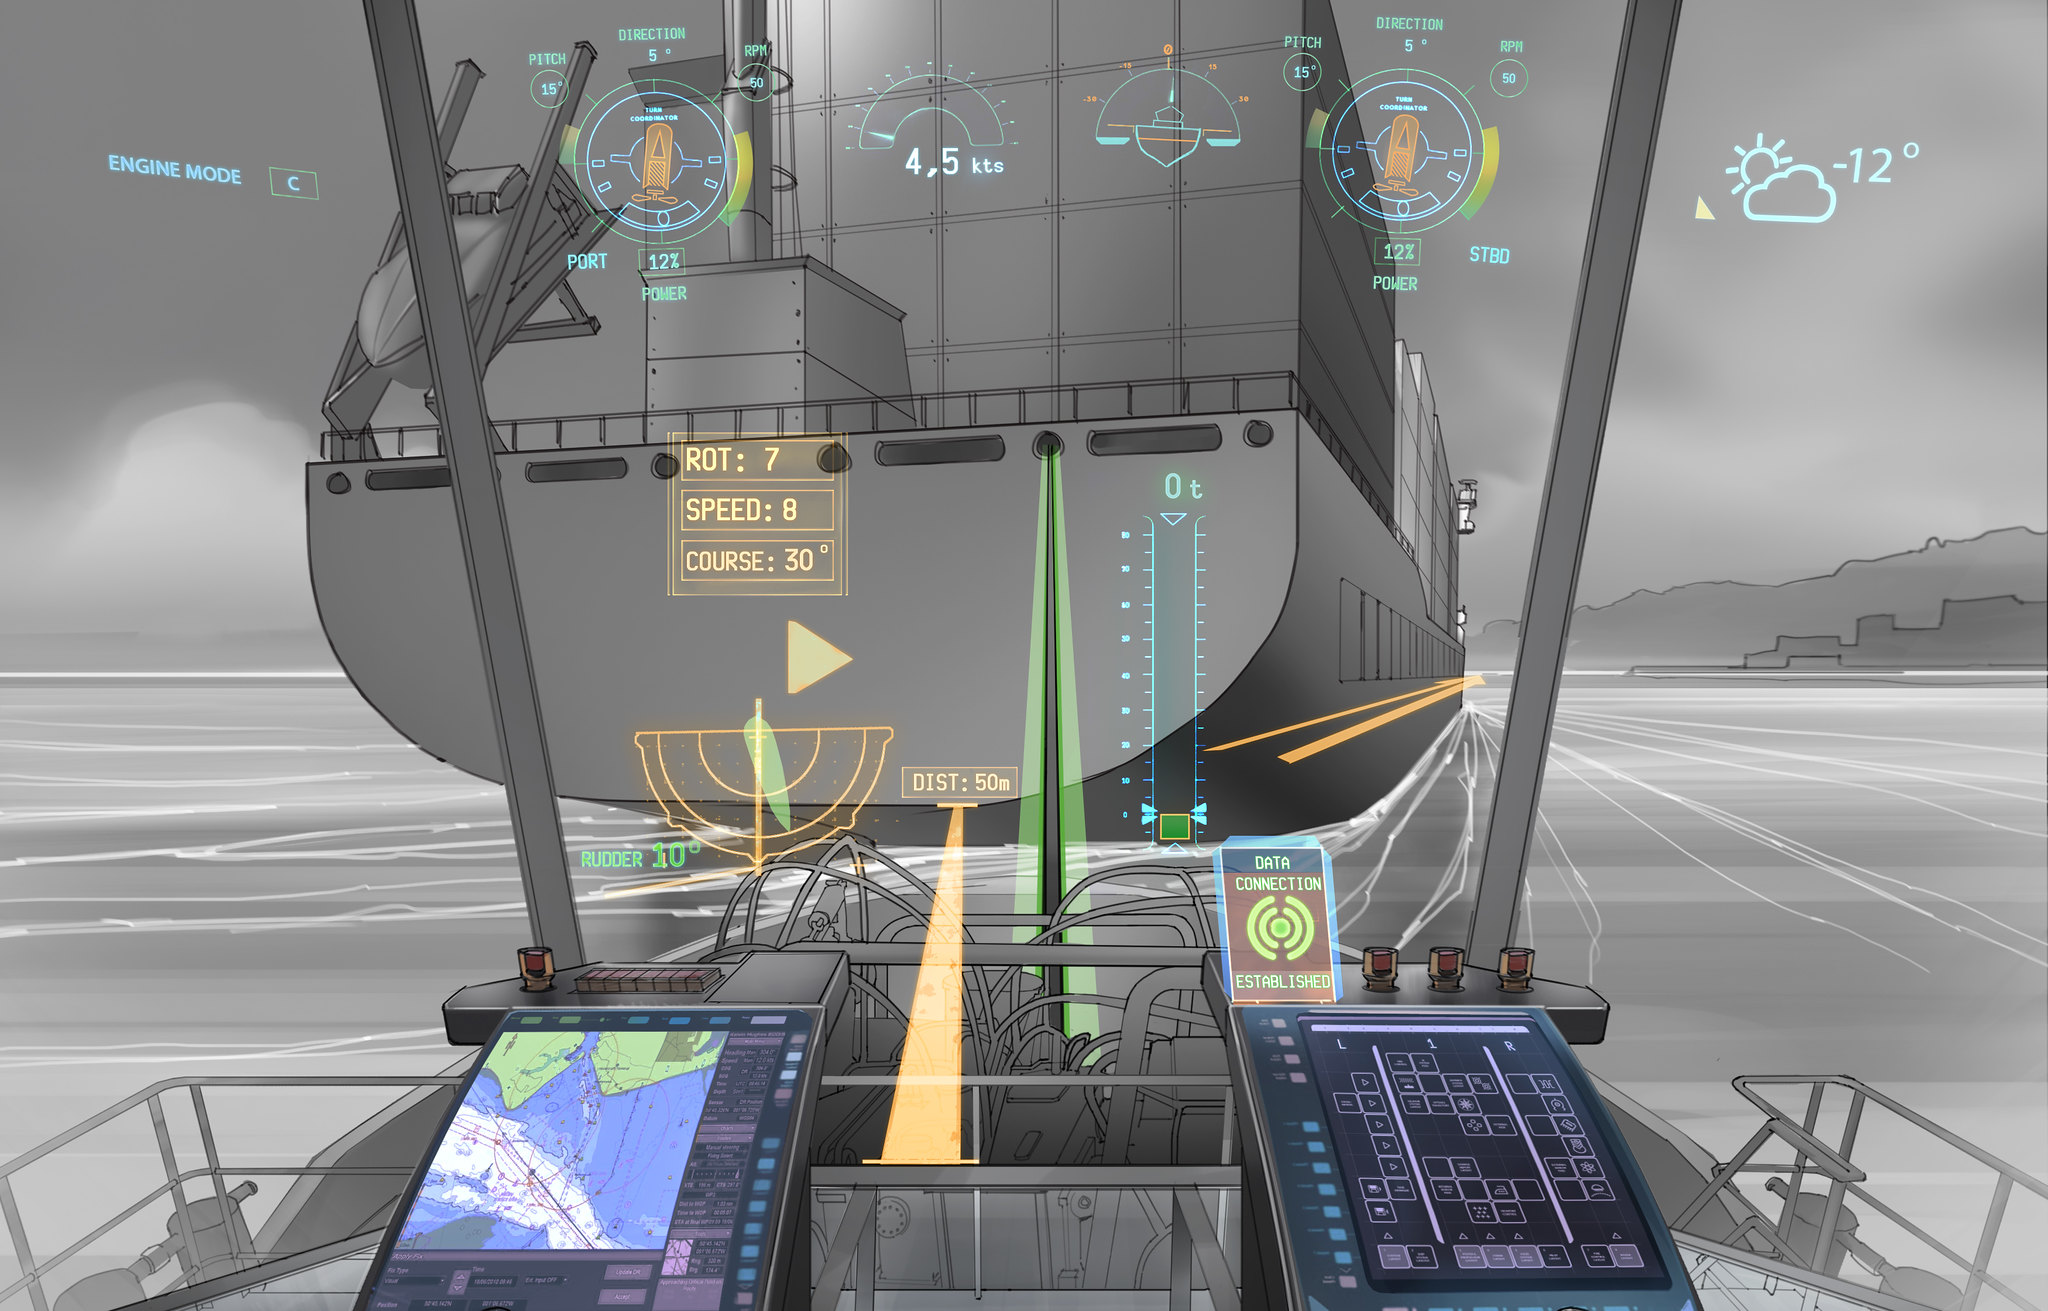
For example, in platform support operations, oX allows the shore control center to provide a detailed operations plan for the captain, oversees the vessel's approach to the platform, coordinates and maintains a robotic ship on standby in the event of trouble, compensates for equipment malfunctions, and can even autonomously move cargo containers from the loading area on deck to their stowage points.
At any point, control of operations can shift between the captain, the autonomous system, and the control center as required.
Rolls-Royce sees oX and similar systems as key technologies that will determine the shape of future ships as they become more automated, connected, and possibly autonomous over the next two decades. Properly used, the company regards these as a way of reducing costs, making ships more energy efficient, safer, and environmentally friendly.
"With the demands of environmental legislation and rising operating costs, ships are going to become more complex" says Mikael Makinen, Rolls-Royce, President - Marine.
"Add to that the fact that skilled crews are already in short supply, then we see a distinct gap opening up between the complexity of ships and the competency of the people who will crew them. That will cause real problems for the industry, and we believe it is Ship Intelligence, that will fill that gap."

Part of the oX technology can be found in Rolls-Royce's Unified bridge, which was installed on the vessel Stril Luna to provide an ergonomic bridge environment while coordinating onboard equipment operations.
In addition, Rolls-Royce says that remote monitoring is already used by the company with control centers in Alesund, Norway, and Rauma, Finland to monitor onboard equipment, such as engines and cargo handling, as well as ships around the world in real time.
In addition to its new version of the oX, Rolls-Royce also released a series of new images of possible robotic ships of the future, including a natural gas carrier that has a curved whaleback without a hint of a deck, a cargo container ship that's all cargo and no superstructure, and a bulk carrier with a flat deck given over entirely to loading hatches.
"Many of the technology building blocks that will control the ships of the future are already available today, but there is still work to be done to develop marine solutions from them," says Oskar Levander, Rolls-Royce, Vice President - Innovation - Marine.
"We are investing in ship intelligence, which will be a major driver of the next transition era of shipping. Much in the way that sail gave way to steam powered ships, and coal gave way to oil, we will see increasingly sophisticated ships, highly automated and perhaps even unmanned remote controlled, plying the seas within the next two decades."
Links :
Monday, December 15, 2014
England and the North-East Passage

Robert Thorne, Orbis Universalis Descriptio. London, 1582. British Library C.23.b.35
Robert Thorne, Orbis Universalis Descriptio. London,
1582. British Library C.23.b.35. - See more at:
http://britishlibrary.typepad.co.uk/magnificentmaps/index.html#sthash.vJEyQGQs.dpuf
From British Library
This gripping guest blog, in conjunction with our current Arctic exhibition, has been generously provided by historian James Evans.
James is author of 'Merchant Adventurers, an account of the Tudor search for a north-east passage'.
There ‘remained only one way to discover’, the Bristol merchant Robert Thorne told fellow Englishmen early in the 16th century, ‘which is into the north’.
Officials and merchants had seen the wealth amassed in Spain and Portugal by the discovery of new routes across the ocean.
But while the Pope tried to reserve all non-Christian lands to the Iberian nations, the English insisted this could apply only to territories reached by sailing south.
To the unexplored north England claimed a God-given right.
After all, John Cabot had discovered North America for the English in the 15th century, soon after Columbus’ epochal voyage.
And many thought there must be a passage here to ‘Cathay’, as China was then known, to match that in the south – because land on the earth was bound to be balanced.
How else would it spin straight?
Thorne wrote a tract, and drew a map, to illustrate his ideas.
He argued the English could sail due north, across the Pole, then descend towards undiscovered lands in the Pacific.
He admitted that many considered this impossible, the sea in the far north being ‘all ice’, the cold ‘so great that none can suffer it’.
But others believed ice formed only near land, while open ocean, across the top of the world, would remain clear.
Thorne tried to organise a voyage to test the idea, but died before he could. Not until Henry VIII had died too did power pass to men who truly believed in the value of exploration.
Under Edward VI, Cabot’s son, Sebastian, was lured back from Spain – and it was he who oversaw, in 1553, a major English attempt to find a northern passage.
Which way would they go?
North-west?
North-east?
Or directly north?
The watching Spanish ambassador fretted, rightly, that England was ‘seeking the road to the Indies’.
But he didn’t know whether the north could offer one.
No one did.
The lack of knowledge about this part of the world is shown on a map made for Henry VIII by Jean Rotz, on which huge empty spaces reveal the ignorance which existed concerning the north parts of the world.

Jean Rotz, [Double hemisphere world map], from A Boke of Idrography, London, 1545.
British Library Royal MS 20 E IX
The 1553 crews went north-east, hoping a passage this way would be an ‘easy matter’. But of course it wasn’t.
The world was in the grip of what has become known as the ‘Little Ice Age’, and ice, to the north, was more extensive than it is now.
It was an extraordinary venture, which began trade with Russia via the White Sea – a region carefully charted by William Borough, who sailed then, as a teenager – and it set an important example.
But it failed to find a northern passage.
The ship belonging to the expedition captain, Sir Hugh Willoughby, became hopelessly lost.
The ship belonging to the expedition captain, Sir Hugh Willoughby, became hopelessly lost.
The land ‘lay not’, he wrote in frustration, ‘as the globe made mention’.
His men tried to see out the winter.
His log, in the British Library today, records their desperate final weeks, locked in what it describes as a ‘haven of death’.

Sir Hugh Willoughby, [Extract from a journal of a journey to Cathay, c. 1554],
British Library Cotton MS Otho E VIII
The company set up then in England, whose monopoly extended across the north, continued to look north-east.
Further attempts were made by Stephen Borough (William’s older brother), and later by Arthur Pet and Charles Jackman.
But the landmass pushed them further north, as they moved east, and the ice proved impenetrable.
Attention, in England, switched to the north-west, where Martin Frobisher thought discovery ‘the only thing of the World’ left undone to make a man rich and famous.
Attention, in England, switched to the north-west, where Martin Frobisher thought discovery ‘the only thing of the World’ left undone to make a man rich and famous.

Abraham Ortelius, 'Septentrionalium Regionem Descrip',
from Theatrum Orbis Terrarum, Antwerp, 1572.
The map-maker Abraham Ortelius produced the first Atlas in 1570 – the Theatrum Orbis Terrarum – and his page on the Arctic north showed clear passages to both north-west and north-east.
The British Library's free exhibition Lines in the Ice: Seeking the Northwest Passage.
This
gripping guest blog, in conjunction with our current Arctic
exhibition, has been generously provided by historian James Evans. James
is author of 'Merchant Adventurers, an account of the Tudor search for a
north-east passage'.
There ‘remained only one way to discover’, the Bristol merchant Robert Thorne told fellow Englishmen early in the 16th century, ‘which is into the north’.
Officials and merchants had seen the wealth amassed in Spain and Portugal by the discovery of new routes across the ocean. But while the Pope tried to reserve all non-Christian lands to the Iberian nations, the English insisted this could apply only to territories reached by sailing south.
To the unexplored north England claimed a God-given right. After all, John Cabot had discovered North America for the English in the 15th century, soon after Columbus’ epochal voyage. And many thought there must be a passage here to ‘Cathay’, as China was then known, to match that in the south – because land on the earth was bound to be balanced. How else would it spin straight?
- See more at: http://britishlibrary.typepad.co.uk/magnificentmaps/2014/12/england-and-the-north-east-passage.html#sthash.faeQlETG.dpuf
This
gripping guest blog, in conjunction with our current Arctic
exhibition, has been generously provided by historian James Evans. James
is author of 'Merchant Adventurers, an account of the Tudor search for a
north-east passage'.
There ‘remained only one way to discover’, the Bristol merchant Robert Thorne told fellow Englishmen early in the 16th century, ‘which is into the north’.
Officials and merchants had seen the wealth amassed in Spain and Portugal by the discovery of new routes across the ocean. But while the Pope tried to reserve all non-Christian lands to the Iberian nations, the English insisted this could apply only to territories reached by sailing south.
To the unexplored north England claimed a God-given right. After all, John Cabot had discovered North America for the English in the 15th century, soon after Columbus’ epochal voyage. And many thought there must be a passage here to ‘Cathay’, as China was then known, to match that in the south – because land on the earth was bound to be balanced. How else would it spin straight?
- See more at: http://britishlibrary.typepad.co.uk/magnificentmaps/index.html#sthash.uJFqb7y6.dpuf
Subscribe to:
Posts (Atom)