Saturday, September 17, 2022

Hunter or prey - Freediving Azores with hammerhead sharks, mobulas, baitballs, bluesharks


This is an homage to immersive freediving, filmed during 4 days on the ocean of Faial in The Azores, Portugal.
A very special place for us as it is not easy to make it your own.
It takes time and experience to be able to find the right place at the right time to witness such diversity.
We are grateful to be allowed to follow Fred Buyle, one of the world most experienced freedivers into his backyard.
We discovered once more that freediving in the open ocean with Blue Sharks, Mobula Rays and Hammerhead Sharks requires a good sense for your own body, as well as a lot of knowledge about the animals.
Around bait balls the behaviour of the Sharks is much more direct as they interpret your presence as a competition for food.
You can feel like the hunter and the prey from one moment to the other.
A humbling experience which we are happy to share in the form of this video.

Friday, September 16, 2022

Observing the Inuit Iceman


From WSJ by Peter Cowie

‘Nanook of the North,’ the 1922 film, often considered the first documentary and created by Robert J.
Flaherty, uses a uniquely humanistic lens to depict the life of an Inuit family in their harsh northern landscape

One hundred years ago this summer, Robert J. Flaherty presented “Nanook of the North” to the public in New York.
In the documentary genre, this extraordinary portrayal of an Inuit (at that time called Eskimo) family is as impressive a maiden feature as Orson Welles’s “Citizen Kane” is among fiction films.
Flaherty became, almost overnight, “the father of the documentary film.”
In recent decades, however, “Nanook of the North” has been criticized increasingly for its fabrication of a kind of poetic realism no longer accepted in documentary ethics.

Nanook about to hurl a spear
photo : Corbis via Getty Images

Flaherty in 1910 embarked on the first of a series of path-breaking and perilous explorations on behalf of his employer at the time, the Canadian railroad magnate Sir William Mackenzie.
Fascinated by the everyday life of the Inuit people, Flaherty shot some 30,000 feet of film with his Bell and Howell hand-cranked camera—only to lose the entire negative footage in a fire.
Undaunted, he returned to the Inuit lands in Quebec in 1920.
At that juncture, a mere 300 Inuit hunted “in an area the size of England,” according to the director.
He took equipment to print the film immediately after shooting, and also a projector so that the Inuit could understand and appreciate what he was doing.
Flaherty’s two cameras on the 1920 expedition could pan and tilt more easily—and were lighter—than other cameras.
In temperatures of minus 37 degrees Fahrenheit, however, the film sometimes became so brittle that “it broke into bits,” Flaherty wrote in his workbook, “like so much wafer glass.”

“Nanook of the North” follows the life of the charismatic Nanook through the seasons of Hopewell Sound in Hudson’s Bay, as he hunts, and trades, and protects his family at every turn against the unyielding elements.
A century later, Flaherty’s images of the indigenous people of northern Canada seem far ahead of their time.
The approach is never patronizing.
Nanook and his family evince and dignity as they survive without complaint from one day to another on the vast ice fields, seeking food in the form of white fox, walrus or seal, and building igloos in time to shelter for the night.
The attention to detail is meticulous.
Flaherty observes Nanook killing freshly caught fish with his teeth; cladding a kayak with sealskin; or cutting a piece of ice to form a “window” for his igloo.

Flaherty and his wife, Frances Hubbard Flaherty (who contributed to the production at every stage), realized the importance of creating a narrative, and this they did by staging a series of vivid tableaux—Nanook and his family emerging, one after another, from the interior of a kayak; sharpening their walrus-ivory knives by licking the blade so they freeze instantly as they flense a seal; or breaking up a squabble among the indispensable huskies who drag the sleds and kayaks alike.
The editing sustains this artificial narrative with remarkable skill and a sense of rubato in tune with the Inuit’s indigenous way of life.

Several situations were clearly fabricated, but that in no way diminishes the unadorned authenticity, nor the inherent energy of what goes on within the film frame.
For example, the Inuit had stopped hunting walrus and were using rifles to catch much of their prey.
Because the light inside an igloo was too meagre for the cameras to record on film, Flaherty had Nanook and family build a fake igloo, open to the daylight, so that he could show the Inuit crawling into bed with one another while the husky puppies were tucked into a corner to protect them from the freezing temperatures.

While “Nanook of the North” (subtitled “A Story of Life and Love in the Actual Arctic”) captivated audiences in the U.S., Europe and even Japan, the image of the Inuit as more than just “Noble Savage” served as an antidote to the countless westerns in which the “only good Indian was a dead Indian,” to paraphrase the young Theodore Roosevelt.
The tireless Nanook (meaning “The Bear”), along with his partner, Nyla (“The Smiling One”), wears his heroic image with cheerfulness and pride, although in real life Nanook may have starved to death while hunting in vain for deer (Flaherty’s claim) or succumbed to tuberculosis just two years after Flaherty had completed filming.

The appeal of “Nanook of the North” stems from its humanism.
Nanook comes to embody a way of facing the world, of taking it by the scruff of the neck and wringing existence from it with a laugh.
“Nanook of the North” remains the great begetter of countless nature documentaries, from the work of conservationist Jane Goodall to David Attenborough’s “Green Planet” series.
Decades earlier, Flaherty’s the film confronted man’s struggle to survive in a hostile environment, and did so with the instruments of the cinema more effectively than any work of the period.
A digitally remastered version was released by the Criterion Collection in 1999 and is available on Amazon Prime video.

Links :

Thursday, September 15, 2022

Blue Humanities: Mankind has conquered seas using charts and models


Understanding the Ocean's history N: “Our oceans are radically changing due to human
impact.
It is our goal to show how knowledge about the sea is produced,” says Historian of Ideas Ellen Krefting.

Photo: Drew Darby/Unsplash

From Oslo Univ by Ellen Krefting


Nautical charts have played an important role in providing us with knowledge of the world’s oceans.
They have also framed the ideas we could have about the ocean, including issues relating to the climate and sustainability.

An article published by the Norwegian newspaper Aftenposten in May provides a visual portrayal of the maritime boundaries of the Arctic region.
Nobody owns the Arctic, but several nations including China and the USA want to exploit the vast resources there and to sail through it, as the ice melts and new shipping lanes open.

The map published by Aftenposten showed the Arctic both now and what it might look like when the ice has melted.

According to Ellen Marie Krefting, Professor of History of Ideas at the University of Oslo, the article falls in line with a tradition dating back several hundred years.
“Charts have been handmade, printed and used as a symbol of power, territory and to define those resources found beneath the surface. And, of course, for navigation. The format for nautical charts has remained the same since the 17th century, even though the technology has developed,” she says.
 
Carta Marina
 
“It’s important to understand the history” 

“Other formats of knowledge are models and records that have helped us understand the oceans,” Krefting continues.
“The ocean is vast, inaccessible and difficult to understand.This has prompted the development of technologies and other aids. But how did these aids develop? What opportunities have they provided for us to be aware of environmental protection? And how have they limited us?”
BLUE HUMANITIES: “We believe that we are in control of the ocean, and that all we need is knowledge and the technology.” Ellen Kreftingquestions general understandings of the ocean.
These are questions studied by Ellen Krefting and her colleagues on the project entitled Maritime modernities, which they started in 2021.
In the project, humanities researchers are studying how knowledge of the oceans has been produced and established since the 17th century and up to the present day.
“One fundamental belief in my discipline is that if we understand history, it will be easier to understand our current position and what brought us here,” says Krefting.
She also believes that such an approach can help us find a new direction, if necessary.
According to her, this might well be the case today.

Unlimited resources?


“Our modern mindset is that the oceans are in principle an unlimited resource, and that we just have to keep finding new ways of exploiting it as efficiently as possible. We’ve always focused on growth, and now we are even talking about sustainable growth,” she points out.

She believes that, for a long time now, the oceans have been a blind spot in discussions of the “Anthropocene” epoch, in which we study our era as a geological epoch shaped by human impact.
In other words: Our discussions have focused more on overexploitation of life on land than in the sea.

“But our oceans are radically changing due to human impact.
It is our goal to show how knowledge about the sea is produced and the formats we have used to understand the oceans all play a role.”

Krefting believes that overexploitation of resources is based on a mindset that has mainly evolved over the past 200 to 250 years.
“People started to challenge this mindset, however, during the post-war period.
This was when we began to take a critical view of the population growth on our planet and started to talk about the environment, ecology, and the need for regulation. At that time, we thought this was a new concept.”

Regulation of the seas in the 17th century

This was not true, however.
As an expert in 17th and 18th century history, Krefting has extensive knowledge of Early Modern French maritime law.
During this period, France was a superpower and a nation very fond of creating legislation for most aspects of life, including the seas.
“At the end of the 17th century, the French government attempted to establish the oceans as a space that could be regulated,” she explains.

Jean-Baptiste Colbert, Minister of Finance under King Louis XIV prepared legislation to govern lakes and forests, oceans and use of the seas.
A major piece of legislation was introduced in 1682, the so-called marine ordinance.
“The ordinance stated that all marine resources were to be regulated, be it seaweed, shipwrecks, fish or amber.”

Local experience is underestimated


One important principle in the French legislation was to preserve resources for future generations.

“I believe that the way our 17th century ancestors understood that nature was under threat was more local and based on experience. As society became more globalised and scientific, the people in power started to underestimate local experience. This is still evident today,” says Ellen Krefting, and continues: “Today, we only trust knowledge when it is at a generalised scientific level. As such, we underestimate the experience of local fishermen and local communities.”
She also believes that this is reflected in the slogan for the UN’s Ocean Decade, which started in 2021: “The Science We Need for the Ocean We Want”.

The objective is for all nations of the world to mobilise to develop the science we need to ensure the ocean we want.
“I find this slogan interesting because it implies that the ocean we want is something we can create.
We believe that we are in control of this, and that all we need is knowledge and the technology.”

Questioning the obvious

Charts, models and records, such as nautical logs and catch reports, have been key in providing knowledge of the oceans.
However, they have also delimited our knowledge and demarcated what type of knowledge and ideas we can have,” says Ellen Krefting.
“We may feel that these aids are completely obvious, natural and self-evident – of course we will be making charts, of the ice edge, for example! And of sea levels, seabeds, ocean currents and fish stocks.
We use charts and maps for many different kinds of knowledge about the oceans,” she says.

But how did maps and charts actually become such an important and impervious knowledge format? And what about the models, from miniature ships to mathematical models and interpretations of the seabed in three-dimensional shoeboxes?
How did they become so important?
“These formats provide a way of organising a vast amount of knowledge of the oceans, and have done so to an ever-increasing extent over a 400-year period, based on a constantly growing volume of data.
In my discipline, one instinct is to question knowledge that we feel is obvious,” says Krefting, elaborating:
“We are unwinding these knowledge formats not only because they shape the way we view the oceans, but also the way we use our minds.
Perhaps our views of resource exploitation are interlinked with the way we organised our knowledge.”

The rise of the “Blue Humanities”

Traditionally, research into the oceans has been performed by natural scientists.
In more recent years, however, literary scientists, anthropologists, historians and media scientists have also embarked on this research, resulting in the emergence of what is known as the Blue Humanities.

As such, there has been a shift of focus within several Humanities from the land to the sea.
Krefting’s research is a part of this shift.
She believes that the research may be instrumental in increasing our understanding of the oceans’ history – and that this will provide us with new perspectives as we plot out our future.

“Humankind was not born with maps. This is technology we have developed. But it has become so integral and important that we cannot imagine life without it. This makes it all the more important to study how this emerged, and how it has coloured the way we now understand the world and act accordingly,” she says.

Maps and charts provide information on human interests

Back to the Arctic: Krefting points out that the charts we use to portray the possible conflicts implied by an ice-free Arctic do not show how the increase in shipping will accelerate the ice melt.
Neither do they show how this will affect ecology and the climate.
“No matter how accurate or comprehensive they are, charts will always frame our surroundings in specific ways, for different purposes.
They are as much a portrayal of human interests in this maritime area than of the Arctic Sea itself.”

Krefting believes it is particularly interesting to monitor how the format of the chart affects the way we view an ocean such as the Arctic Sea.
“It was not until 1921 that the Arctic Sea or Arctic Ocean was officially assigned status as an ocean.
Up until the Second World War, the belief was that the sea under the ice was practically dead,” she says.

She goes on to explain that this perspective has now changed radically.
“The Arctic today is not just a matter of political and economic dispute, the ocean itself now plays a key role for the ecology and climate.The Arctic Ocean is changing faster than perhaps any other ocean in the world, with different consequence scenarios. This has given rise to a charting bonanza: Never before have we drawn as many different charts of the Arctic.”
 
Links :

Wednesday, September 14, 2022

A Polar Vortex is now emerging in the Stratosphere over the North Pole and will impact the weather as we head closer to Winter 2022/2023


From Severe Weather by Andrej Flis
 
A Polar Vortex is now emerging in the Stratosphere over the North Pole.
It began forming as seasonal cooling intensified and will continue to strengthen well into the Winter of 2022/2023.
With a long history of Winter weather impacts over the United States and Europe, it is being closely monitored throughout every fall and Winter.

As you will see, there are many layers to the Polar Vortex and different weather outcomes it can produce.
But, regardless of strong, weak, or collapsed, it always plays an important weather role.

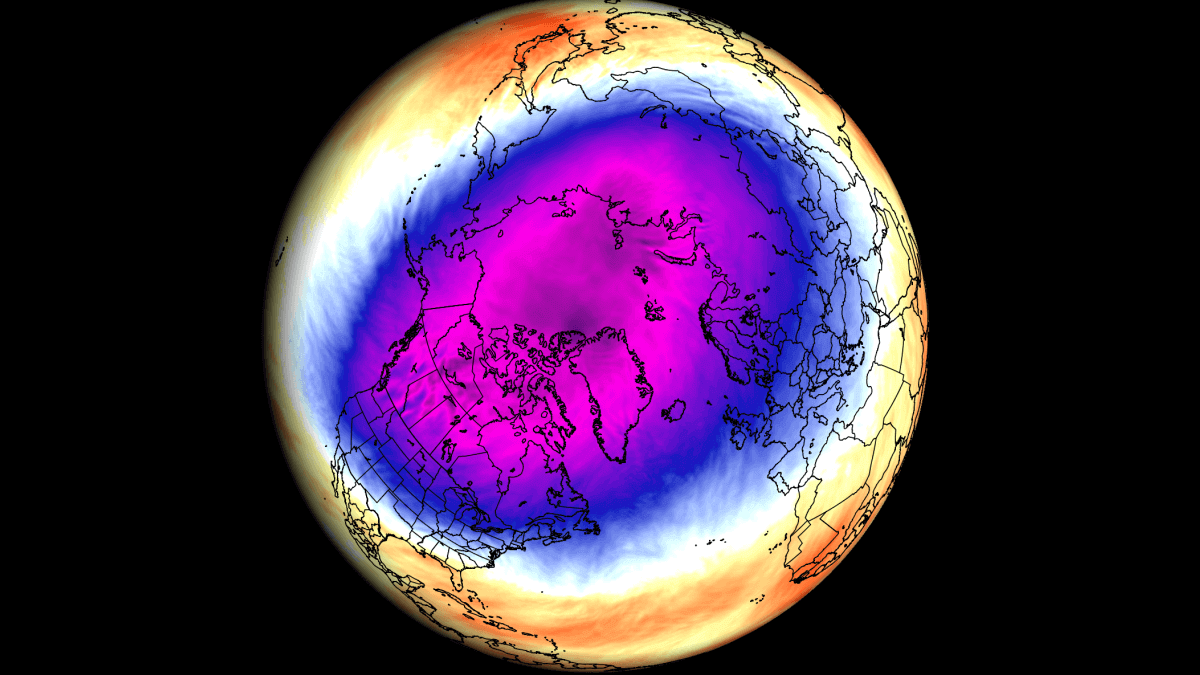
The image below shows one of the strong Polar Vortex events from a few Winters back.
Such a near-circular shape usually means strong stratospheric circulation.
But first, what is the Polar Vortex, why do we care about it, and why should you?

WHEN THE NORTH POLE STARTS COOLING

As we head into autumn, the polar regions start to receive less sunlight.
With less solar energy, temperatures begin to drop and seasonal cooling begins over the north pole.

But as the polar temperatures drop, the atmosphere further to the south is still relatively warm as it continues to receive light and energy from the Sun.

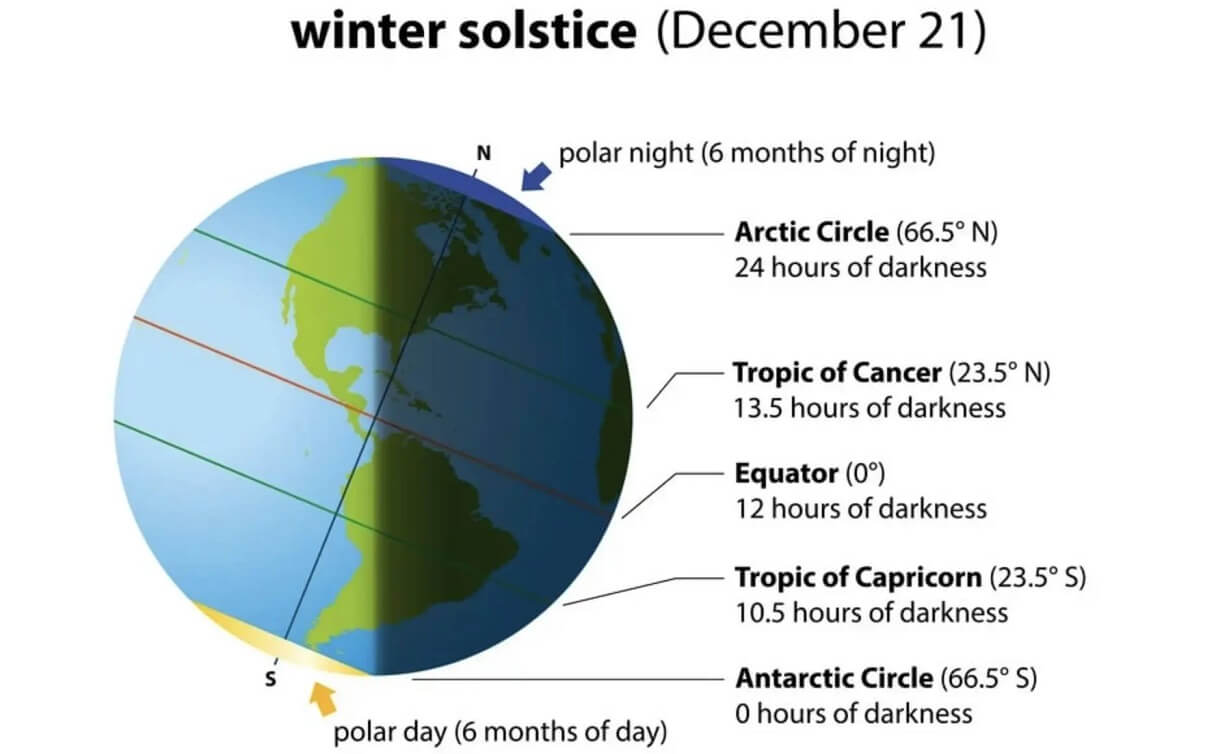
You can see the winter solstice in the image below.
The polar regions receive little to zero solar energy compared to regions further south, which still receive plenty of sunlight and warmth.


But, as temperature drops over the polar regions, so does the pressure.
This process is the same on the surface and up in the Stratosphere.

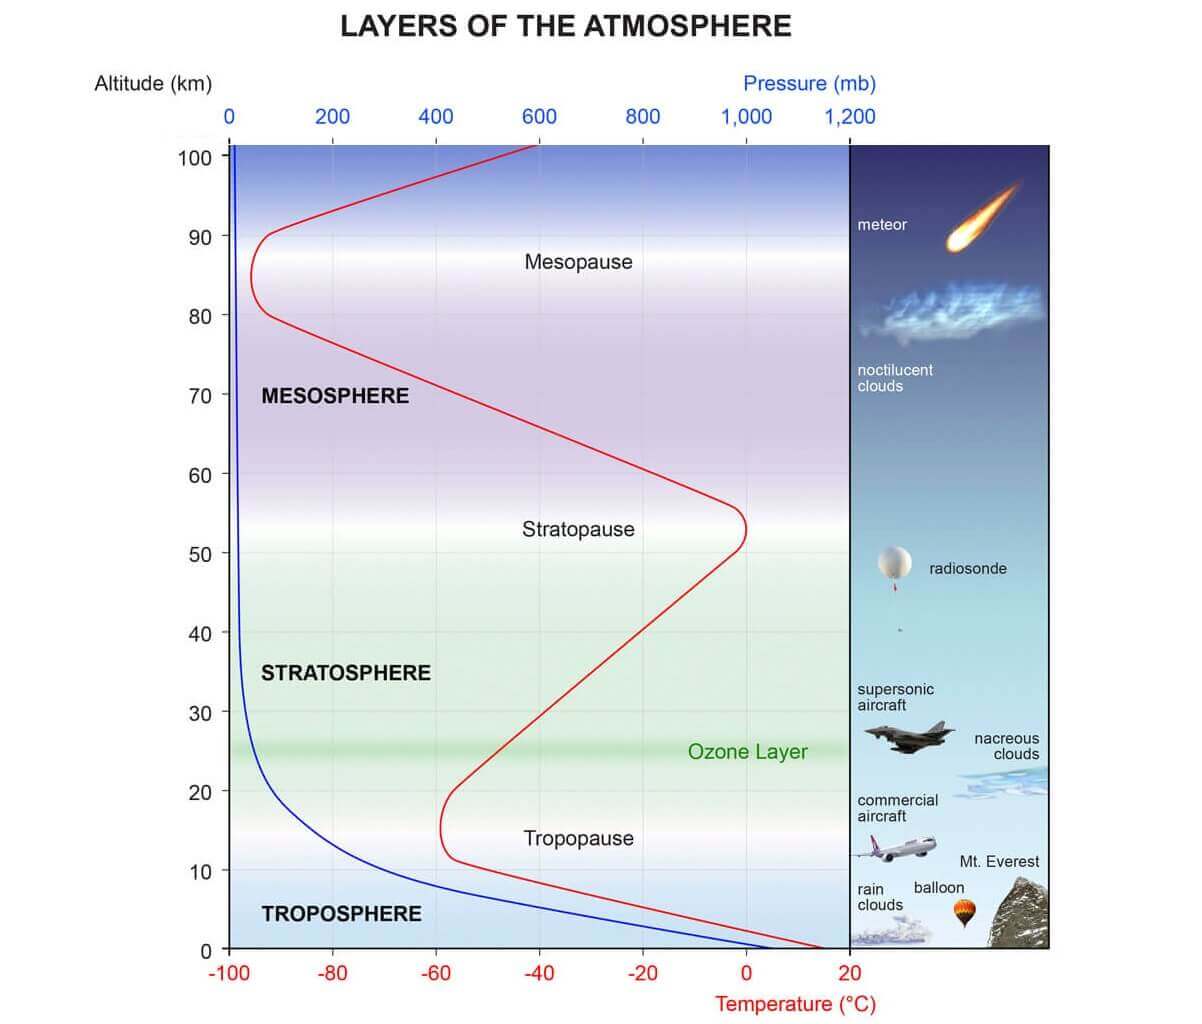
You can see the layers of the atmosphere in the image below.
The troposphere (blue layer) and the weather are on the bottom, and the Stratosphere (green layer) with the ozone layer above it.


This causes a strong global pressure difference between the polar and sub-tropical regions, and a large low-pressure (cyclonic) circulation starts to develop across the Northern Hemisphere.
It extends from the surface layer far up into the Stratosphere.
This is known as the Polar Vortex.

We produced a 3-dimensional display of the Polar Vortex, extending from the lower levels into the Stratosphere.
The vertical axis is greatly enhanced for better visual purposes.
You can see in the image below what the actual structure of the Polar Vortex looks like.


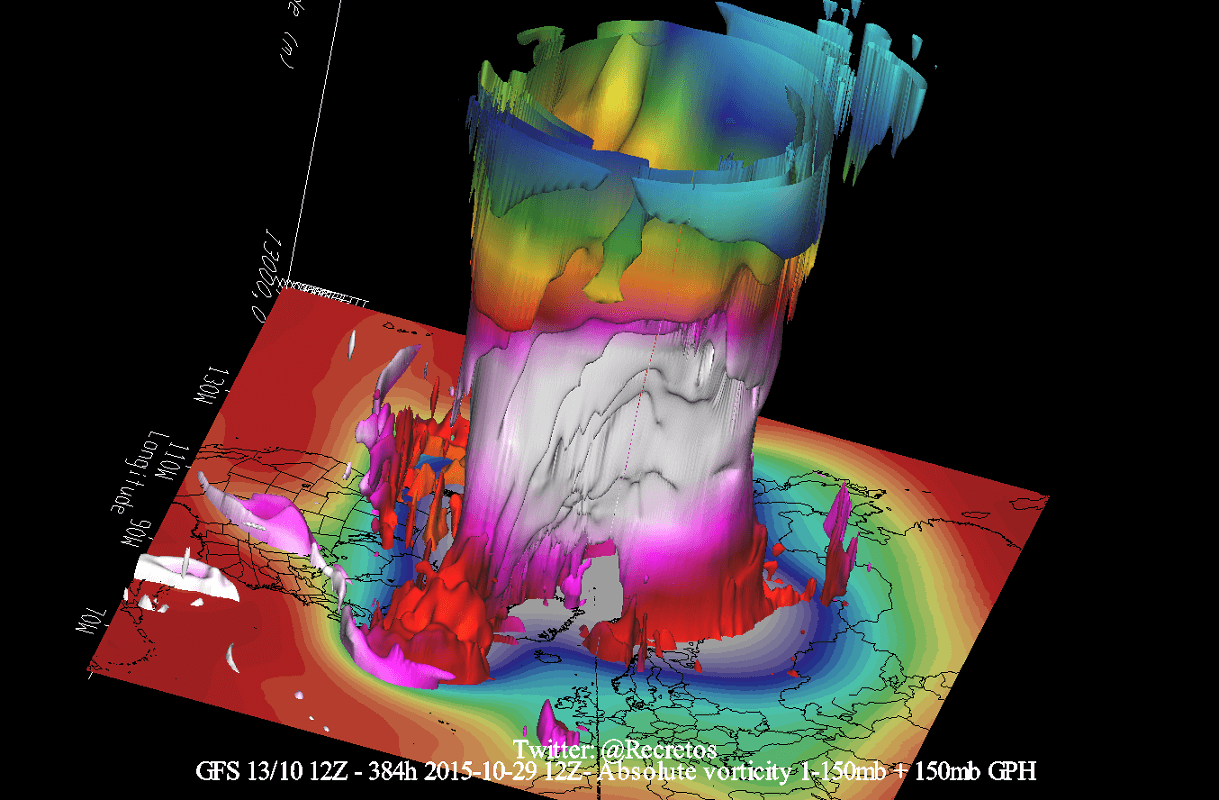
Its upper (stratospheric) part is more circular and symmetrical as it spins higher above the ground.
The lower structure of the polar vortex is much more uneven and disrupted.
That is due to the influence of the terrain/mountains and strong pressure systems acting as obstacles in the flow.

The image below shows a typical example of the high-altitude Polar Vortex at around 30km/18.5miles in the middle Stratosphere during Winter.
It is circular in shape, with the temperature dropping quickly towards its inner core.


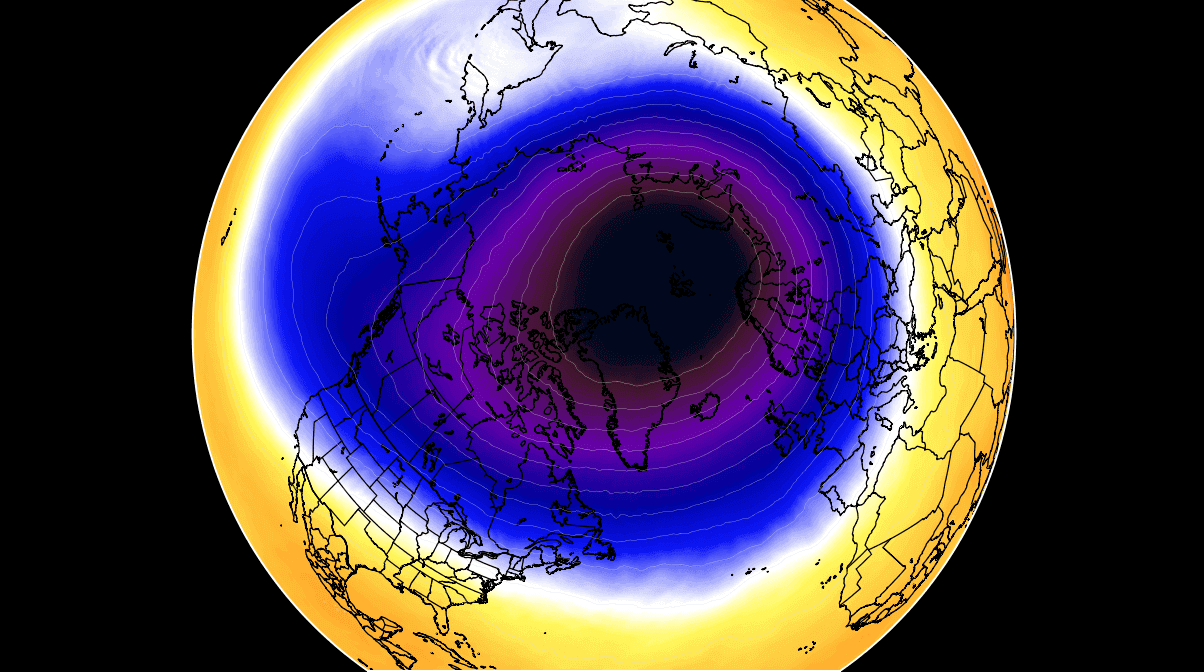
The stronger winds are typically found in the outer edge, also called “the surf zone”.
As you will soon find out, winds are very important when talking about the polar vortex, as they are usually the first to show that something in the polar vortex is changing.

In the next image below, we have the bottom of the polar vortex at around 5km/3miles.
The closer to the ground we go, the more deformed the polar vortex gets because it has to interact with the mountains and overall terrain.


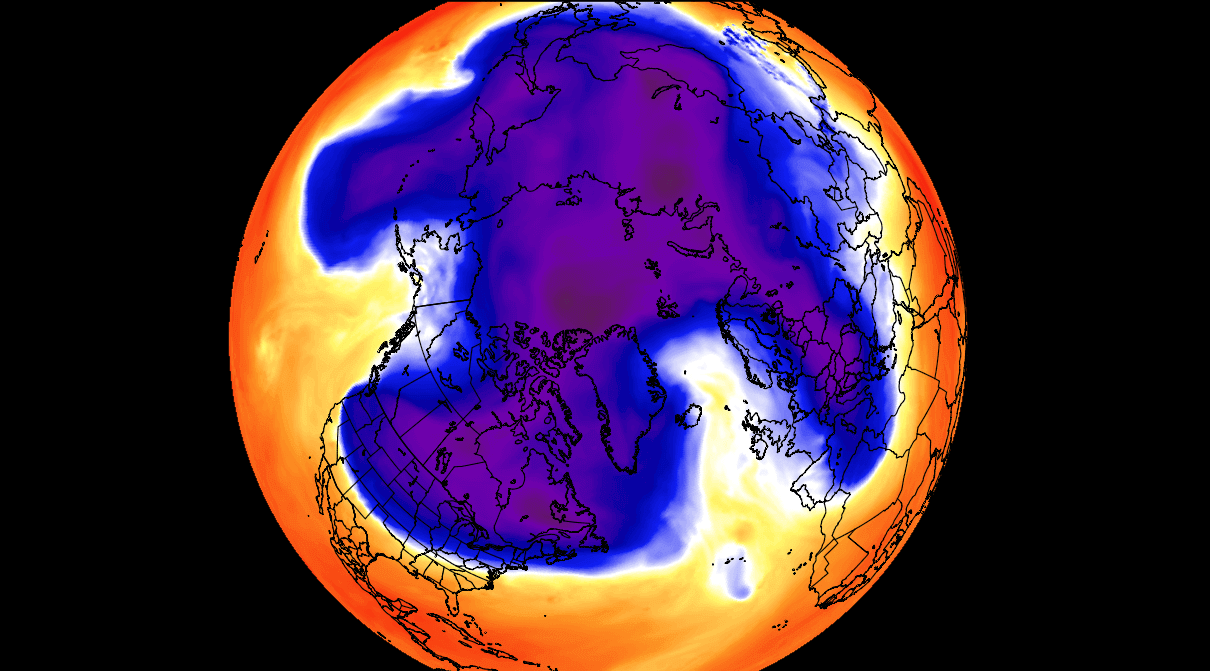
Be aware of its “arms” extending into the lower latitudes, bringing along colder air and snowfall.
These arms also pack a lot of energy and can create strong winter storms, like a Noreaster’ in the United States or cold air outbreaks in Europe.

So to recap, the Polar Vortex behaves like a very large cyclone, covering the whole north pole, down to the mid-latitudes.
It is connected through all atmospheric levels, from the ground up, but usually has different shapes at different altitudes.

We are typically focusing more on the Stratospheric Polar Vortex, as it plays a very important role in weather development throughout the winter season.
It is known for its strong influence down from the Stratosphere.

To put the Polar Vortex into perspective, we produced a high-resolution video below, showing the vortex spinning over the Northern Hemisphere in the Stratosphere at the 30mb level, around 23km/14miles altitude.

The video shows the NASA GEOS-5 analysis for late January 2022.
Notice how the stratospheric vortex covers a large part of the Northern Hemisphere.
This is because it spins over the Northern Hemisphere, driving also the winter weather below with its circulation.

The main takeaway from the video should be that the Polar Vortex is not just one single winter storm or a cold outbreak that moves from the Midwest into the northeastern United States.

It is one large cyclonic area spinning over the entire Northern Hemisphere, from the ground up to the top of the Stratosphere and beyond, reaching over 50km/31miles in altitude.
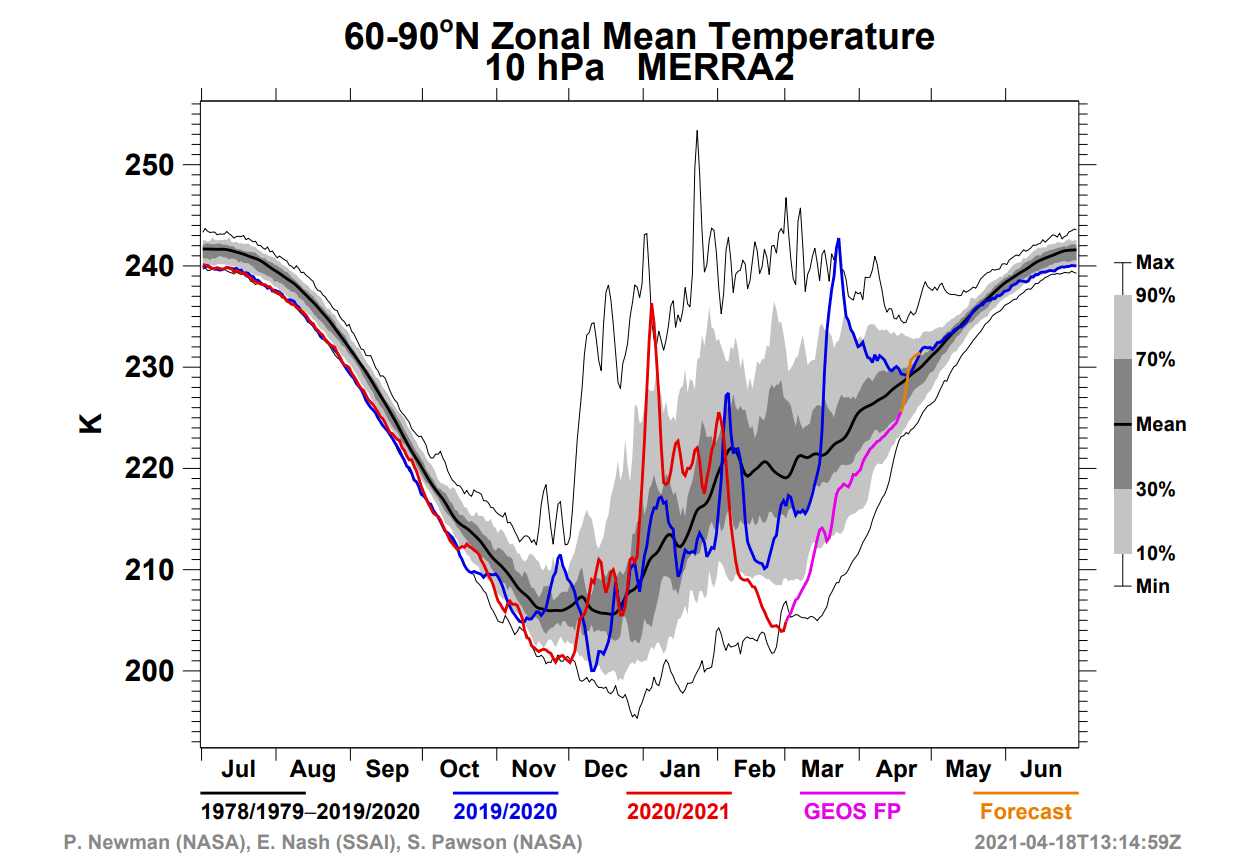
POLAR VORTEX SEASON 2022/2023 BEGINS


As we mentioned above, the cooling over the north pole has already begun.
Below is the NASA analysis graph for temperature in the mid-stratosphere over the north pole.
The blue line is last year, and the grey/white areas are historical data.


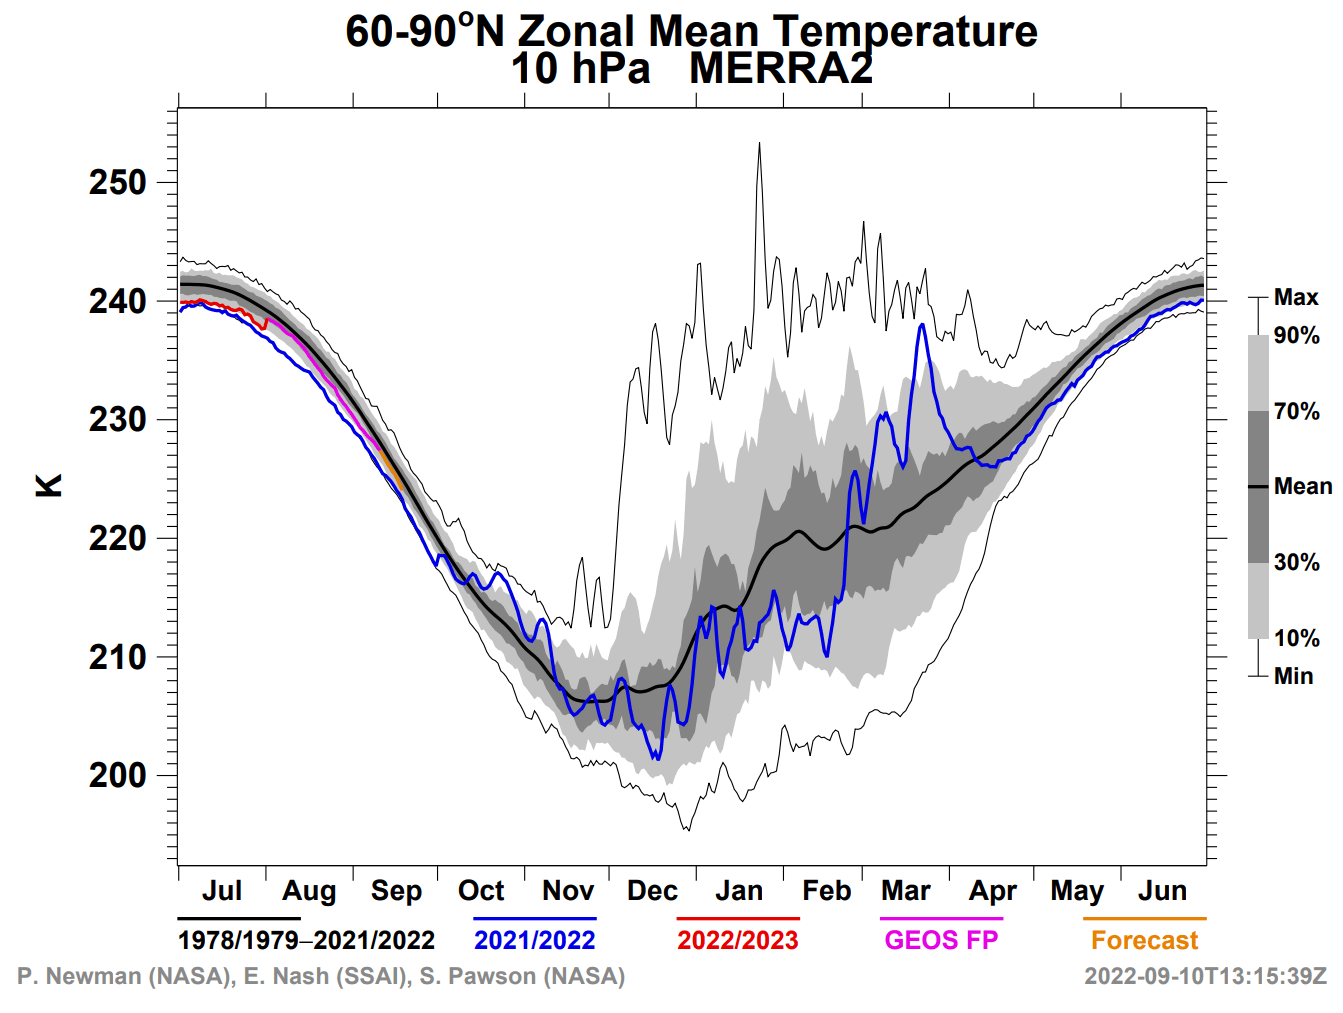
The cooling of the Stratosphere typically starts in August, increasing strongly over September and October.
Finally, the Stratosphere reaches its coolest period in November and December, when the polar vortex is usually the strongest.

Currently, the temperature is already dropping in the Stratosphere.
In the image below, you can see the temperature change forecast for late September.
It shows ongoing cooling over and around the North Pole.


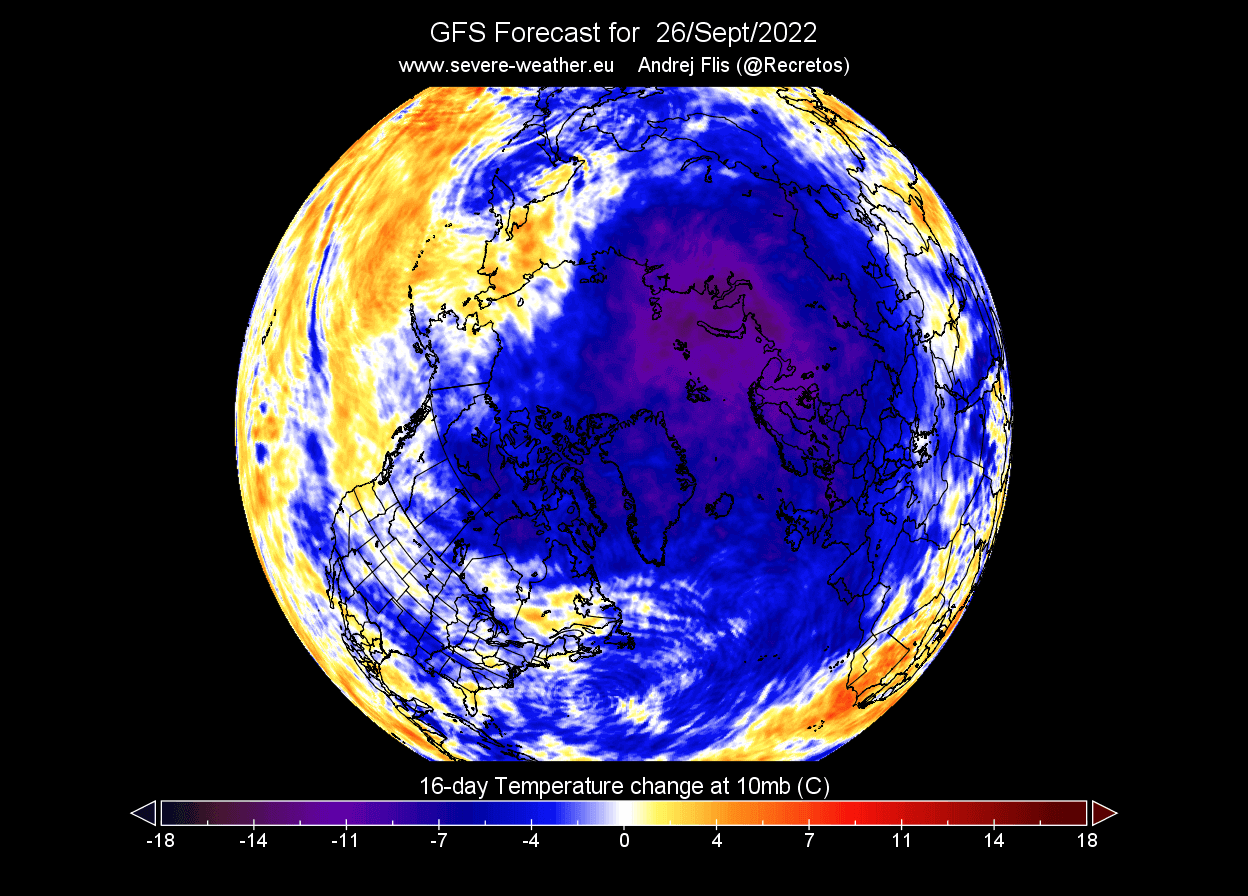
Looking at the actual temperature forecast, we can see a cold core developing over the polar circle.
This is the heart of the Polar Vortex, as the colder it gets, the stronger the polar vortex can become.
That is because it feeds off the temperature/pressure difference between the polar and the southern regions of the Northern Hemisphere.


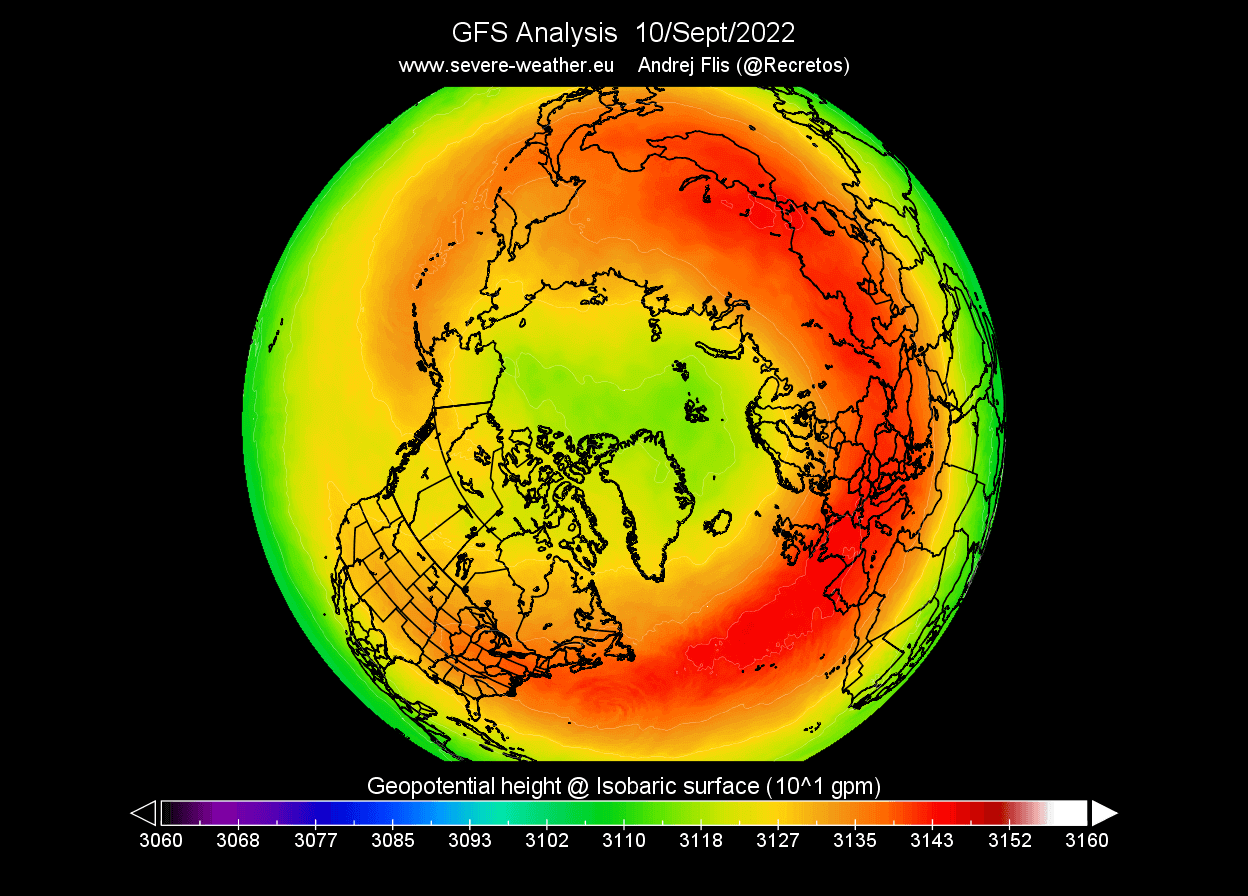
The pressure is also starting to drop rapidly.
The image below shows the geopotential height of 10mb level (~30km altitude).
As a result, a smaller low-pressure area starts to develop over the Arctic Circle.
That is the foundation for the polar vortex of the upcoming Winter 2022/2023.


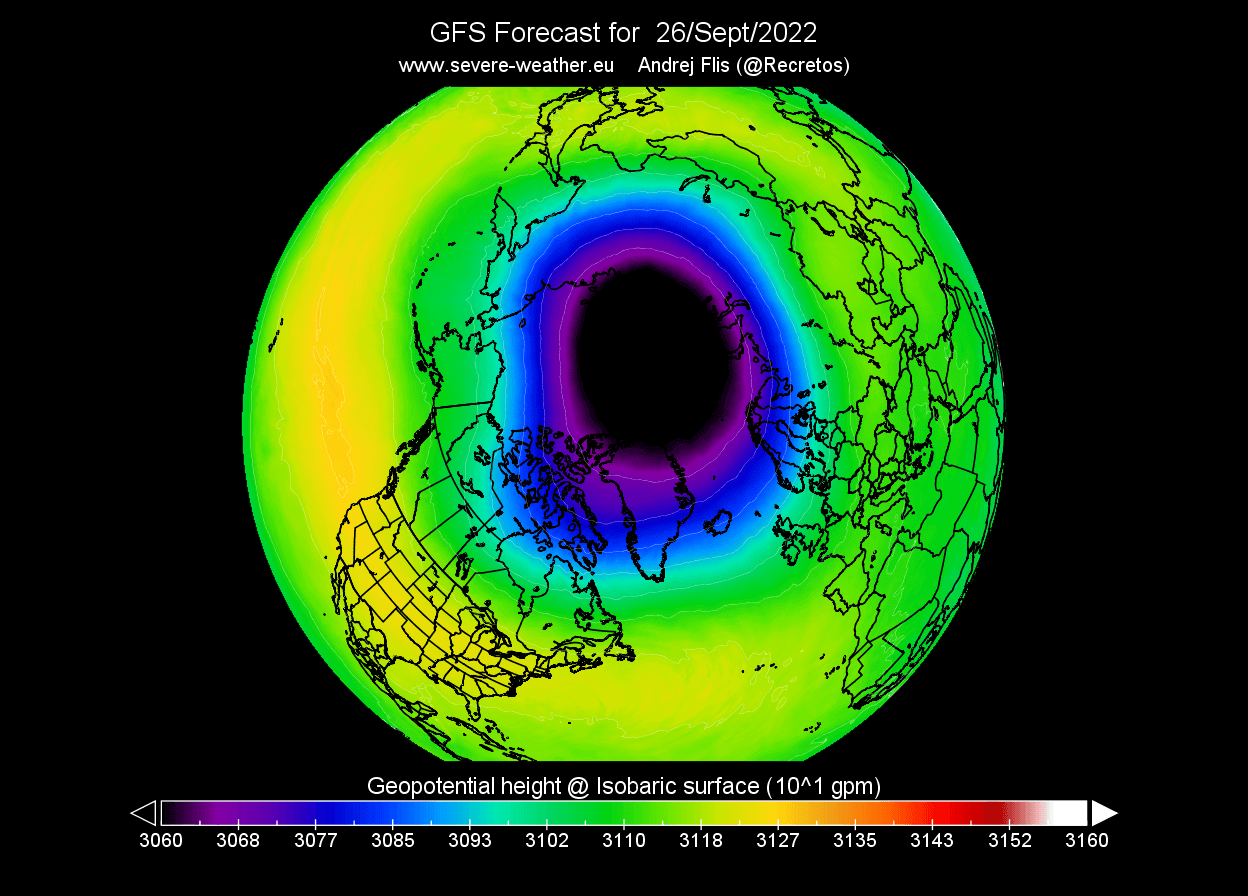
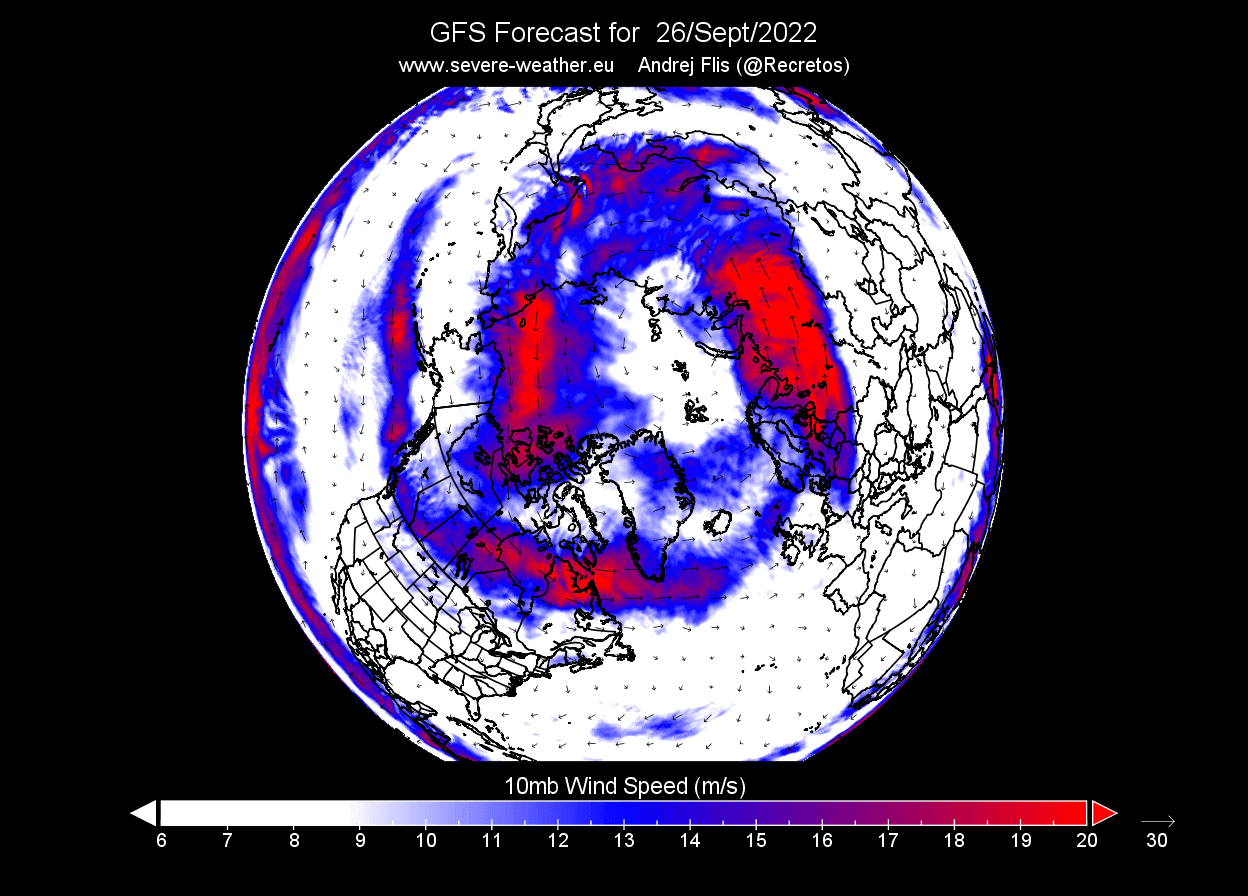
Looking at the forecast for late September, as shown below, you can see the polar vortex is much more developed and rapidly increasing in size and influence.
As the pressure drops in the polar vortex, it increases its wind speed and depth.
The stronger it gets, the easier it is to influence our weather down at the surface.


Speaking of wind, the current forecast shows the stratospheric jet stream developing.
This is also called the Polar Night Jet.
The image below shows the stratospheric jet stream in the upper Stratosphere at 1mb level (~45km/28mi altitude)


Looking at the 10mb level (~30km/18.5mi altitude) forecast, we can see the stratospheric jet stream at this level.
It has a nice oval shape and is already almost connected across the entire Northern Hemisphere.


The strength of the stratospheric jet stream at the 10mb level is usually used to determine the strength of the polar vortex and its potential influence on the weather.
This is especially the case during the early and mid-winter when it is strongest.

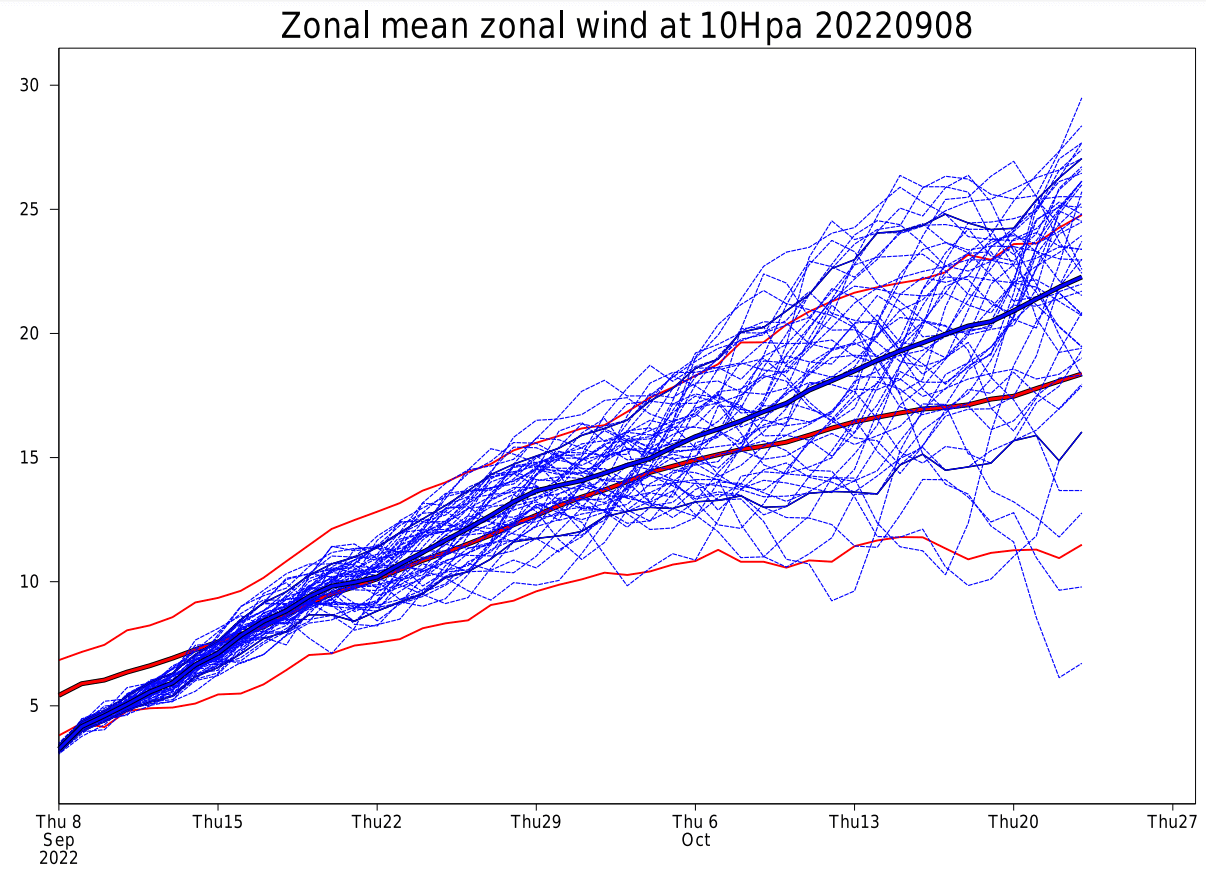
Compared to the long-term average, current forecasts show that the strength of the polar vortex is likely to be around average in late September.

That is seen in the image below, which shows the forecast of the stratospheric jet stream at 10mb (~30km).
Red lines denote the average values.
This might not mean much for now, but it shows that the polar vortex has a more energetic start than usual.


Lower down towards the surface, we can still see these winds, but we call it the jet steam.
The image below shows the wind speed forecast for late September, at around 5km (3 miles) altitude.


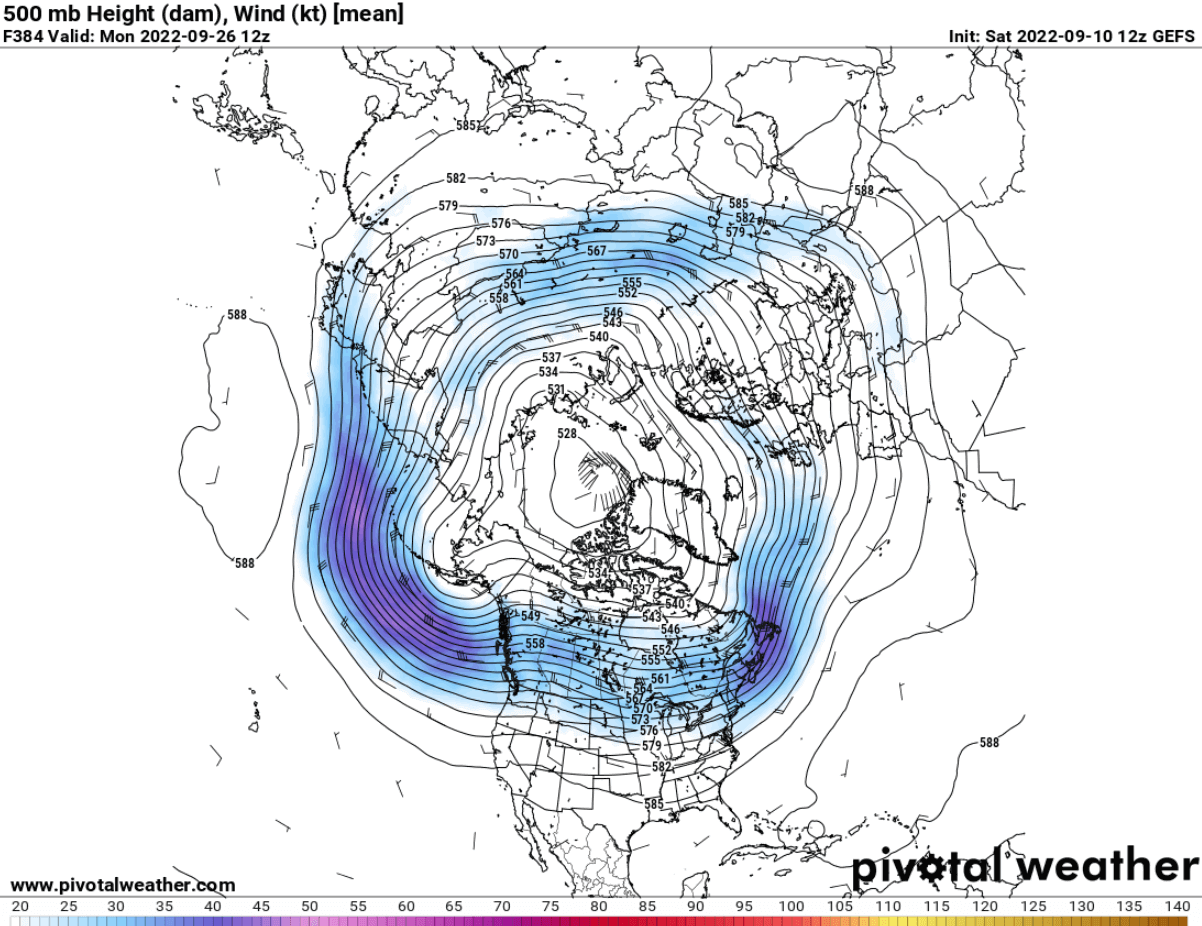
Like in the Stratosphere, lower down, we still see the polar circulation (the jet stream) edging the Polar Vortex in the lower levels.
Again, this shows that the overall weather circulation is connected on many levels and into a single system.

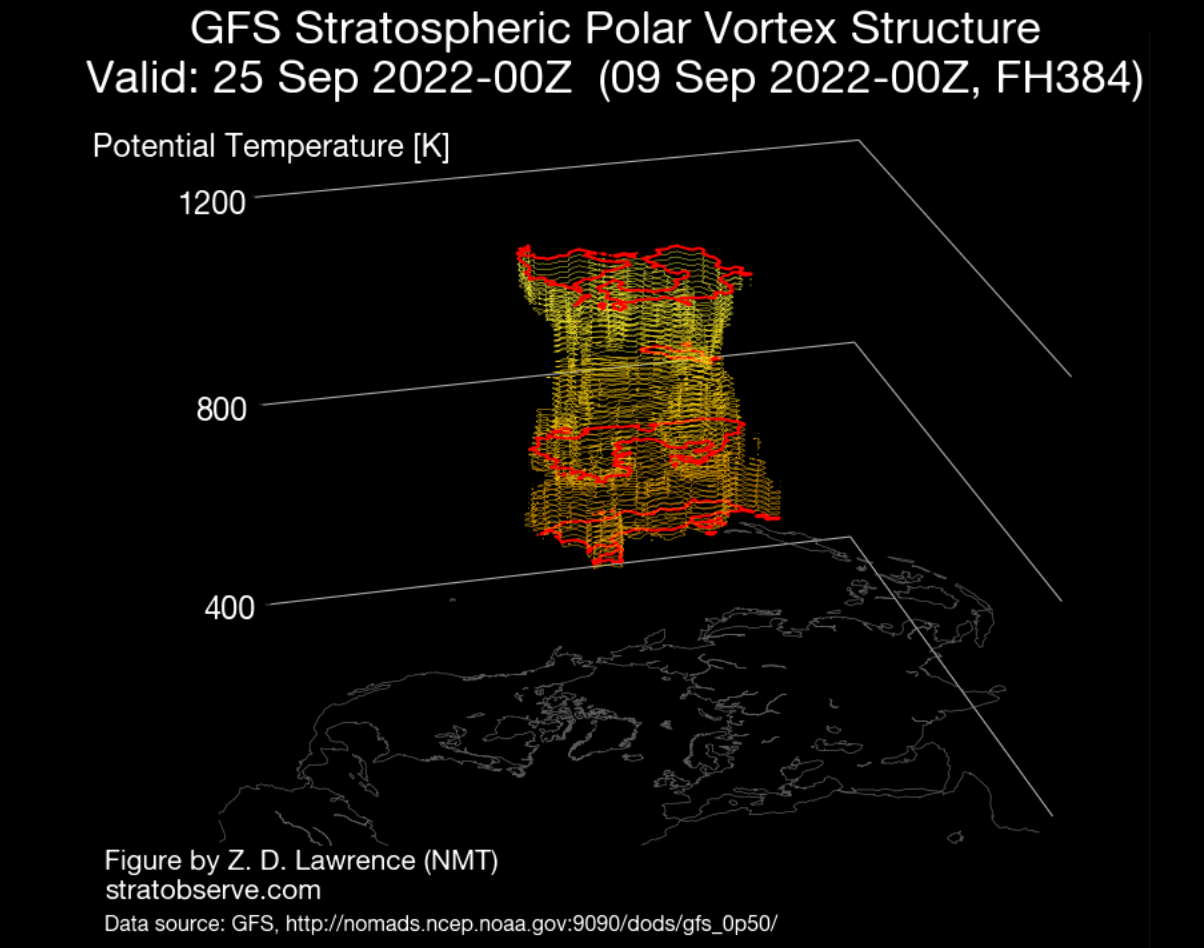
The 3-dimensional polar vortex forecast shows a good structure appearing higher up in the Stratosphere in late September.
However, you can see that it is not connected down yet, as the structure is just building while the Northern Hemisphere is cooling further.


Now we know what the Polar Vortex is and how it works.
But why do we care about it? As you will now see, the Polar Vortex has the power to do many things regarding weather, especially during Winter when it is strongest.

POLAR VORTEX AND WINTER WEATHER

As we mentioned before, a Polar Vortex can be either strong or weak (collapsed).
Each phase has its role, but we will look at both extremes, the strong and the collapse event.

A strong Polar Vortex usually means strong polar circulation.
This usually locks the colder air into the Polar regions, creating milder conditions for most of the United States and Europe.

In contrast, a weak Polar Vortex can create a weak jet stream pattern.
It has a more challenging time containing the cold air, which can now escape from the polar regions into the United States and/or Europe.


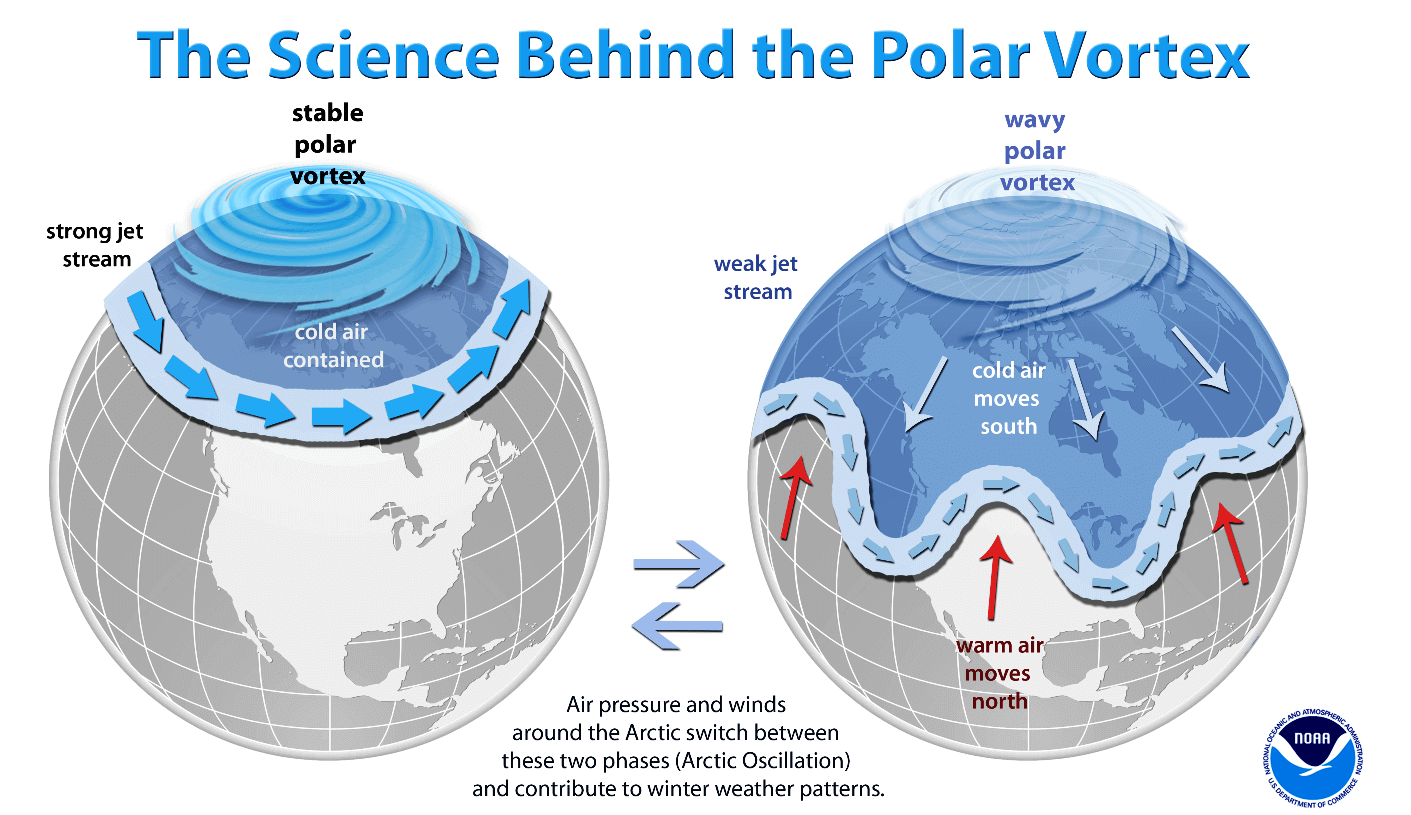
Starting with a strong Polar Vortex, it is exactly as the name suggests.
It is colder and deeper, exerting more of its influence on our everyday weather.
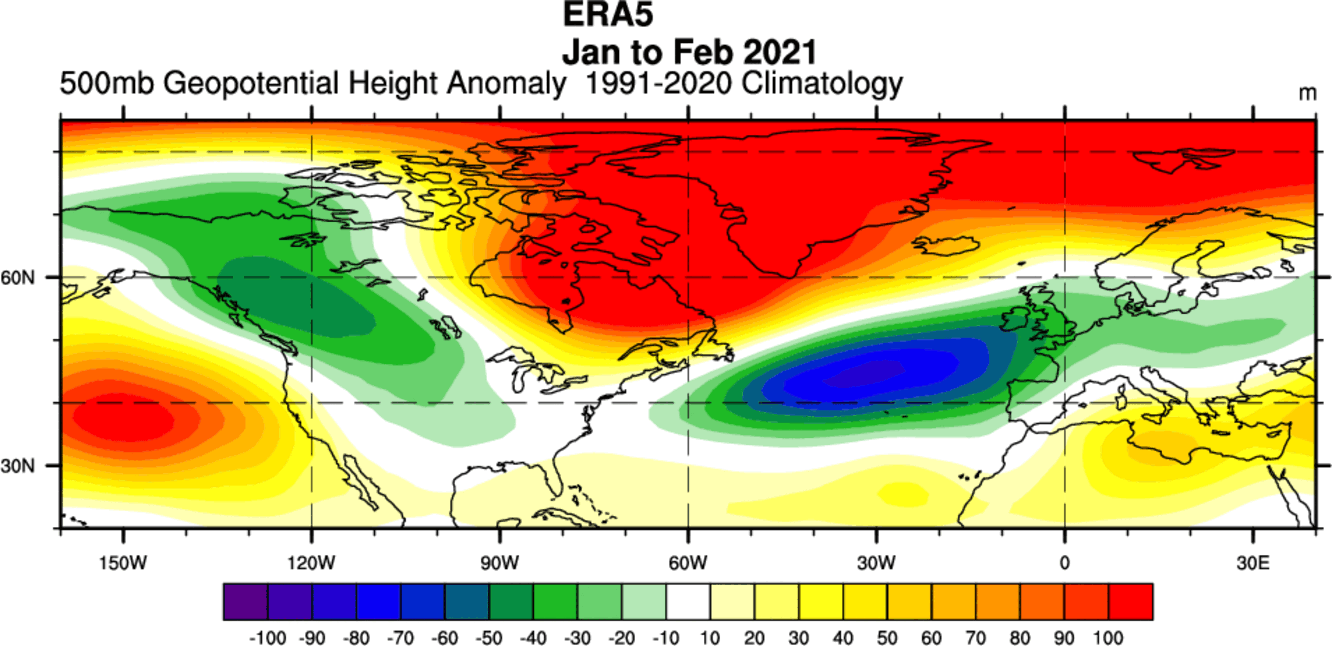
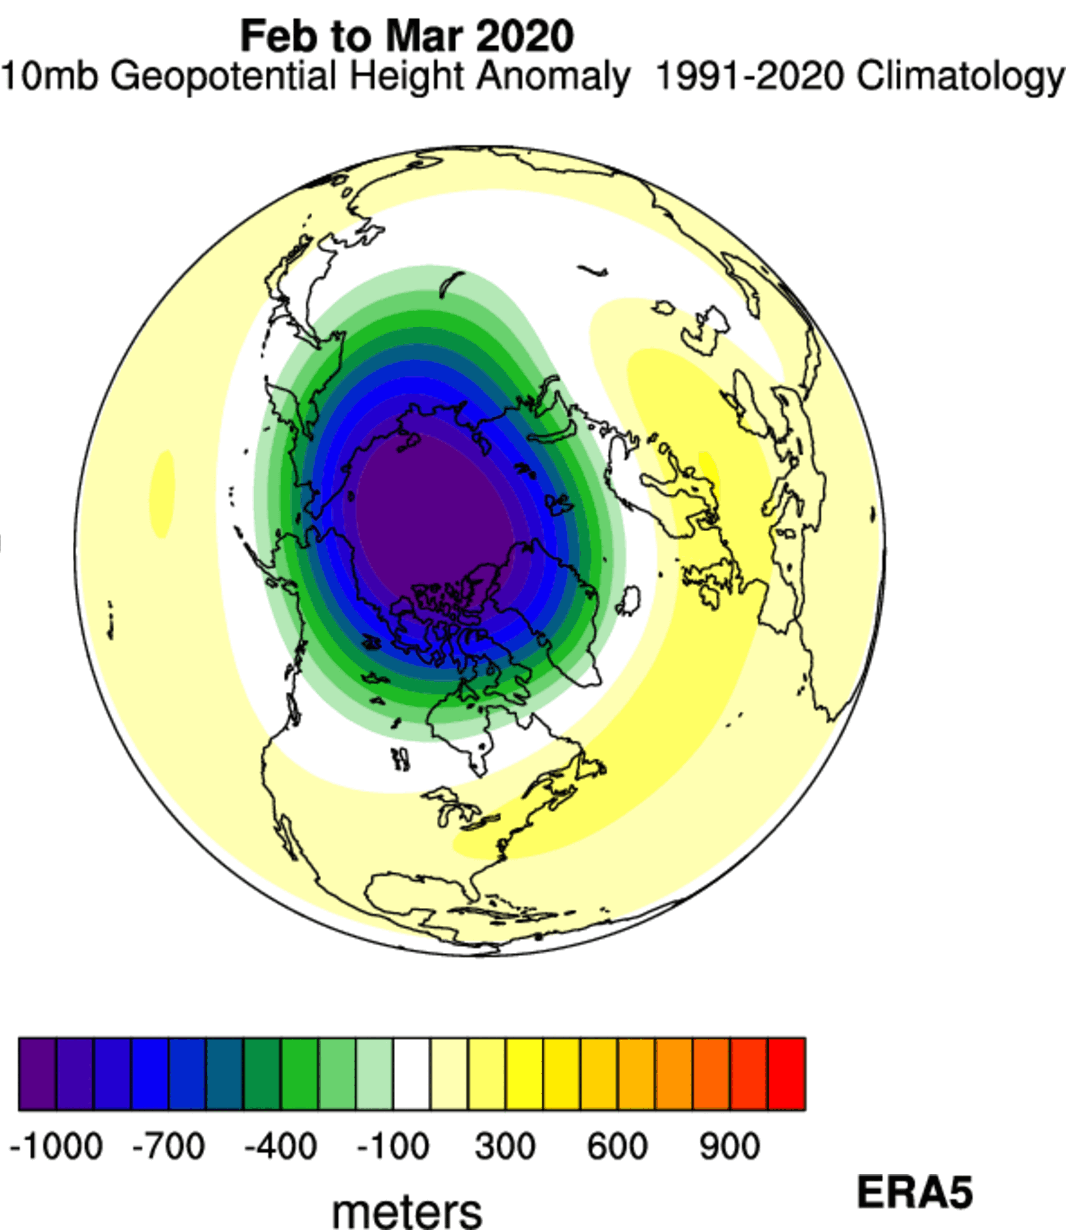
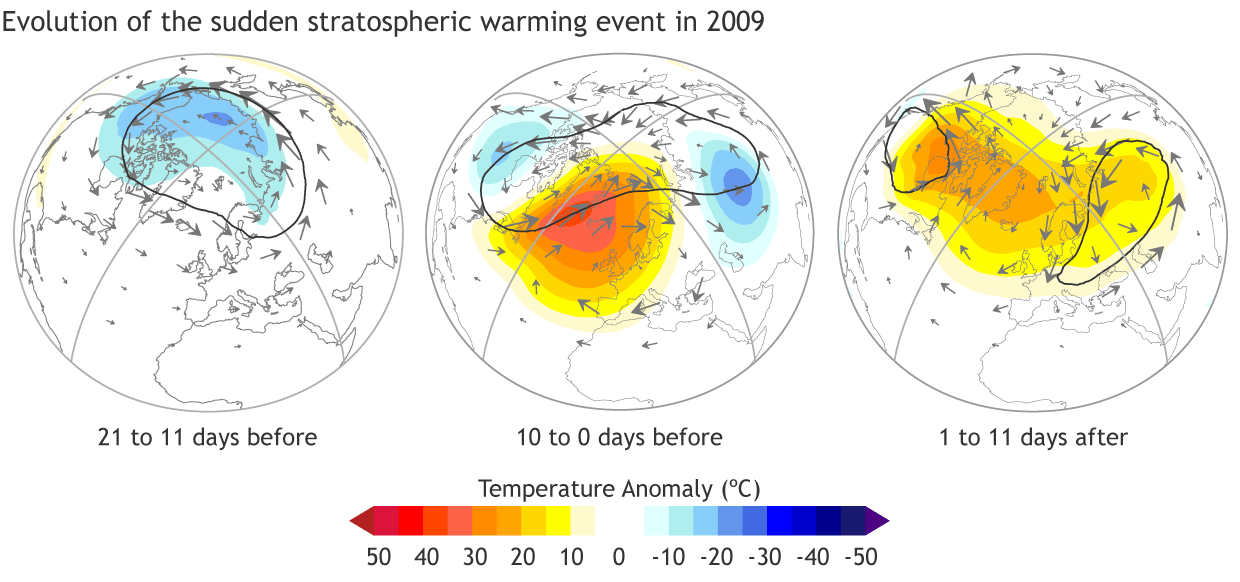
A good example occurred less than three years ago.

Below is an analysis of the Stratospheric polar vortex in February and March of 2020.
As you can see, we can see significant negative anomalies in the core of the Polar Vortex.
This means it is deeper and stronger than normal.


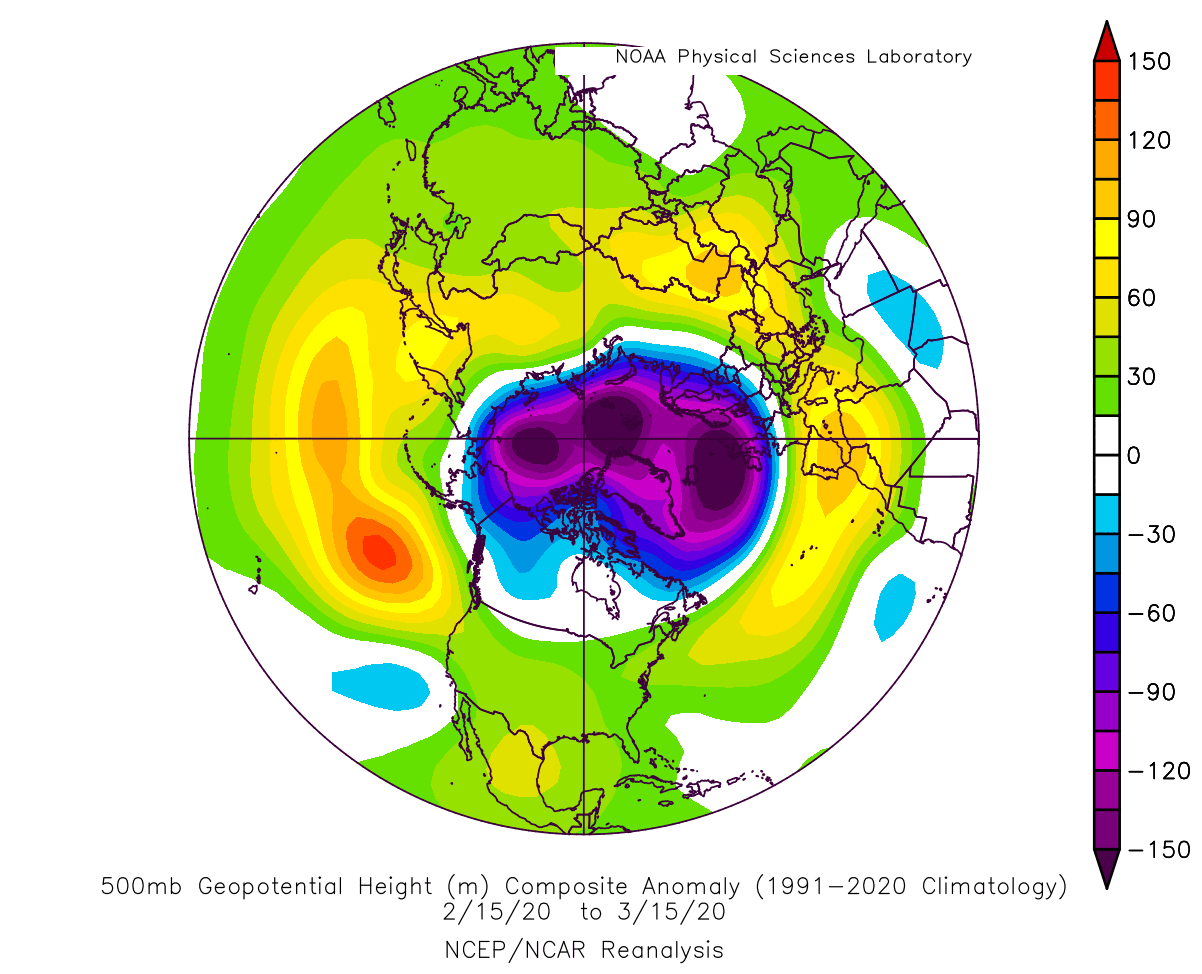
A stronger stratospheric vortex usually has an easier way of connecting down to the lower levels, changing the circulation.
We can see that if we look at the pressure anomalies in the lower levels, as seen in the image below.


You can see the lower pressure locked into the Arctic circle, surrounded by a strong circulation.
That circulation locks the cold air into the polar regions, making it harder to escape.

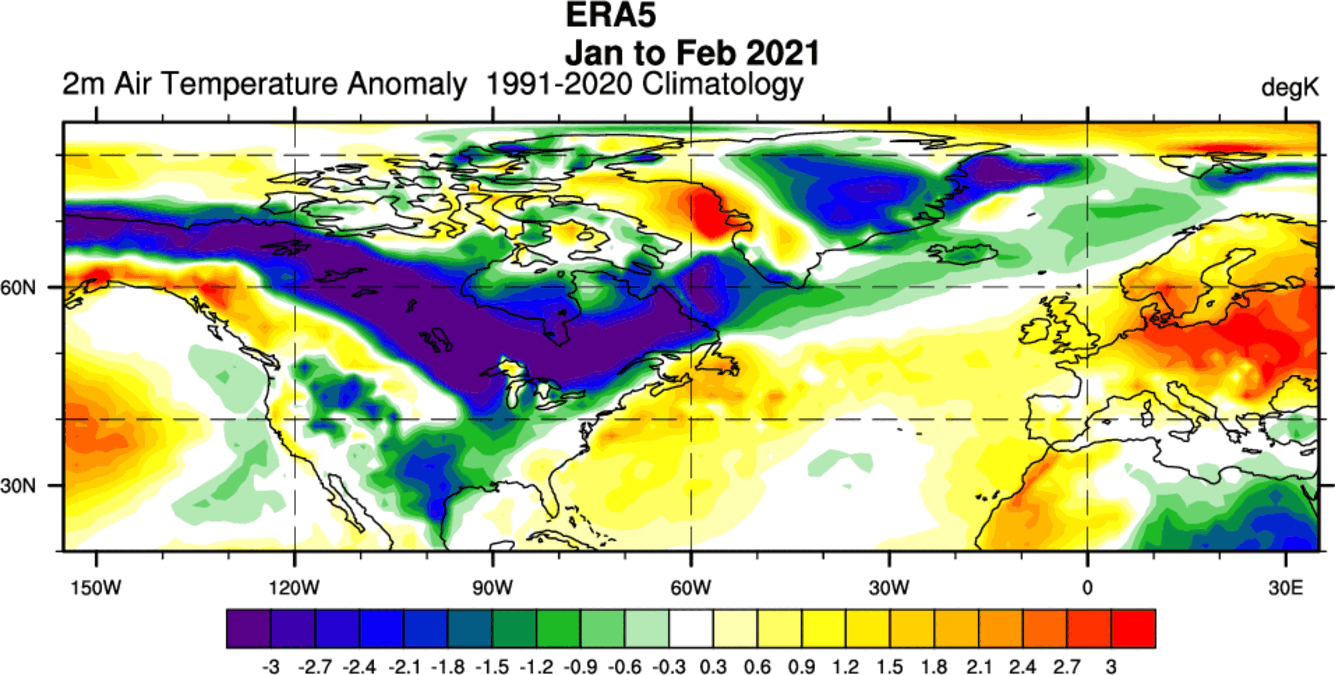
Speaking of temperatures, below we have the temperature analysis for this same period.
Again, you can see much warmer than normal late winter weather over the United States, southern Canada, and Europe.
This results from the cold air being locked further to the north.


You do not want to see this if you live in the mid-latitudes and you like your winter weather colder and served with snow.
But there is another phase, perhaps even more impactful than the strong one.

SUDDEN STRATOSPHERIC WARMING EVENT

Typically, a polar vortex weakens due to a rise in temperature and pressure in the Stratosphere.
That is called a Sudden Stratospheric Warming (SSW) event, which can collapse the Polar Vortex.

Simplified, a Sudden Stratospheric Warming event (SSW) is exactly what the name suggests.
It is a sudden temperature rise in the polar Stratosphere during Winter.
Warming of the Stratosphere means that the polar vortex is weakened and can also collapse under pressure from the warming event.

This creates a chain reaction, disrupting the jet stream, creating high pressure over the Arctic circle, and releasing the cold arctic air into Europe and the United States.
An SSW event is usually triggered by specific massive pressure patterns in the troposphere, which can send a lot of energy upwards vertically into the Stratosphere.


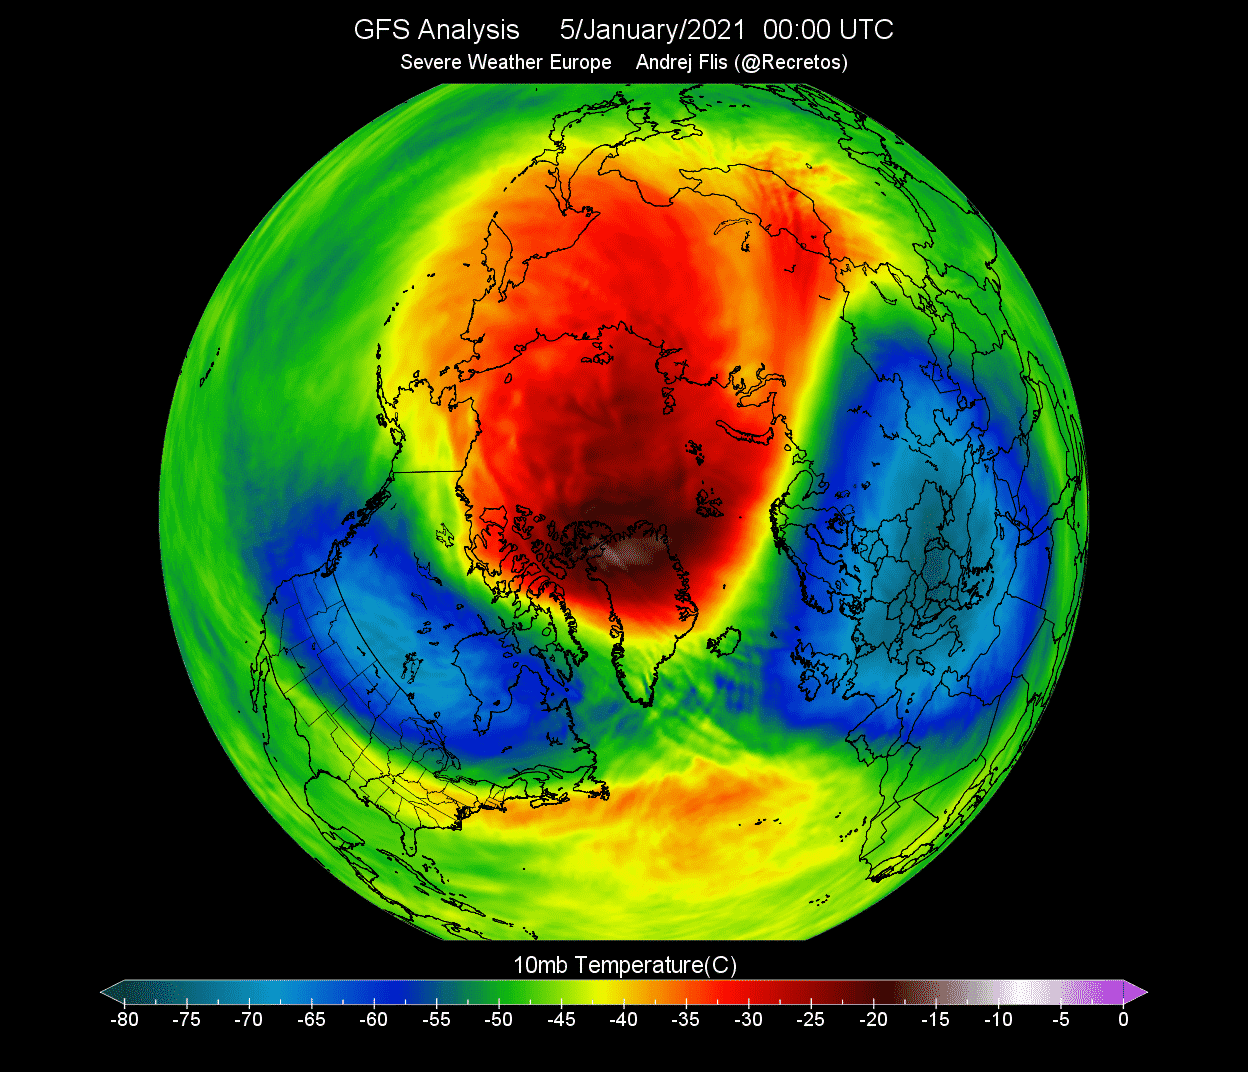
One such event occurred on January 2021.
On January 5th, the preliminary date of the Sudden Stratospheric Warming event was marked, as the winds around the polar circle have reversed.

The stratospheric warming wave has crawled over the entire North Pole in the Stratosphere, effectively splitting the cold core of the polar vortex into two parts.


One part of the broken polar vortex has moved over North America and one over the European sector.
At this point, this does not influence the winter weather on the surface so much.
This is because it occurs at over 30km (18 miles) altitude.
But the weather influence followed quite soon after.

Looking at the NASA temperature analysis for the polar Stratosphere, we can see a significant temperature spike at the 10mb (30km) level in early 2021.
This shows a strong warming event, with temperatures staying above normal for weeks after.


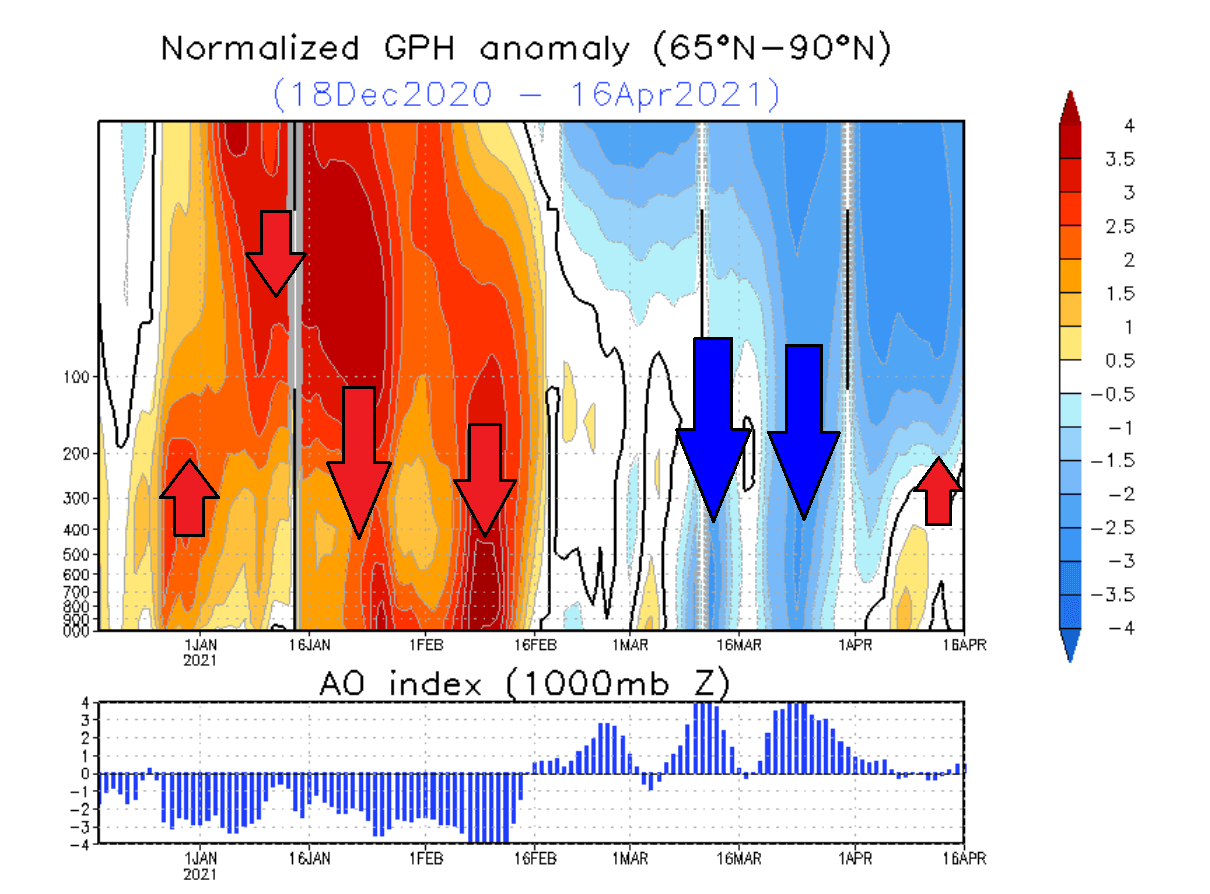
When trying to find a connection between the Stratosphere and our winter weather, it helps to have more specialized images at hand.
The image below shows an atmospheric pressure index.
Negative values indicate lower pressure (blue colors), and positive values indicate higher pressure (red colors).
We have altitude from the ground up to the top of the stratosphere (~46km/28mi) for the Winter/Spring 2021 period.


In early January, strong positive values in the Stratosphere are associated with the higher pressure buildup during the stratospheric warming event.
The event and its influence slowly descended over time, reaching the lower levels by mid and late January.

This persisted well into February, influencing the weather patterns even when the stratospheric warming was already over.

We produced an analysis image of the January-February 2021 winter period, showing pressure and temperature anomalies.
The image below shows the pressure anomalies, where a strong high-pressure system dominates the North Pole.
This dominant high-pressure system originated from the stratospheric warming event and the polar vortex collapse.


A strong high-pressure system over the Arctic can heavily disrupt the weather circulation and can unlock the cold air from the Arctic regions towards the mid-latitudes.

The image below shows the temperature anomalies in January-February 2021 period.
Warmer than normal temperatures were present under the high-pressure system over the polar regions.
SSW pushed cold Arctic air out into Canada and most parts of the United States.


The weather after a Polar Vortex collapse event is not always the same.
A lot depends on the pre-existing weather patterns, as in some cases, the effect of stratospheric warming can be “deflected” or doesn’t mix into the lower parts very well.

We get an interesting picture if we combine all Stratospheric Warming events and look at the weather 0-30 days following the stratospheric warming events.

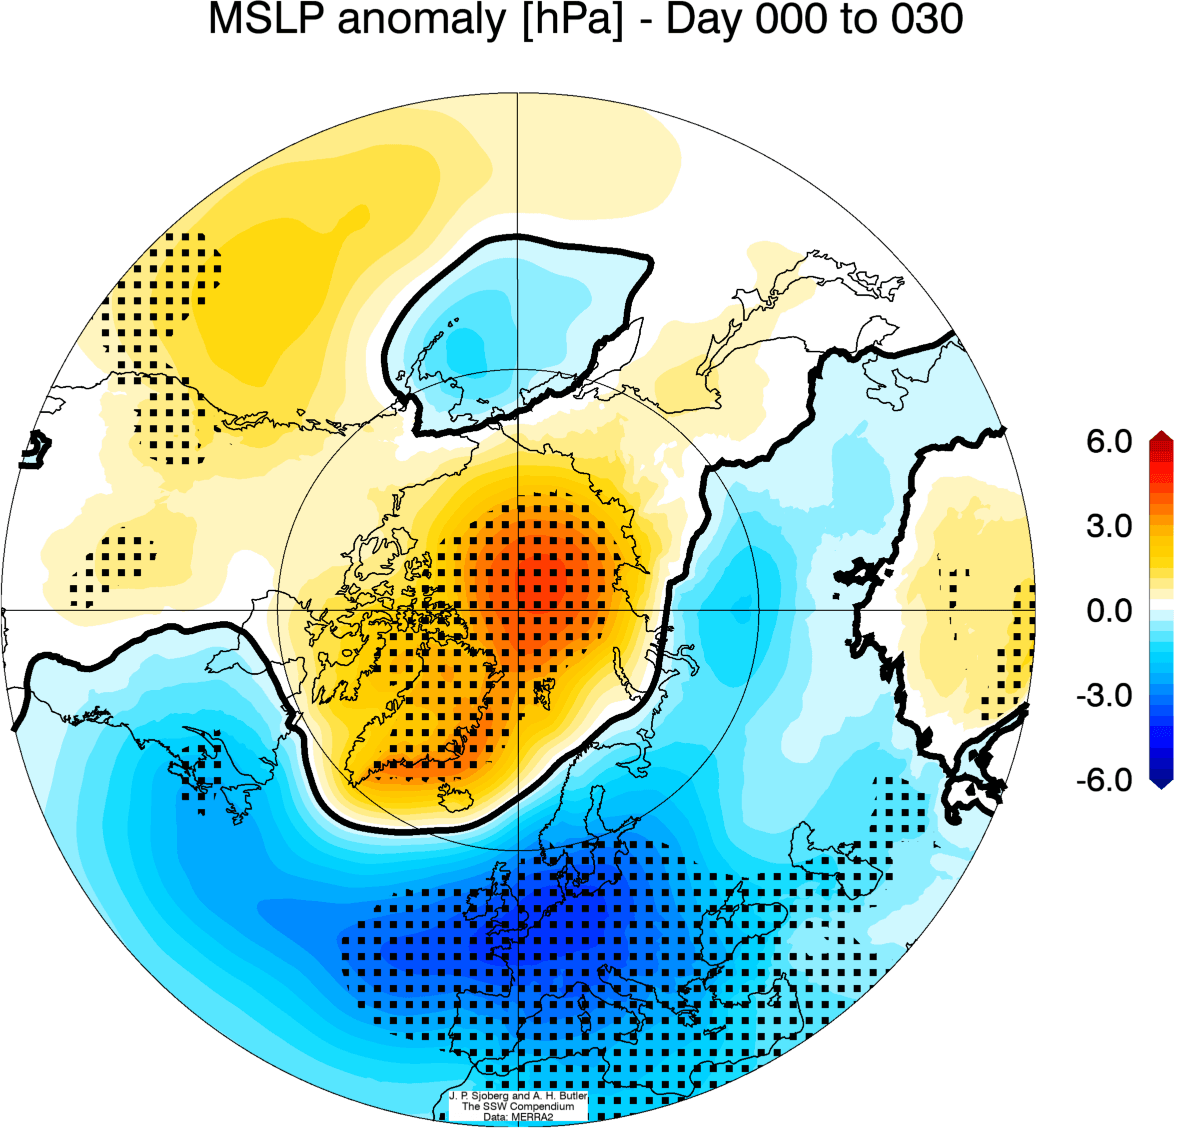
WINTER WEATHER AFTER A POLAR VORTEX COLLAPSE

Below is the average pressure anomaly after a stratospheric warming event.
It corresponds to a negative NAO pattern.
This heavily disrupted circulation pattern helps to create a free path for colder polar air to move out of the polar regions.


The corresponding average temperature 0-30 days after an SSW event shows that most of the United States are trending colder than normal, as is Europe.
Note: this is an average picture of many SSW events.
Each individual stratospheric warming event is different and does not automatically mean a strong winter pattern.


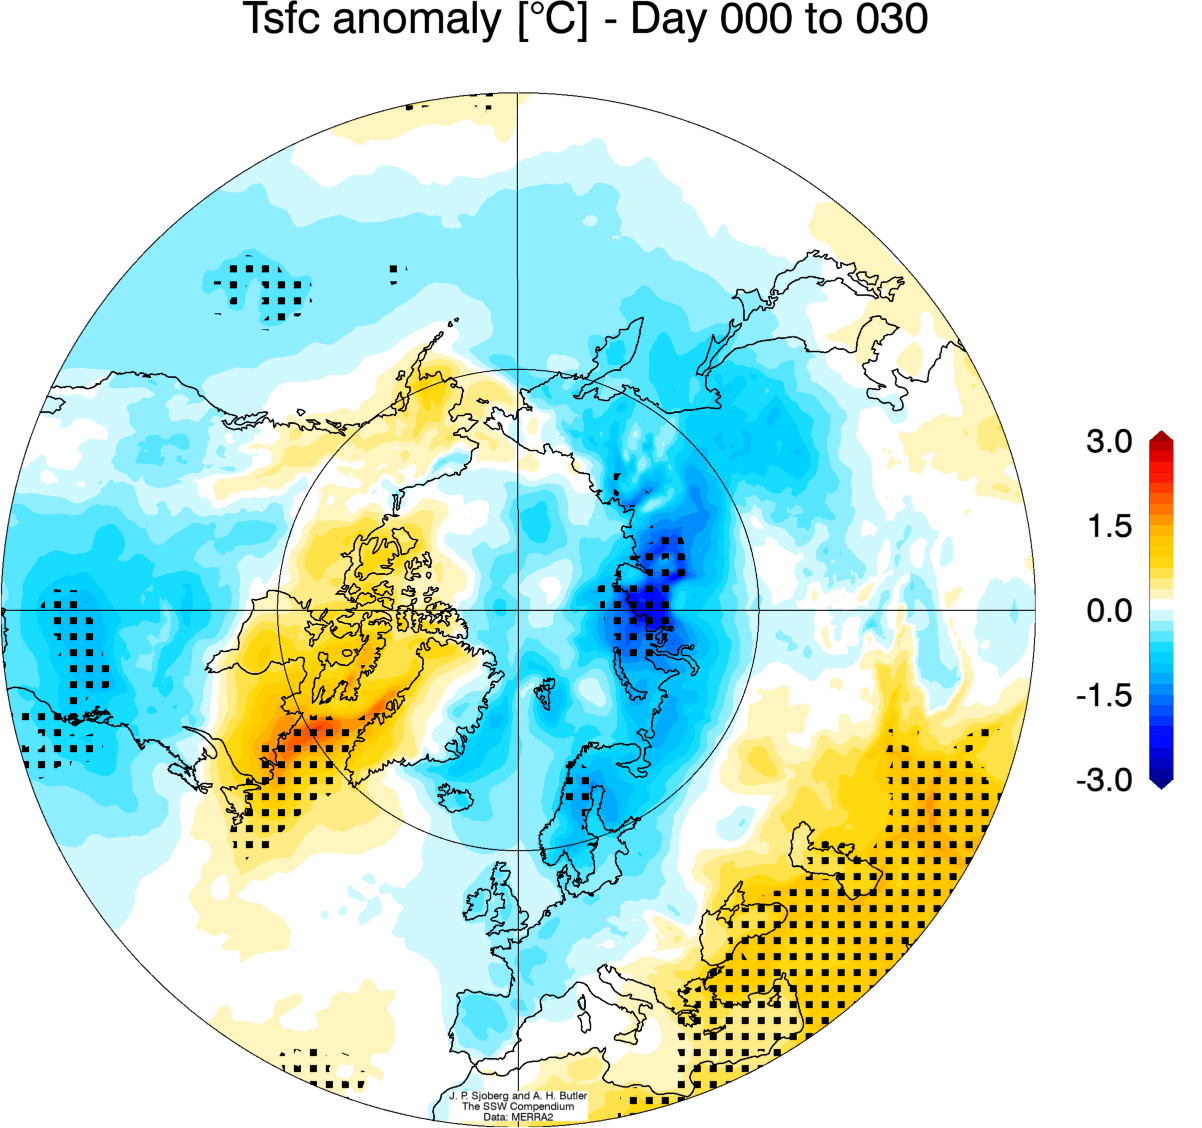
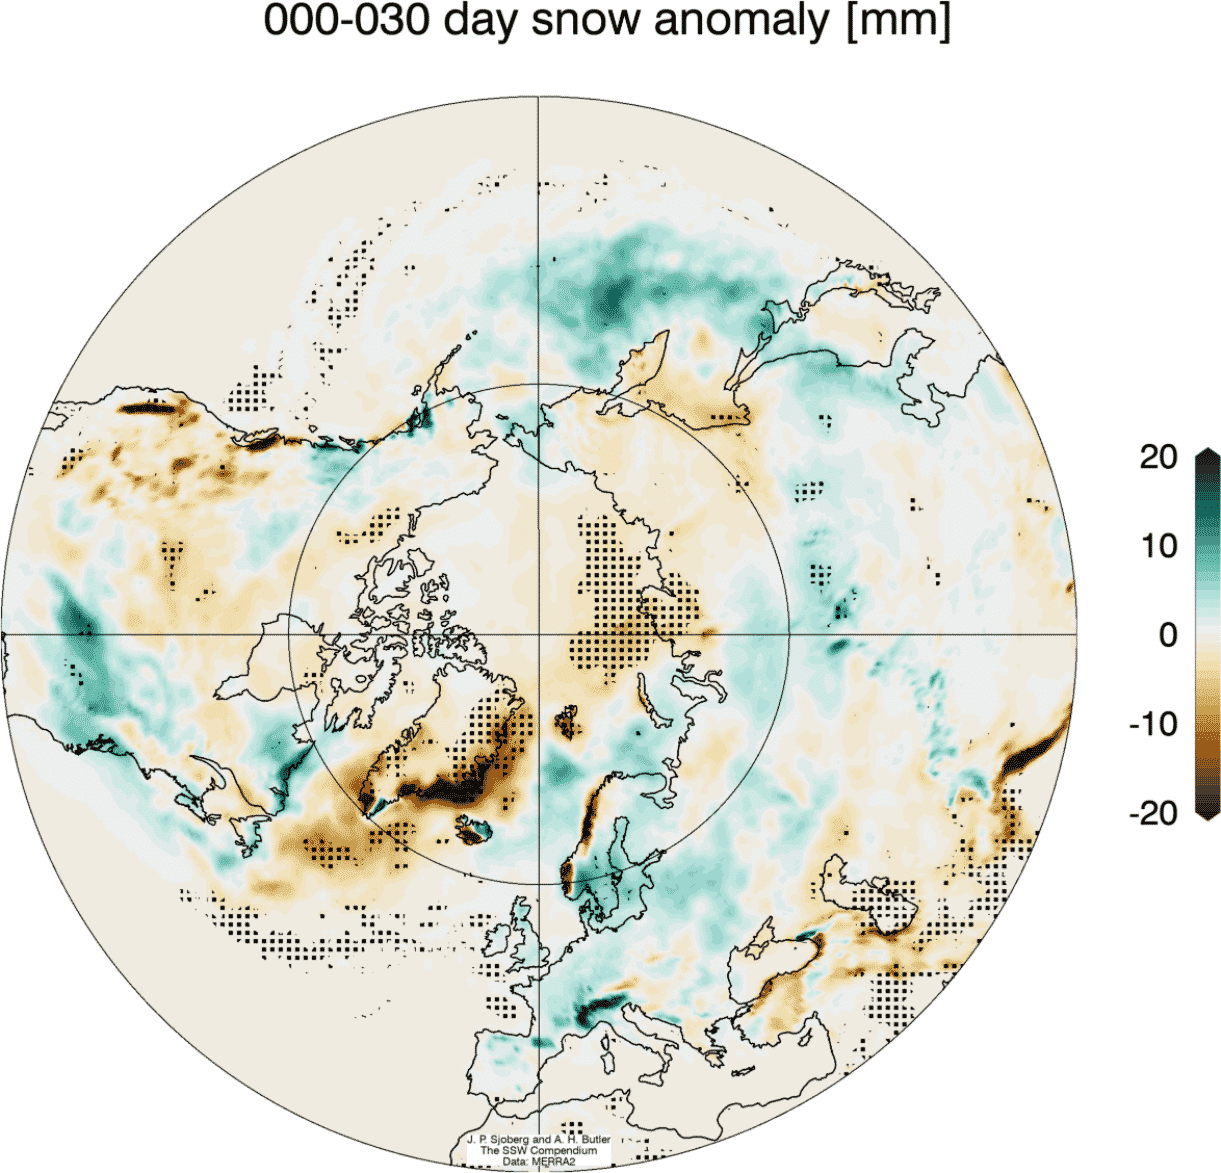
Looking at snowfall, we can see above-average snowfall over much of the eastern United States and also Europe.
This is an expected response, as typically, after major stratospheric warming, the colder air has an easier path towards the south and into these regions.


So as you can see, having a strong or weak Polar Vortex can significantly change Winter weather over the United States, Canada, and Europe.
However, it does not happen yearly, as it depends on many other factors.

So what is the early outlook for the Polar Vortex and winter weather in the upcoming 2022/2023 season?

POLAR VORTEX AND WINTER 2022/2023

We have discussed the La Nina phase of the ENSO and its influence in our first Winter forecast, so check it out for more details on the La Nina and the ENSO cycle.
We will link it at the bottom of the article.

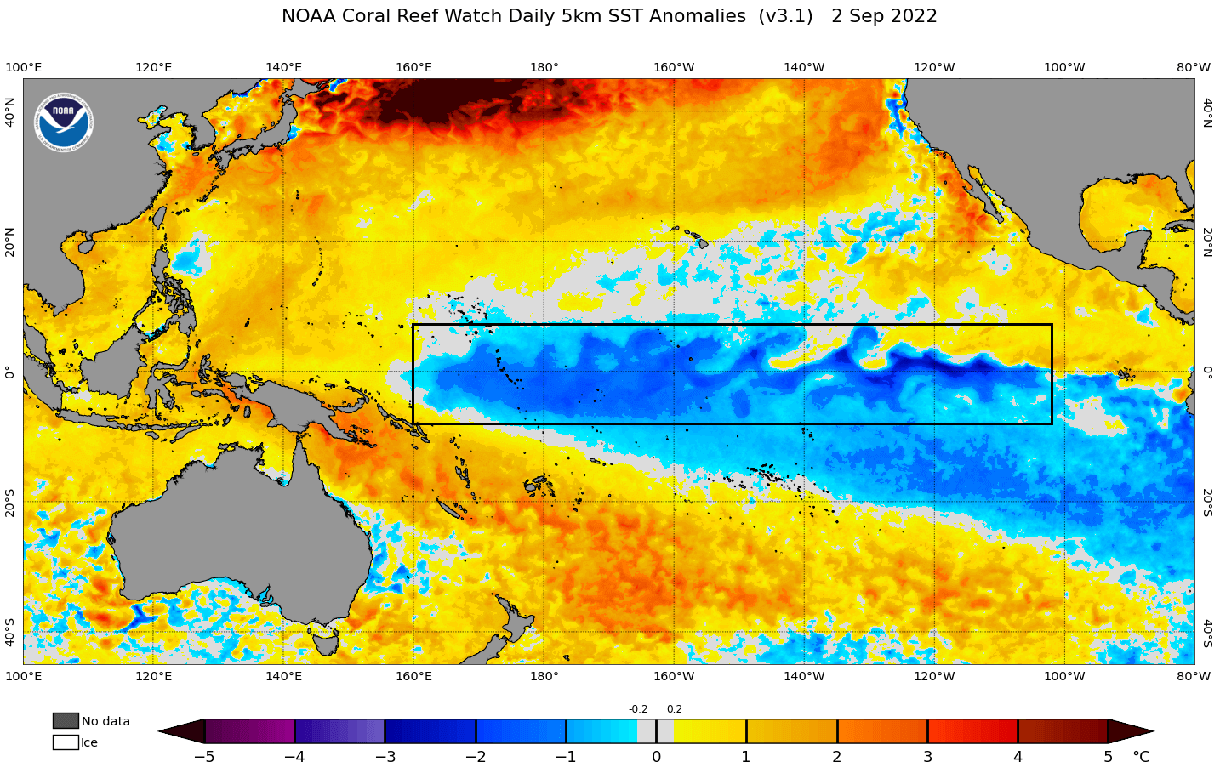
To keep it simple, La Nina is what we call the cold/negative anomalies in the tropical Pacific Ocean.
It forms under certain conditions and can change the weather globally on a seasonal scale.

You can see the La Nina in the image below.
We know what an effect La Nina might make on global circulation, and thus we can anticipate what it might mean for the Polar Vortex.


Historically, a La Nina winter has around a 60-75% chance of producing a stratospheric warming event.
It has produced them in the past and also in the last Winter.
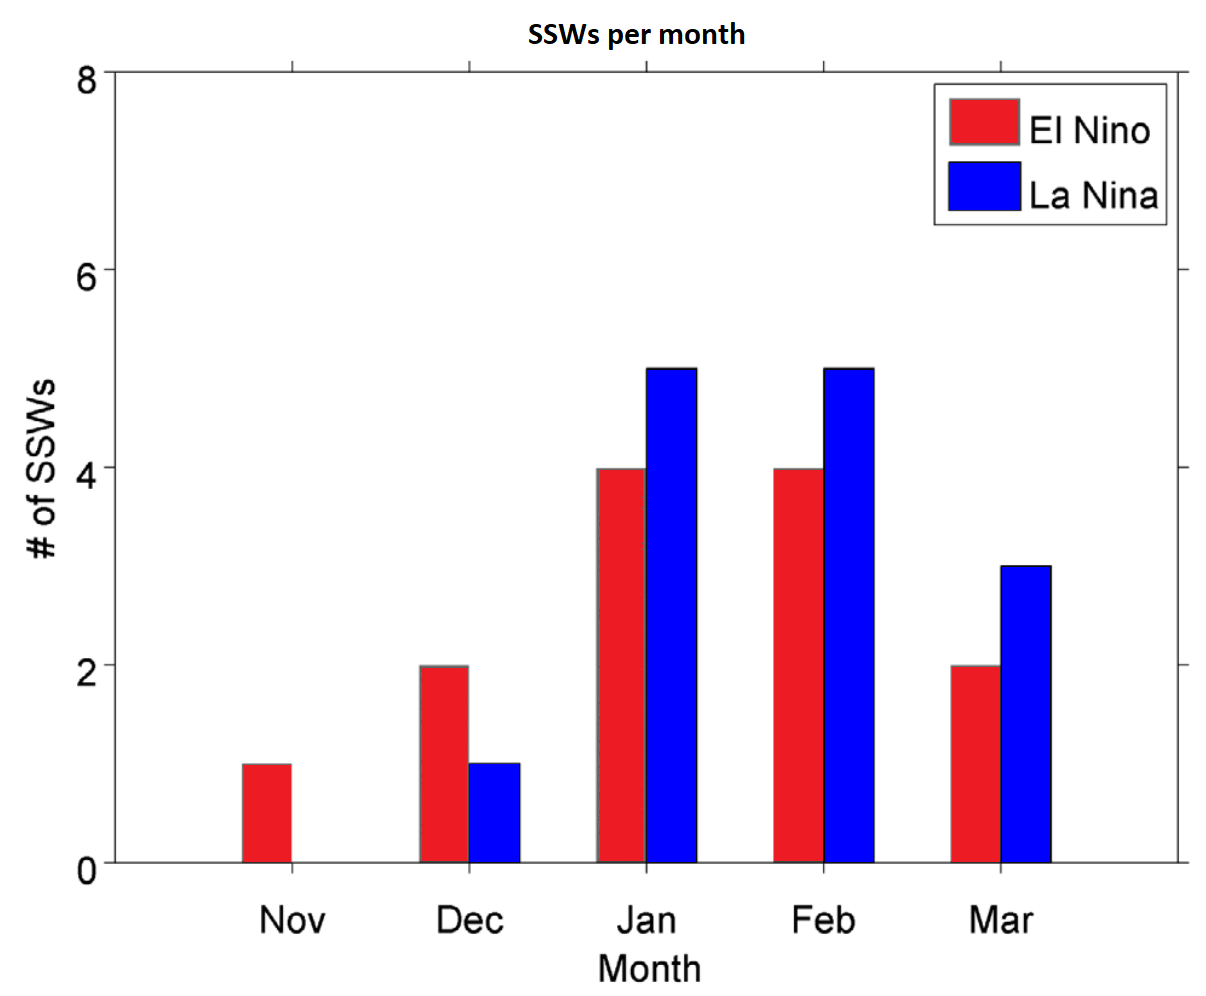
The image below shows the typical Sudden Stratospheric Warming event frequency by month and by the ENSO event.


As you can see, a La Nina phase has a higher chance of producing a Polar Vortex collapse event.
It also produces one later in Winter, compared to an El Nino.

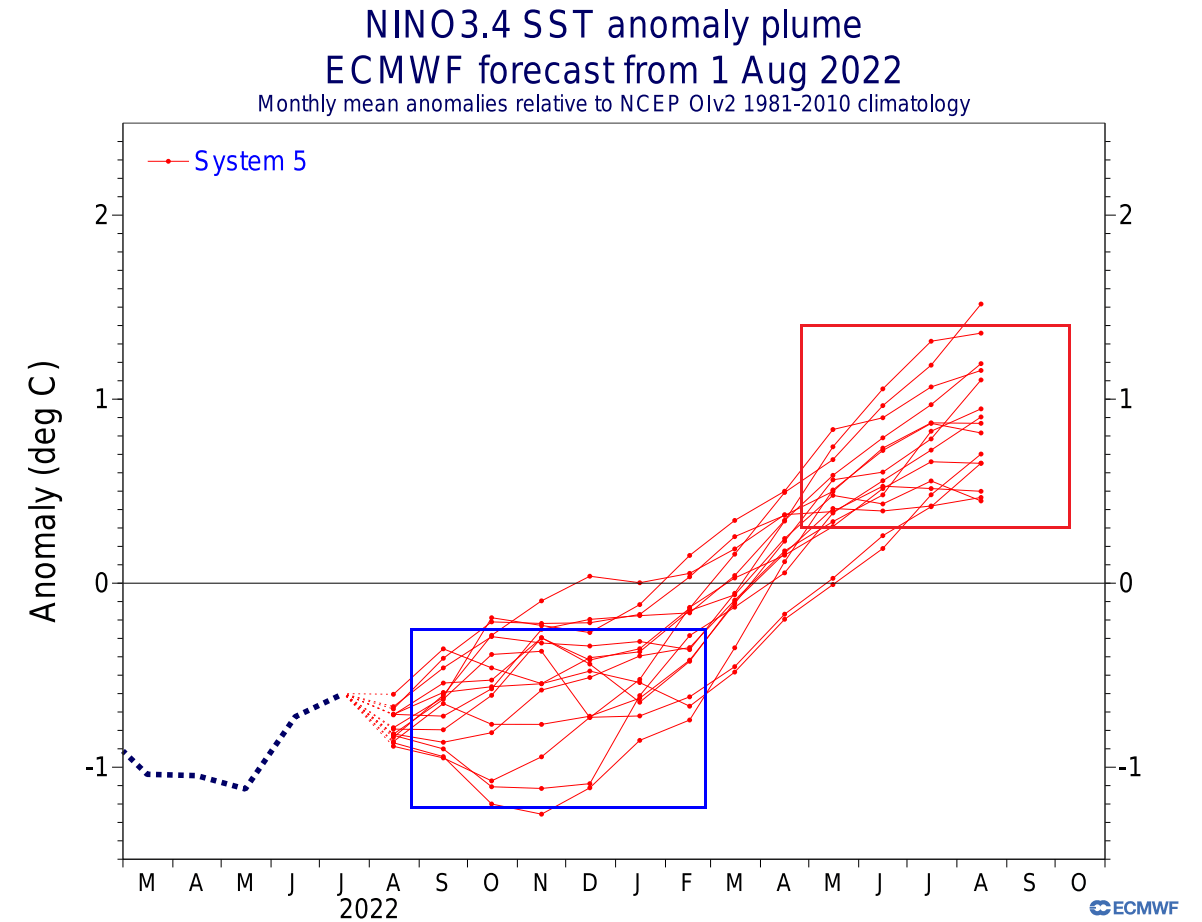
Below we have an analysis/forecast graphic by ECMWF, which shows the long-range forecast of the main ENSO region.
The La Nina conditions will prevail over the Fall and Winter.
But a weakening of the La Nina is expected for early next year, with an El Nino possible for later in 2023.


Current signals show an increased potential for a stratospheric warming event in mid-winter, based on an active La Nina.
But a lot depends on positioning the massive high and low-pressure systems in the North Pacific.

This is where other short-term factors also come into play, like weekly weather variability, tropical convection, other ocean temperature anomalies, etc.

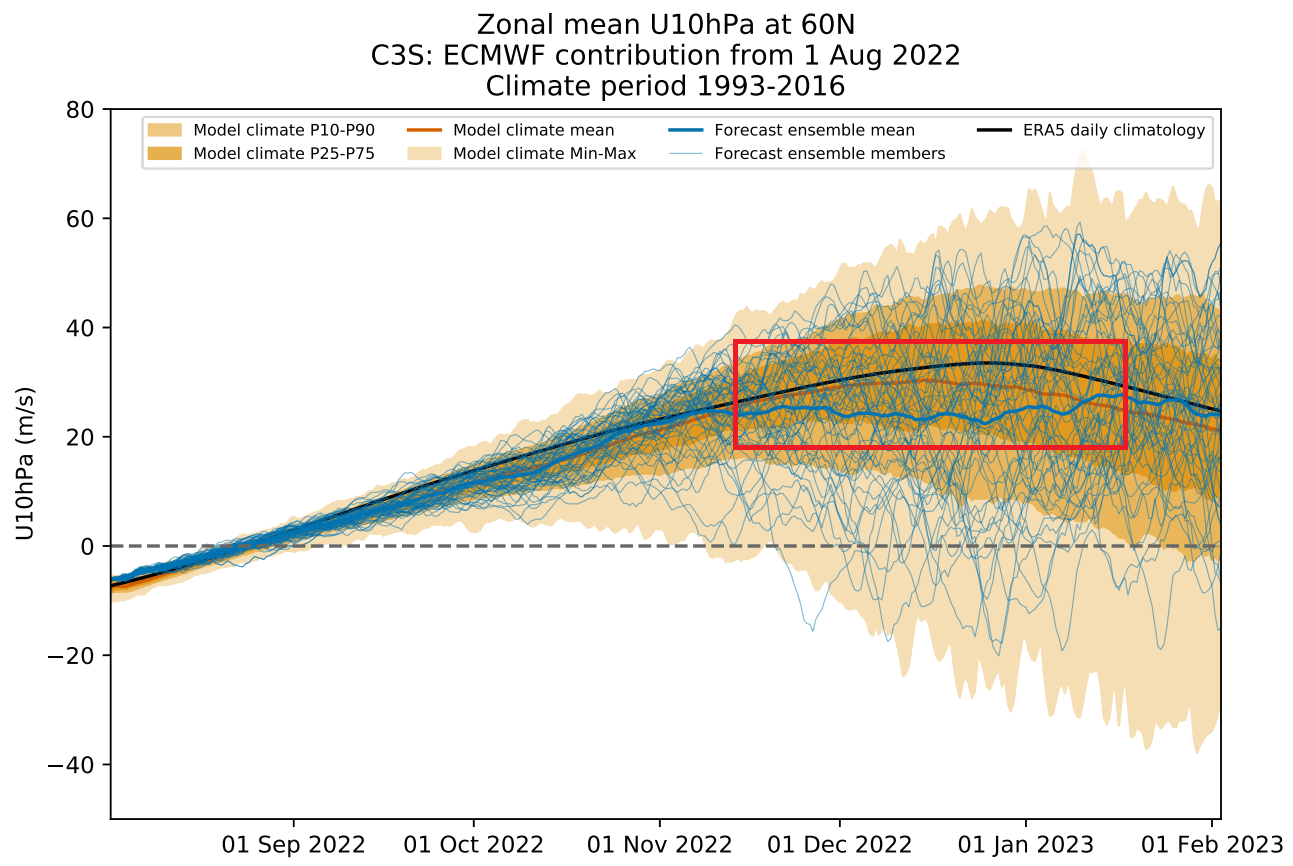
We have an interesting picture now of the forecast for the upcoming seasons.
The ECMWF forecast for the 10mb stratospheric zonal winds shows a reduction in the power of the stratospheric winds in late Fall and early Winter.


As winds are directly related to the strength of the Polar Vortex, we can see this as a signal for a weakening of the Polar Vortex.
This would imply a more disrupted pattern and a chance of high-latitude blocking, thus more cold air in the United States and Europe.

It gives us a signal to keep an eye on, as these dynamics can have a large-scale and long-lasting impact on the weather pattern during Winter.
 
Links :

Tuesday, September 13, 2022

Several “islands” recorded as the northernmost on Earth are probably only icebergs


This new and until-then-unrecorded island lookalike, now believed to be an iceberg covered with gravel, was discovered during the Leister Go North 2022 expedition.
(Martin Nissen / Danish Agency for Data Supply and Infrastructure) 

From Arctic Today by Martin Breum

New "islands" recorded north of Greenland since 1978 are simply icebergs partly or fully covered by gravel and temporarily stranded on the seabed, according to new research.
They'll likely disappear again in the future.

For years, a heated international debate has been ongoing among explorers, scientists, island-hunters and other interested parties about which is indeed the northernmost island on Earth.

Since 1978, what has appeared to be a mushrooming family of smaller islands north of Greenland has fueled the discussion as still new members of the family were spotted.
At least seven of these phenomena have been recorded and celebrated by visiting explorers, adventurers and scientists.

In the summer of 2021, five members of a Swiss-Danish science expedition, including this reporter, landed in a helicopter on yet another and until then undiscovered ice-and-gravel phenomenon about two kilometers north of the Greenland mainland.

When we returned home and as our aerial photography was studied more closely, the muddy but sturdy structure turned out to be about 80 by 30 meters, rising to about two meters above sea level.
We came to believe it was indeed at the time the northernmost island in the world — or at least some sort of almost-island located in this very special geographical spot.

Several passing expeditions, explorers and scientists have recorded the structures in the shallow waters north of Greenland as islands.
New findings say that they are not; these are icebergs partly or fully covered with gravel and only temporarily stuck on the seabed.
When they melt, they will disappear again.
(Martin Nissen / Danish Agency for Data Supply and Infrastructure) 

What are they?

Now, a year later and following a new expedition counting Swiss and Danish scientists as well as two experts reporting to the Danish authorities, the issue of the small and poorly understood island-like structures has possibly been settled once and for all.

“For many years we all thought that storms from the north pushed sea ice from the Arctic Ocean towards Greenland, where the ice then forced sediments from the seabed towards the surface, so that these new islands were formed, but that is not the case,“ Rene Forsberg, a professor of physical geodesy with DTU Space at the Technical University of Denmark, told me at his office in Copenhagen.

Rene Forsberg and Martin Nissen, a geographer from the Danish Agency for Data Supply and Infrastructure, camped for two weeks with the Leister Go North 2022 expedition at Kap Morris Jesup, Greenland’s northernmost point.
The expedition, like the Leister Around North Greenland Expedition in 2021, were funded by the Leister Foundation in Switzerland.

 
A rock measuring about 1 by 1 meter on the top of the “island” discovered in 2021.
According to Rene Forsberg of the Technical University of Denmark, this is probably not sediment from the seabed, but part of the luggage carried first by a glacier and then an iceberg from Greenland’s interior into the sea.
(Rene Forsberg) 

New surveys

Martin Nissen and Rene Forsberg joined the expedition this year to survey the structures in the waters north of Greenland for the authorities in Copenhagen.
While Greenland — the world’s largest island — enjoys a large degree of political autonomy, the mapping of Greenland is still a responsibility of the government in Denmark.

During the two weeks of surveying, GPS mapping and lidar (or laser) mapping from a helicopter was carried out alongside bathymetric measurements both in the waters close to the disputed island-structure and also close to a new and previously unmapped member of the family.
Some of the island-structures that were recorded years ago have disappeared and were therefore, of course, not subject to any measurement.

 
The icebergs long believed to be islands north of Greenland most likely stem from glaciers like this at Kap Christian IV, some 50 kilometers west of Kap Morris Jesup, Greenland’s northernmost tip.
(Rene Forsberg)


A peer-reviewed scientific rendering of the collected data will be published in the future, but a preliminary conclusion has been put into a press release.

“The new bathymetry observations confirmed all the ‘islands’ to be located at water depths in the range of 25-45 m, which uniquely confirmed all ‘islands’ to be grounded icebergs, with an usual cover of glacial soil, pebbles and rock debris, forming a new category of semi-stationary ice islands,” the press release reads.

In other words, and according to these new findings, all the structures recorded since 1978 are not islands in any classical sense of the word, but simply icebergs partly or fully covered by gravel and temporarily stranded on the seabed in the shallows north of Greenland.

Drilling for depth

Forsberg and Nissen also measured the water depth right next to the island-like structure that was discovered in the summer of 2021 during the Leister Around North Greenland expedition.

“We drilled through three meters of ice on both sides of your ‘island,’ and concluded with the help of ordinary echo sounders that the water is about 27 meters deep in this particular spot. When we drilled, we stood on the frozen sea 27 meters above the seabed. We concluded that the gravel on top of the iceberg — which you took for an island — presently lies 29 meters above the seabed,” Forsberg told me.

“We also determined that about nine-tenths of the iceberg lies under water, just like icebergs usually do.
It is stuck on the seabed. Only when it melts sufficiently will it travel onwards,” he said.
According to Forsberg, the new measurements correlate lidar measurements of the iceberg done earlier this year as Forsberg passed overhead in a fixed-wing plane.

Moving east

The gravel-covered structures north of Greenland — icebergs, ice-islands or ghost-islands, as you like — are potentially short-lived, but nobody knows exactly when they will disappear again.

The icebergs have most likely broken off from glaciers on Greenland’s mainland to the west of Greenland’s northernmost point, Kap Morris Jesup.
These glaciers, like dozens of other glaciers in Greenland, carry with them gravel from Greenland’s interior.
After breaking off into the sea from the calving glaciers, the icebergs drifted eastward.
Those still visible are now temporarily stranded in the relatively shallow waters just north of Cape Morris Jesup and new ones will continue to appear.

Holes were drilled in the ice three meters thick next to one of the ghost-islands north of Greenland.
Echo sounders were guided through the holes so that water depths could be determined.
(Martin Nissen / Danish Agency for Data Supply and Infrastructure)


“We don’t know when they will disappear again.
But we now know that the northernmost island in the world is still Kaffeklubben Ø or Coffee Club Island. That is the northernmost land point on Earth, closest to the North Pole,” Forsberg told me, pointing at Coffee Club Island, or Inuit Qeqertaat in Greenlandic, on his digital map.

Localization with the GeoGarage platform (DGA nautical raster map)
 
Inuit Qeqertaat lies somewhat closer to shore than the disputed icebergs.
The small, roundish and storm-scarred island, some 30 meters high at the top, lies at 83°39’55” North, 30°37’45”West.
It was named Kaffeklubben Ø by Danish explorer Lauge Koch in 1921, but was likely seen already by U.S. explorer Robert E. Peary during an expedition in 1900.

The Danish Agency for Data Supply and Infrastructure is currently mapping all ice-free land in Greenland in an exercise that also involves U.S. satellites, the U.S. National Geospatial-Intelligence Agency, the Danish defense forces and Greenland’s Self Rule Authority.
The ice-free parts of Greenland’s landmass cover an area roughly the size of Norway; Greenland’s inland ice sheet is not included.

In 1978, as the first of the stranded icebergs was discovered, it was named Oodaaq Island after a famous Greenlandic dog handler.
For years, Oodaaq Island, which lies a bit north of Inuit Qeqertaat, was talked about as the northernmost island in the world and added to formal Danish maps of Greenland.
Now, as Oodaaq Island changes in status from island to iceberg, it will be scrapped from the maps again.
“Oodaaq Island will not appear on the maps when we publish our new maps of Greenland, most likely later this year,” Martin Nissen told me.

Links :

Monday, September 12, 2022

How do boaters avoid hazards? What to know about markers, buoys and other warning signs

View of channel marker #15 in the Intracoastal, site of a deadly boat crash on Sept. 4.

From Miami Herald by Michelle Marchante

Just like traffic lights and signs help drivers on the road, boaters have buoys and signs to guide them to and from shore safely.

What you’ll see out on the water depends on where you boat. In the United States, the majority of American waterways use the U.S. Aids to Navigation System or IALA-B, although the Intracoastal Waterway has its own system.

Buoys, beacons and channel markers serve as the traffic signals of the water.

They can provide directions or alert boaters if they need to slow down, or if there are hazards in the area such as sand bars.

Some of these navigational markers may be green or have green lights, while others may be red or have red lights.

Over Labor Day weekend, the driver of a boat crashed into a channel marker off the Florida Keys killing a high school senior and throwing all 14 people aboard into the water.

Here are some of the safety markers you might see in South Florida waters:

These are some of the navigational aids boaters will see in the water. Screenshot of U.S. Coast Guard U.S. Aids to Navigation System handbook 

Red, Right, Returning

If you’re traveling by boat, you’ll see navigational aids that mark junctions, forks or splits in the channel, as well as where the boat should travel to safely pass.
The following information is commonly referred to as “Red, Right, Returning.”

“Green colors and lights should be on your right (starboard) side when traveling toward open waters (seaward)“ and will always use odd numbers, according to the U.S. Coast Guard’s “U.S. Aids to Navigation System” guidebook .
The numbers should decrease as you head to the open water.

“Red colors and lights should be on your right (starboard) side when traveling from open waters (shoreward),” and will always use even numbers, the guidebook states.
The numbers should increase as you head to land.
 
Green navigational aids will always have odd numbers and red navigational aids will always have even numbers.
Screenshot of U.S. Coast Guard U.S. Aids to Navigation System handbook

What about on the Intracoastal Waterway?

The Intracoastal Waterway runs along the Atlantic and Gulf coasts of the U.S. The navigation aid system used in this waterway is similar to “Red, Right, Returning,” except you need to use yellow symbols.

If following the waterway from New Jersey to Texas, keep the yellow triangles on the right side of the boat (starboard) and the yellow squares on your port, regardless of what color the navigational aid is, according to the U.S. Coast Guard’s guidebook.

Why?

This is because some of the beacons, buoys and other navigational aids you’ll see on the water are used by Intracoastal Waterway and non-Intracoastal Waterway routes.
That means boaters might “travel next to each other in opposing directions — and share the same aids,” the guidebook states. 
“Thus, when following the ICW, navigate by yellow symbols; otherwise, navigate by the color of the Aid itself.”

If boating on the Intracoastal Waterway, rely on the yellow symbols.
Screenshot of U.S. Coast Guard U.S. Aids to Navigation System handbook

You might also see yellow horizontal reflector bands on signs while traveling along the Intracoastal Waterway.
The yellow band just marks the navigational aid as being part of the Intracoastal Waterway route.

Hazards and other signs

While traveling by boat, you may find other signs, such as:

▪ Diamond-shaped dayboards, which help boaters know where they are. The U.S. Coast Guard says these signs are the nautical equivalent of “You Are Here” markers. You’ll still need to use a nautical chart to figure out where you are.

▪ Sometimes you’ll see orange-and-white navigational aids with various symbols on them. If it has a diamond shape symbol, it means there is a hazard ahead, such as a submerged rock or that it’s a shallow area. A circle means the boat is entering a “controlled area” such as manatee protection zones, for example, which would require boaters to slow down to a certain speed to keep the sea cows safe. Or perhaps you see a sign that says “Idle Speed - No Wake,” and that means the boat operator needs to go at the minimum speed needed to steer.

If the orange-and-white navigational aid has a square, you’ll likely find helpful info, such as directions, distances and locations to the marina entrance for a state park, for example.
If you see a diamond shape with a cross, get out of there.
No boats allowed.


There are a variety of navigational aids you’ll see in the water.
Screenshot of U.S. Coast Guard U.S. Aids to Navigation System handbook

What about at night?

The U.S. Coast Guard says navigational aids can only be identified by their light characteristics at night. 
 
This includes:
▪ The color you see. Is it red, green, white or yellow?
▪ The sequence of flashes and/or the time it takes for the aid to go through one sequence of flashes
▪ If the aid is equipped with retroreflective material

Boaters are also required to use lights from sunset to sunrise or when it’s hard to see, such as in rain or fog, to help other boaters figure out how far away each of the vessels are from each other and where the boats are going. Make sure to turn off all other lights on your boat that may interfere, or cause confusion, with navigation lights.

Another tip:


“Whenever you see a red navigation light from another vessel, give way. It is the stand-on vessel ... it has the right of way,” according to the guidebook.

“If you see both the red and green sidelights of another boat, it is coming straight toward you. You should take action to change course in order to avoid a collision.” 


This chart shows the navigations lights boats may have at night or in certain conditions such as rainy or foggy days from various angles.
Screenshot of U.S. Coast Guard U.S. Aids to Navigation System handbook 

What other navigational aids should I know about?

There are a lot of rules boaters need to know, though the “Rules of the Road” can vary depending on whether you’re boating inland or on international waters.
The rules also include how to handle common situations such as overtaking, meeting head on and crossing the bow of another boat.

Similarly, there a lot of other navigational aids boaters might see out on the water.
To find more information about markers and the rules of the water, visit uscgboating.org.
For a summary of Florida’s boating laws, visit https://myfwc.com/boating/regulations/.

Links :