Saturday, November 19, 2022

The Borgia Mappa Mundi : a 15th century map of the world

The Borgia Mappa Mundi is a map of the world which was made around the middle of the 15th Century.
The map is orientated with south at the top, differing from earlier medieval mappa mundi and earlier T and O maps which tended to be oriented with east at the top (at least three other 15th Century world maps were also orientated with south at the top - the 1448 world map of Andreas Walsperger, the 1459 Fra Mauro world map, and the Zeitz mappa mundi.
The Borgia map, however, does resemble other early western global maps in that it divides the world into three continents - Asia, Africa and Europe (with Asia being roughly the size of Africa and Europe combined).
It also resembles other early western maps in that its view of the world is shaped by the Bible, Ptolemy's Geographia and many dubious myths and legends.
My annotated Borgia Mappa Mundi is an interactive version of this 15th Century map of the world on which the original German placename labels have been translated into English.
This translated version of the map really allows you to explore the world as seen by a 15th Century European.
Search hard and you can find the location of Paradise (east of India), the mountains of the moon, and the provinces of Gog and Magog.
While exploring the world make sure you also keep a wary eye out for the huge men with horns four feet long (in India), the Ethiopian Saracens with their faces of dogs and the Bavarian stags which vomit boiling water.
The Borgia map used in my annotated map belongs to the David Rumsey Map Collection.
The translations come from The Borgia/ Velletri World Map DATE: 1410 - 1458 (PDF) and A Fifteenth Century Map of the World (PDF).
If you like my annotated Borgia map then you might also like Historia Cartarum's Annotated Claudius Map.
This provides an interactive annotated map of Matthew Paris's medieval map of Britain, revealing the modern British placenames for all the locations depicted on the original 13th Century map.

Friday, November 18, 2022

Scientists are uncovering ominous waters under Antarctic ice


Researchers just found that, at the base of Antarctica’s ice, an area the size of Germany and France combined is feeding meltwater into a super-pressurized, 290-mile-long river running to the sea.
Photograph: Getty Images


From Wired by Matt Simon

A super-pressurized, 290-mile-long river is running under the ice sheet.
That could be bad news for sea-level rise.


For all its treacherousness and general inclination to kill you, Antarctica’s icy surface is fairly tranquil: vast stretches of miles-thick whiteness, with not a plant or animal to speak of.
But way below the surface, where that ice meets land, things get wild.
What scientists used to think was a ho-hum subglacial environment is in fact humming with hydrological activity, recent research is revealing, with major implications for global sea-level rise.

Researchers just found that, at the base of Antarctica’s ice, an area the size of Germany and France combined is feeding meltwater into a super-pressurized, 290-mile-long river running to the sea.
“Thirty years ago, we thought the whole of the ice pretty much was frozen to the bed,” says Imperial College London glaciologist Martin Siegert, coauthor of a new paper in Nature Geoscience describing the finding.
“Now we're in a position that we've just never been in before, to understand the whole of the Antarctic ice sheet.”

Antarctica’s ice is divided into two main components: the ice sheet that sits on land, and the ice shelf that extends off the coast, floating on seawater.
Where the two meet—where the ice lifts off the bed and starts touching the ocean—is known as the grounding line.

But the underside of all that ice is obscured.
To find out what’s going on below, some scientists have hiked across glaciers while dragging ground-penetrating radar units on sleds—the pings travel through thousands of feet of ice and bounce off the underlying seawater, so the researchers can build detailed maps of what used to be hidden.
Others are setting off explosions, then analyzing the seismic waves that come back to the surface to indicate whether there’s land or water below.
Still others are lowering torpedo-shaped robots through boreholes to get unprecedented imagery of the underside of the floating ice shelf.
Up in the sky, satellites can measure minute changes in surface elevation, which indicates the features below—a swell, for instance, might betray a subglacial lake.

This new research on the subglacial river used radar data from aircraft flying over Antarctica.
The scientists paired that data with complex modeling of the area’s unique “basal” hydrology, like how water is expected to move underneath miles of ice.

As the scientists found out, it moves very weirdly.
Because there can be miles of ice resting on Antarctica’s land, and because the region isn’t warming as fast as the Arctic, the ice doesn’t melt the way you might think, from the sun striking the surface.
That’s the way it works in places like Greenland, where ever-warming temperatures are creating lakes on the surface of the ice, and that water then leaks down through crevasses, known as moulins.

But in Antarctica, the basal melt instead comes from the land warming the ice.
While it’s not volcanically boisterous, Antarctica has enough geothermal heat to get melt going.
Further heat is provided by friction, as the ice grinds across bedrock.
That means that instead of the melt happening top down, it happens at the bottom.

It’s not a tremendous amount of melt per square foot.
But over an area that’s the size of two large European countries, that scales up.
“What we concluded is the melting is really small—it's like a millimeter per year,” says Siegert.
“But the catchment is enormous, so you don't need much melting.
That all funnels together into this river, which is several hundred kilometers long, and it's three times the rate of flow of the river Thames in London.”

That water is under extreme pressure, both because there’s a lot of ice pressing down from above and because there isn’t much room between the ice and the bedrock for the liquid to move around.
“And because it's under high pressure, it can act to lift the ice off its bed, which can reduce friction,” Siegert says.
“And if you reduce that basal friction, the ice can flow much quicker than it would do otherwise.”
Think of that ice like a puck sliding across an air hockey table, only instead of riding on air, the ice is riding on pressurized water.

This massive hidden river, says University of Waterloo glaciologist Christine Dow, lead author of the new paper, “can pump a huge volume of fresh water into the ocean.”
And that could be bad news for the glacial ice sheet’s connection to the floating ice shelf.
“Where the ice begins to float is the most sensitive region,” she continues.
“So anything that is going to change where that grounding line rests is going to have significant control on how much sea level rise we have in the future.”

What’s holding the ice sheet back—and keeping sea levels from jumping many feet—is the ice shelf, which acts like a big, heavy cork to slow the flow of a glacier into the sea.
But in Antarctica, these corks are fragmenting, as warming waters eat away at the underside of them.
The ice shelf of Antarctica’s Thwaites Glacier (aka the Doomsday Glacier), for instance, could crumble in three to five years, recent research suggests.
If we lost Thwaites entirely, it alone would contribute two feet to sea levels.

It’s not just Thwaites.
Researchers are finding that many of Antarctica’s grounding lines are receding, like hairlines.
Yet models that predict the future state of these glaciers assume that grounding lines are static.
Scientists already know that those models are missing another key factor that may affect how well these lines can hold: an effect known as tidal pumping.
When tides go in and out, they heave the ice shelf up and down, allowing warm seawater to rush inland and melt the underside of the ice.
This new research now shows that pressurized meltwater is also coming from the other direction, flowing from inland to the grounding line.

“The problem is, if you have a lot of fresh water being pumped into the ocean, it buoyantly moves up toward the base of the ice, and it's dragging warm ocean water up with it, melting that ice,” says Dow.
“That causes that grounding line to retreat.
And then all of the ice that was formerly grounded is now floating to instantly add to sea level rise and destabilize the whole system.” In other words, the ice doesn’t have to melt to raise water levels, because its massive bulk displaces liquid too.

Another concern is what will happen if Antarctica’s ice starts behaving more like Greeland’s—melting from the top.
In that scenario, crevasses would open up in the glacial ice during the summer, allowing water to pour down to the bedrock, supercharging the subglacial hydrology.
“There's likely to be surface melt at some point in the future, probably within the next 100 years,” says Dow.
“If that water is able to get to the base of the ice, then we could have a system that's a lot more like Greenland and a lot more seasonally driven. We don't really know what that's going to do yet.”

“This article is a notable contribution to our understanding of how the veins and arteries of fresh water beneath the Antarctic ice sheets may look and act,” Penn State glaciologist Nathan Stevens, who wasn’t involved in the paper, emailed WIRED from Antarctica, where he’s conducting his own research.
“Subglacial hydrology is one of the big players in how ice sheets behave—now, in the future, and in the past.”

If there’s any good news in this situation, says University of Houston physicist Pietro Milillo, it’s that scientists are gathering ever more data on the hitherto hidden dynamics playing out beneath Antarctica’s ice.
“This paper adds a piece to the puzzle of understanding what's actually going on at the grounding line,” says Milillo, who studies Antarctic glaciers but wasn’t involved in the research.

Previously, Milillo says, there was a mismatch between the satellite data and the models.
The elevation changes that satellites were measuring from space would suggest more ice loss than the amount of melt that models predicted seawater would cause at the grounding line.
Now, he says, it’s clear the satellites were right.
“We can actually account for that,” Milillo says, “because it's fresh water that's melting the glaciers from the bottom.”

Links :

Thursday, November 17, 2022

Inside Alphabet X’s new effort to combat climate change with seagrass

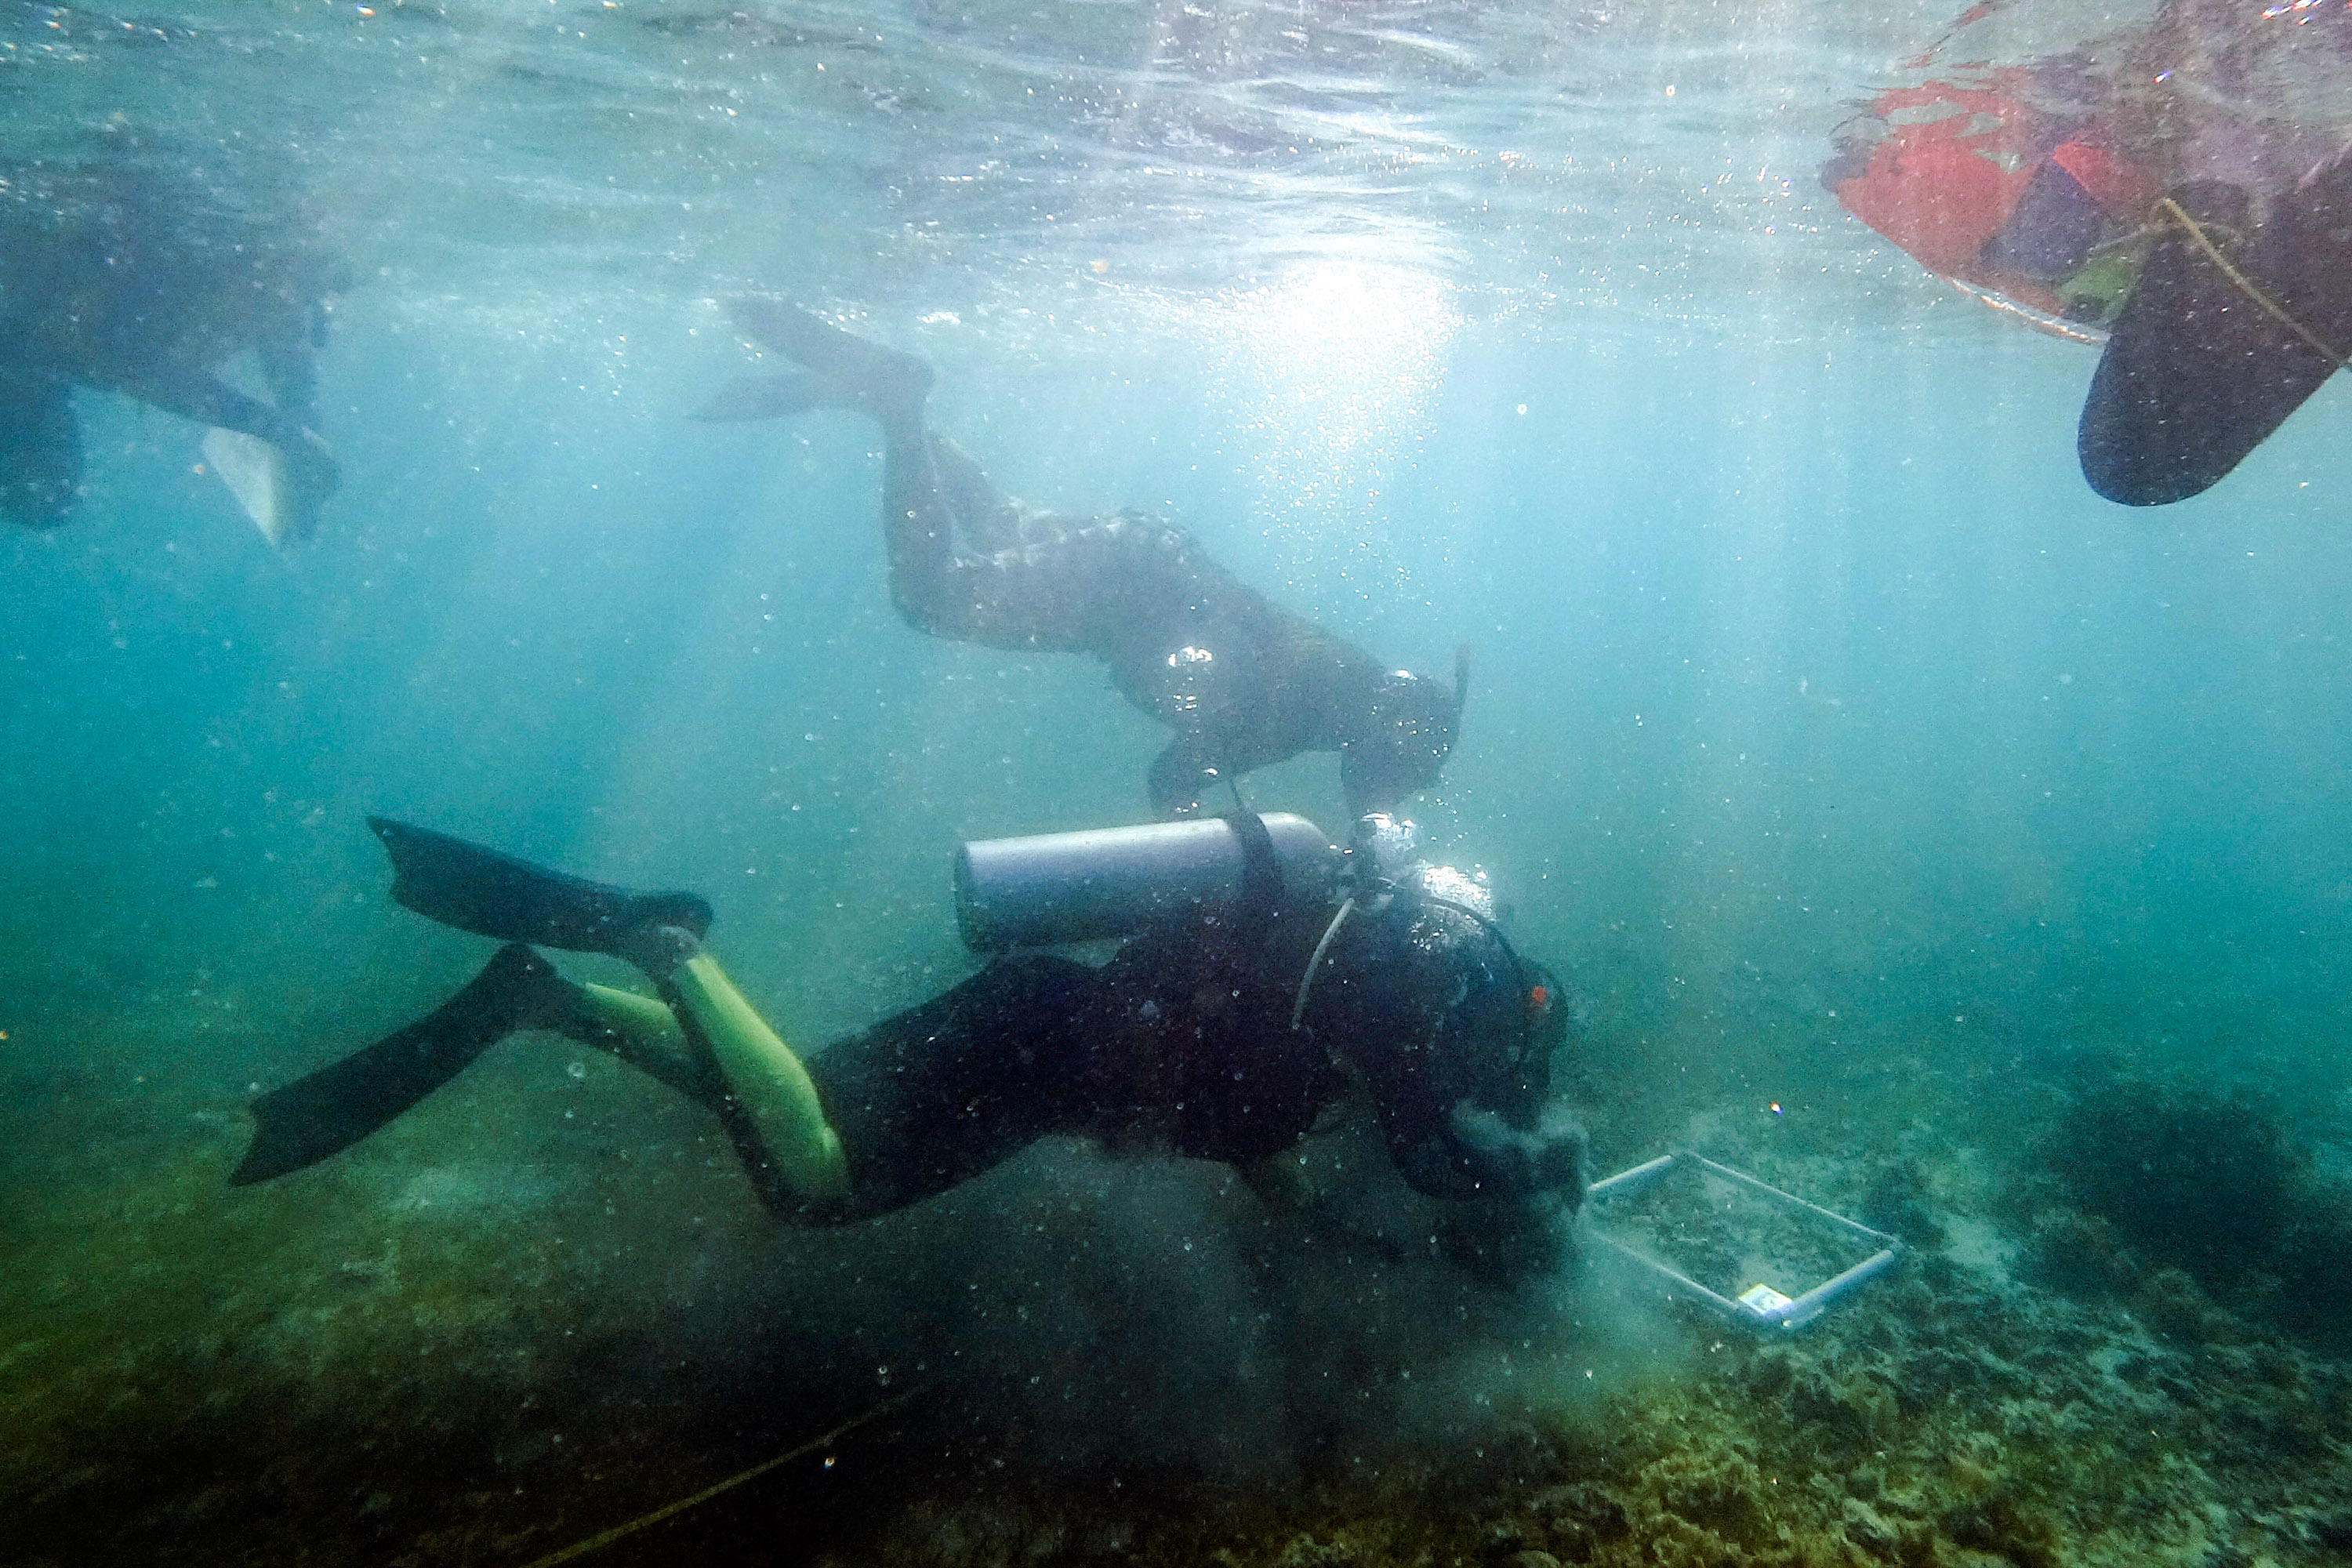
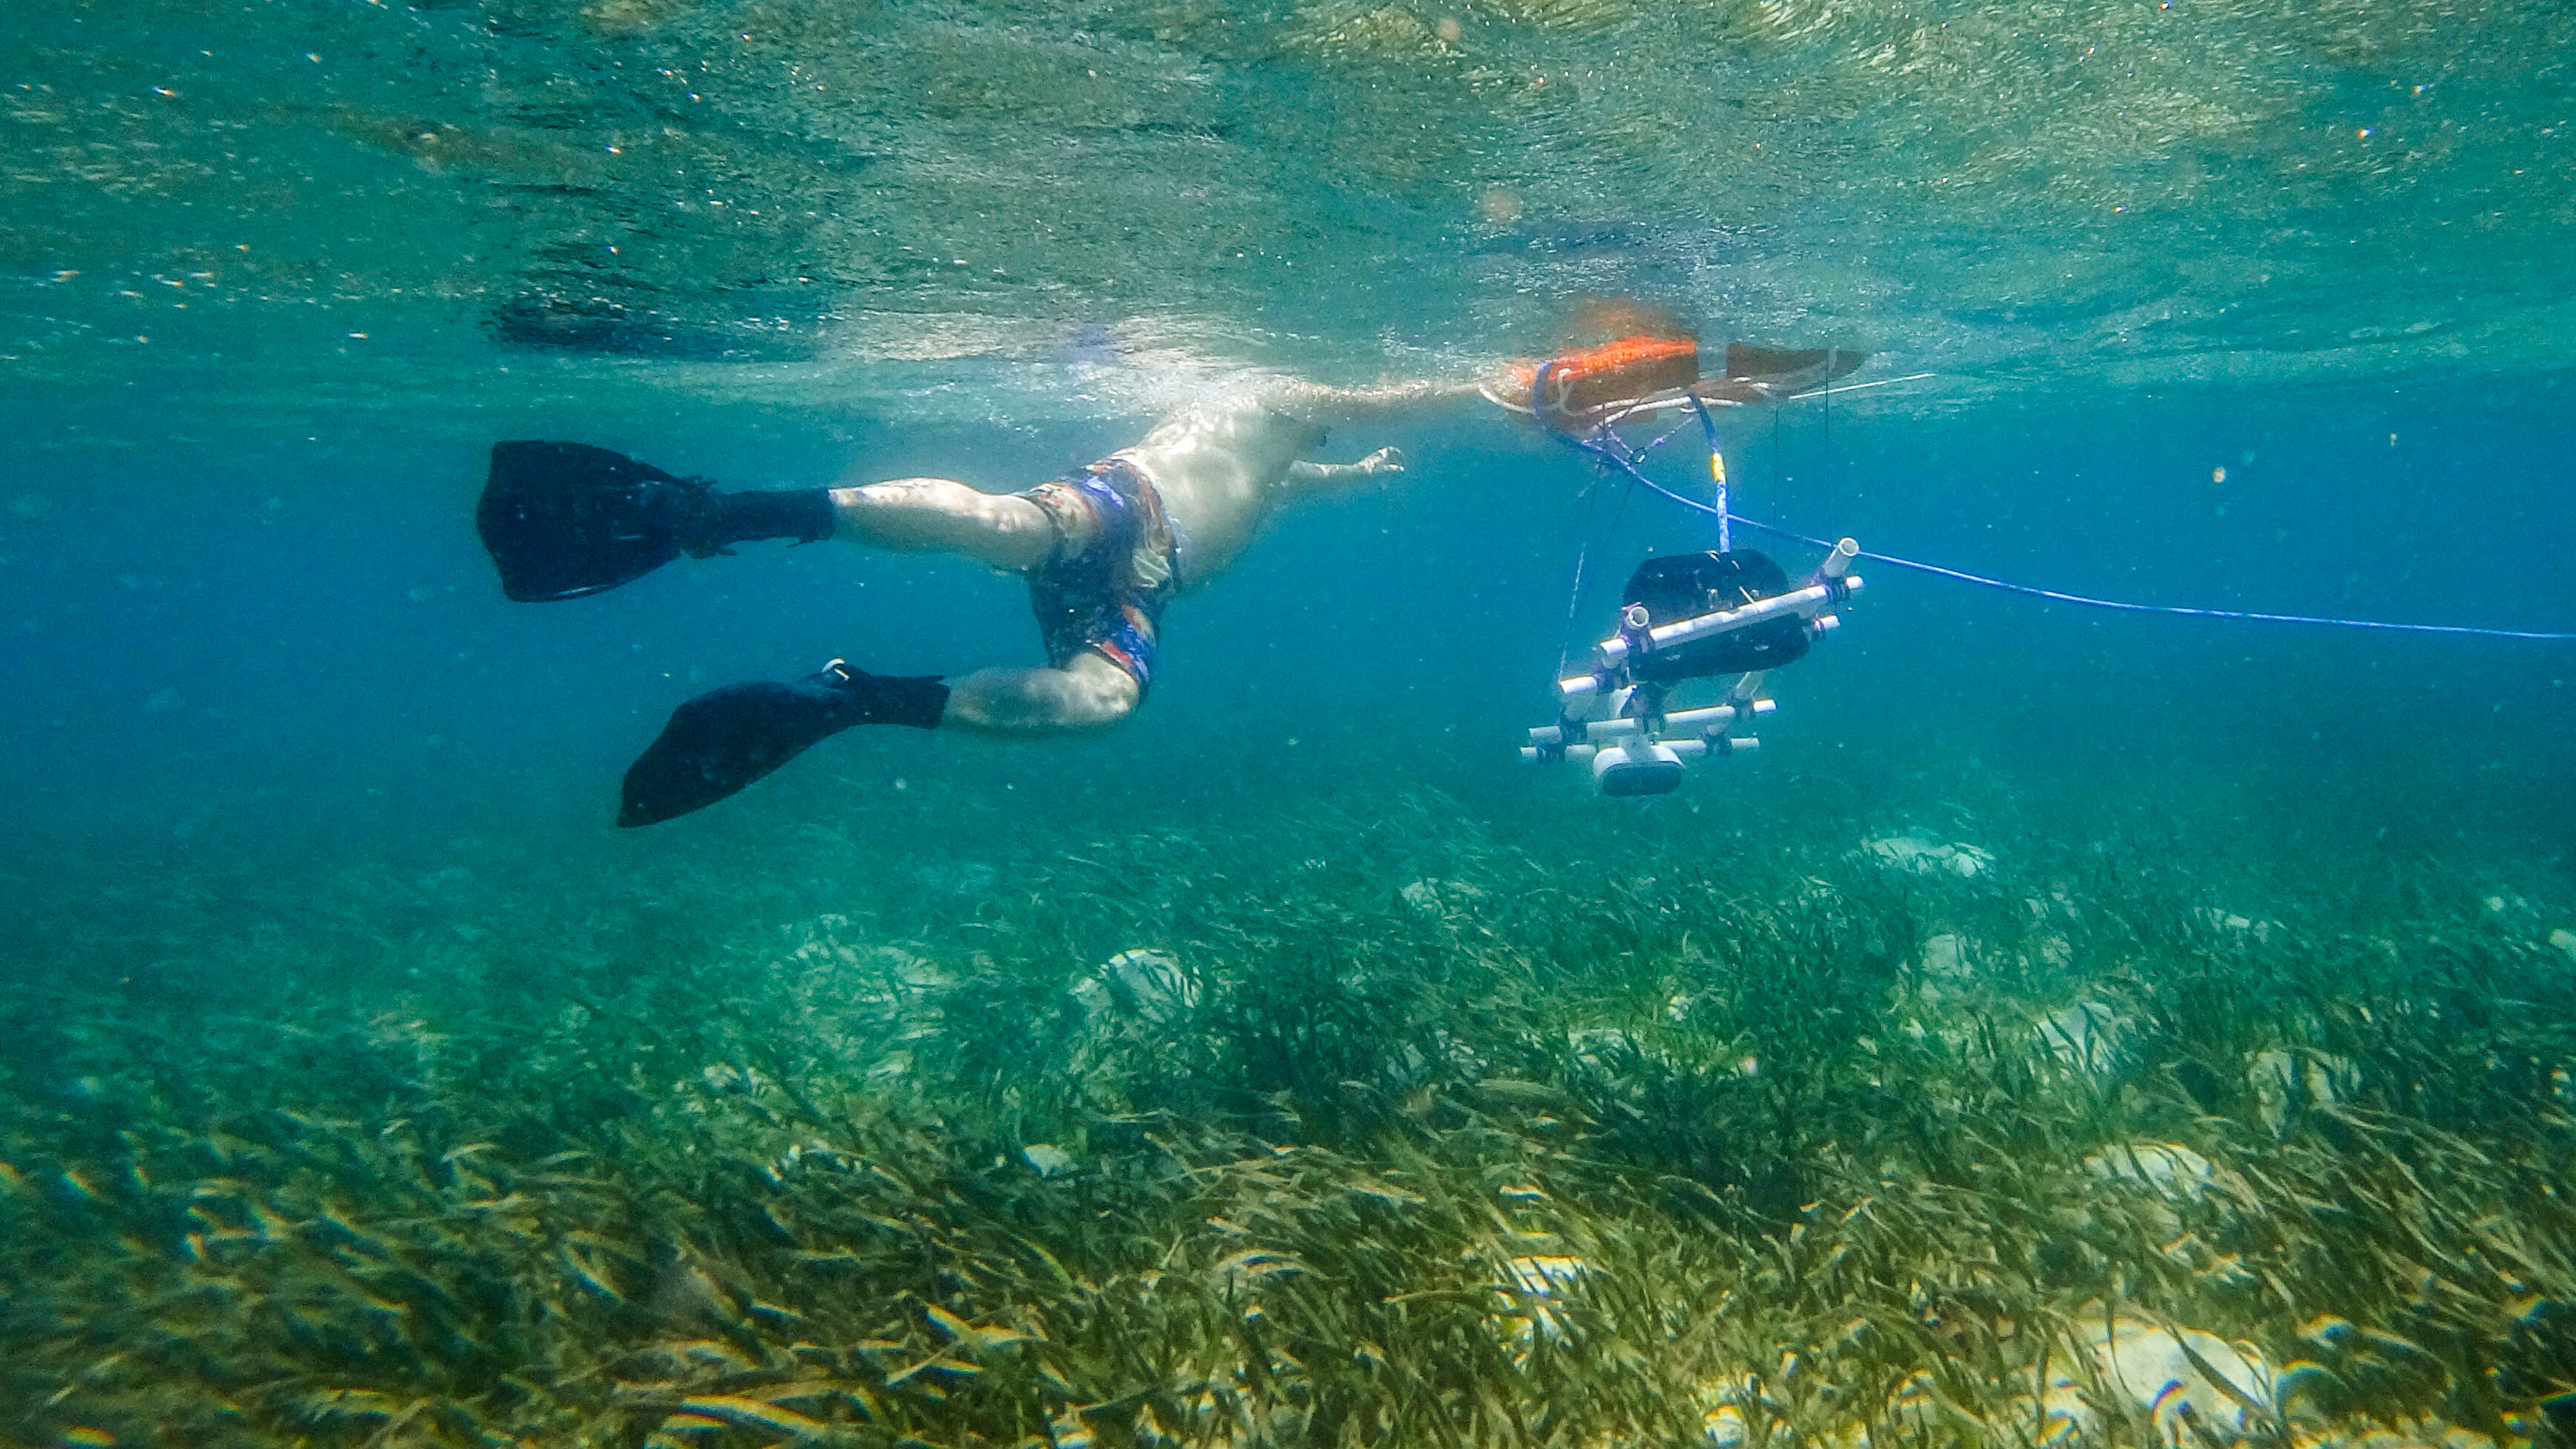
Terry Smith, a solutions engineer at Tidal, pulls an underwater camera system over a seagrass meadow near Manjerite Beach in Labuan Bajo, Indonesia.
photo : Agoes Rudianto

From Technology Review by James Temple

A previously unrevealed program would use cameras, computer vision, and machine learning to track the carbon stored in the biomass of the oceans.
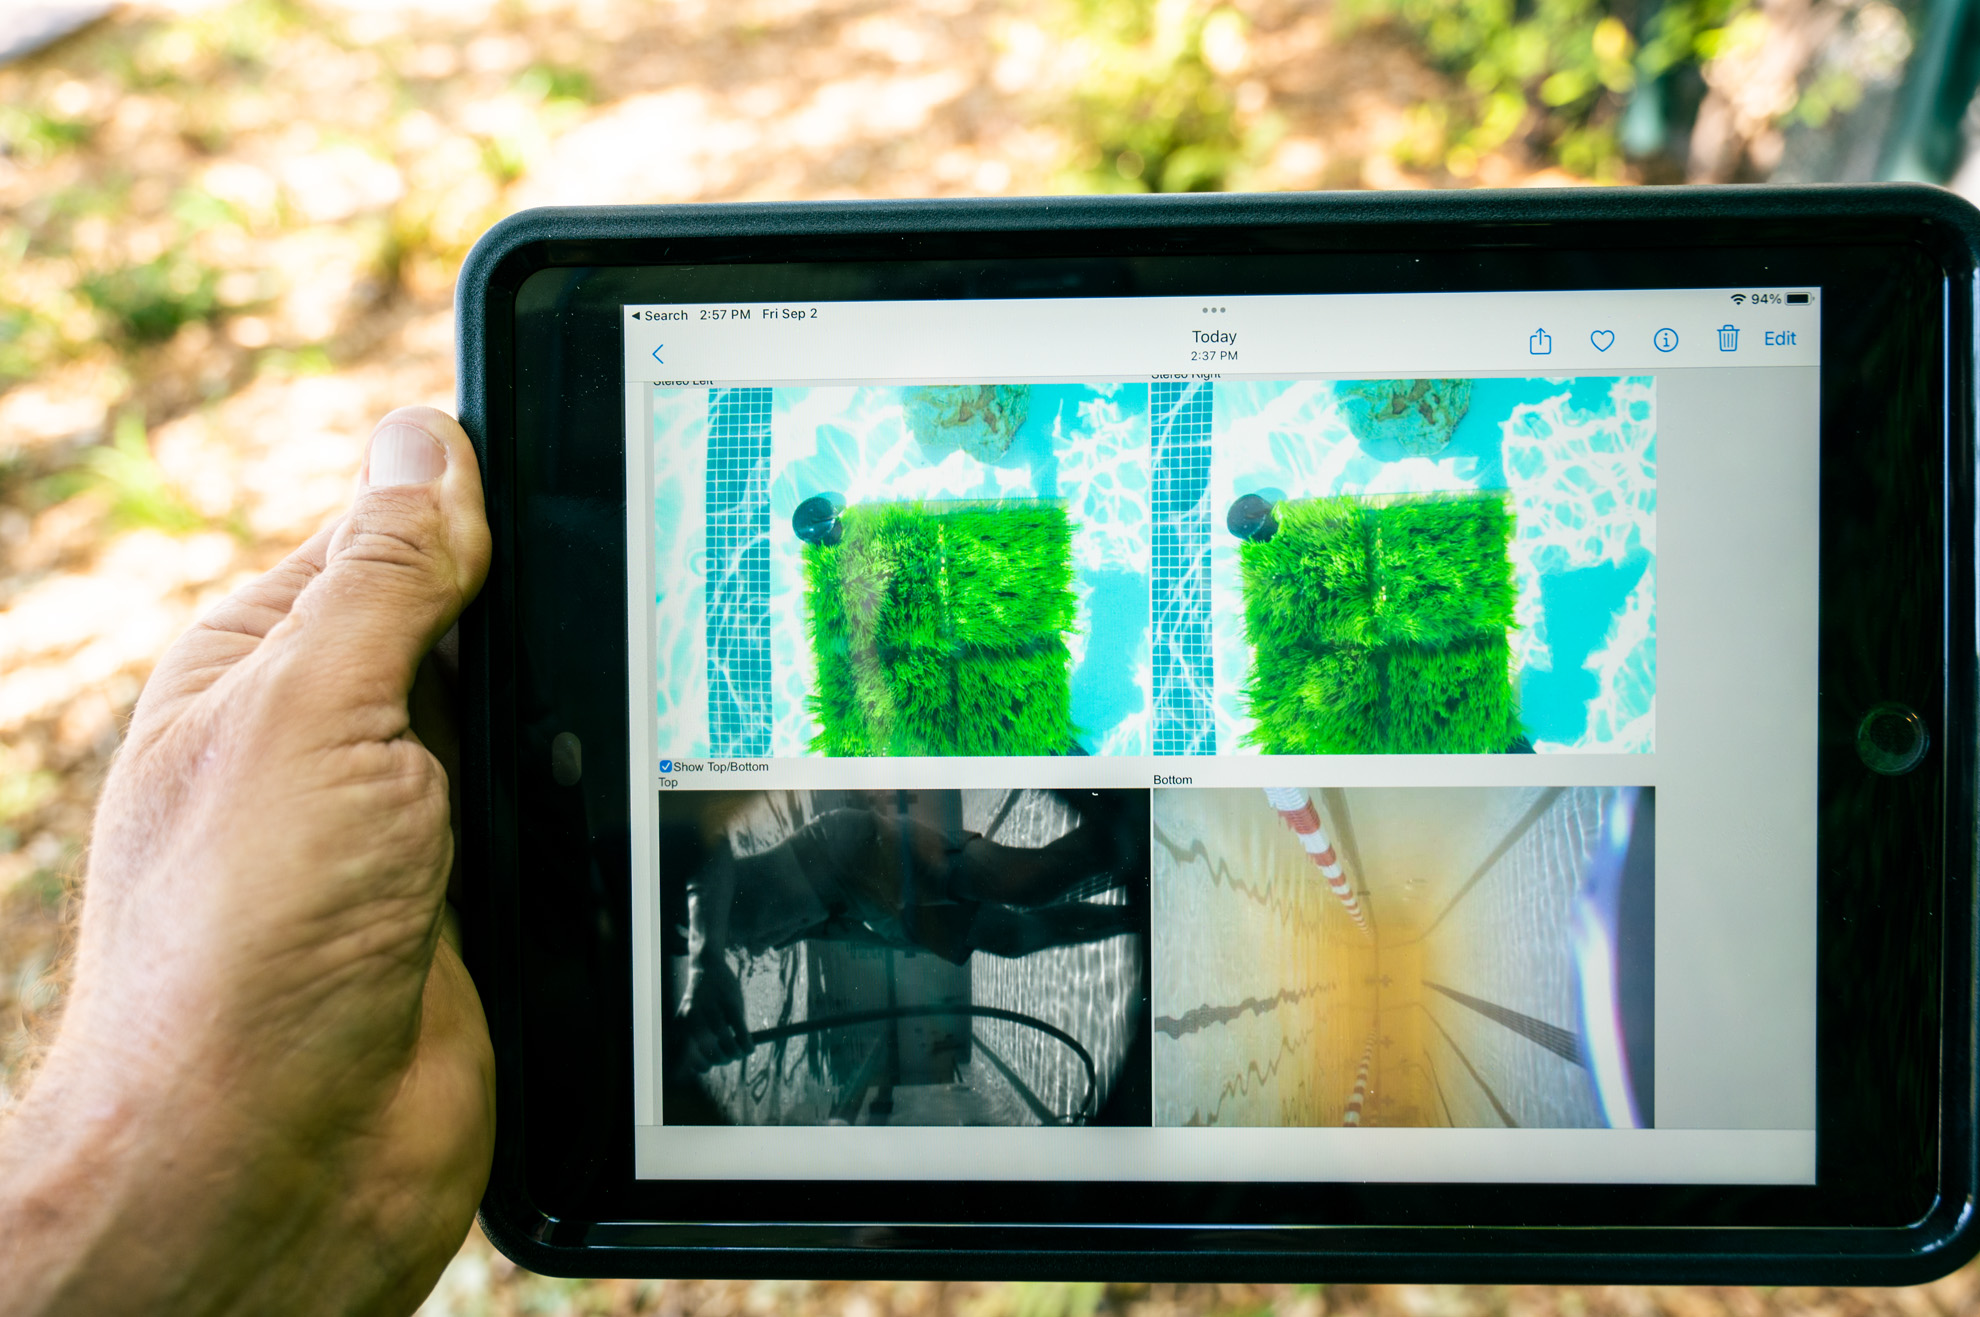
In late September, Bianca Bahman snorkeled above a seagrass meadow off the western coast of Flores, a scorpion-shaped volcanic island in eastern Indonesia.
As she flutter-kicked over the green seabed, Bahman steered an underwater camera suspended on a pair of small pontoons.

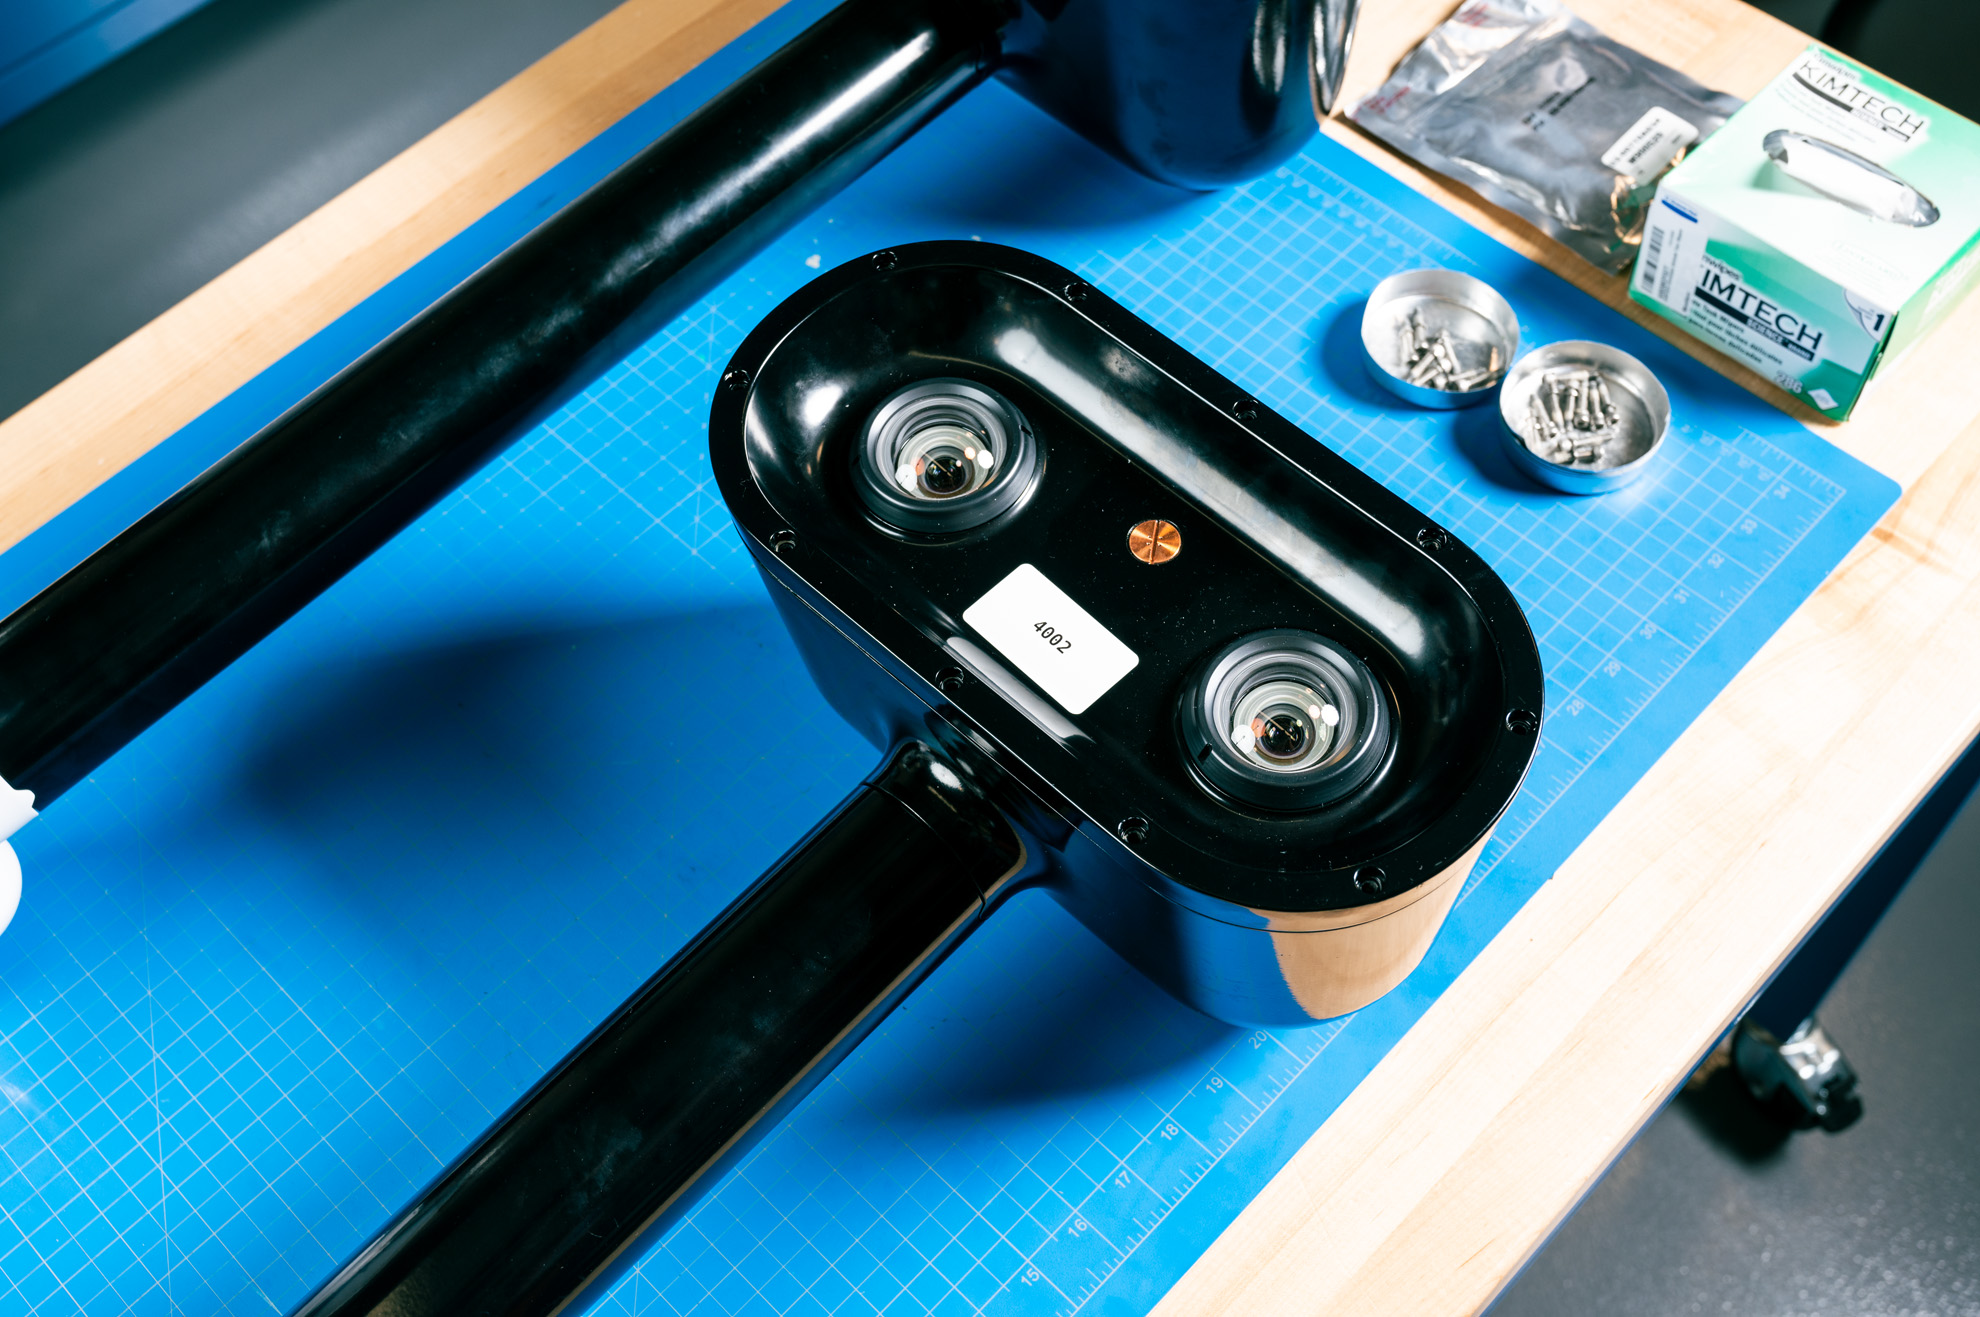
The stereoscopic camera captures high-resolution footage from two slightly different angles, creating a three-dimensional map of the ribbon-shaped leaves sprouting from the seafloor.

Bahman is a project manager for Tidal, whose team wants to use these cameras, along with computer vision and machine learning, to get a better understanding of life beneath the oceans.
Tidal has used the same camera system to monitor fish in aquafarms off the coast of Norway for several years.

Now, MIT Technology Review can report, Tidal hopes its system can help preserve and restore the world’s seagrass beds, accelerating efforts to harness the oceans to suck up and store away far more carbon dioxide.

Tidal is a project within Alphabet’s X division, the so-called moonshot factory.
Its mission is to improve our understanding of underwater ecosystems in order to inform and incentivize efforts to protect the oceans amid mounting threats from pollution, overfishing, ocean acidification, and global warming.

Its tools “can unlock areas that are desperately needed in the ocean world,” Bahman says.

Studies suggest the oceans could pull down a sizable share of the billions of additional tons of carbon dioxide that may need to be scrubbed from the atmosphere each year to keep temperatures in check by midcentury.
But making that happen will require restoring coastal ecosystems, growing more seaweed, adding nutrients to stimulate plankton growth, or similar interventions.

Tidal decided to focus initially on seagrass because it’s a fast-growing plant that’s particularly effective at absorbing carbon dioxide from shallow waters.
These coastal meadows might be able to suck up much more if communities, companies, or nonprofits take steps to expand them.

But scientists have only a rudimentary understanding of how much carbon seagrass sequesters, and how big a role the plant plays in regulating the climate.
Without that knowledge and affordable ways to verify that restoration efforts actually store away more carbon, it will be tricky to track climate progress and build credible carbon credit marketplaces that would pay for such practices.

Tidal hopes to crack the problem by developing models and algorithms that translate the three-dimensional maps of seagrass it captures into reliable estimates of the carbon held below.
If it works, automated versions of Tidal’s data-harvesting technology could provide that missing verification tool.
This could help kick-start and lend credibility to marine-based carbon credit projects and markets, helping to restore ocean ecosystems and slow climate change.


photo : Winni Wintermeyer


photo : Winni Wintermeyer

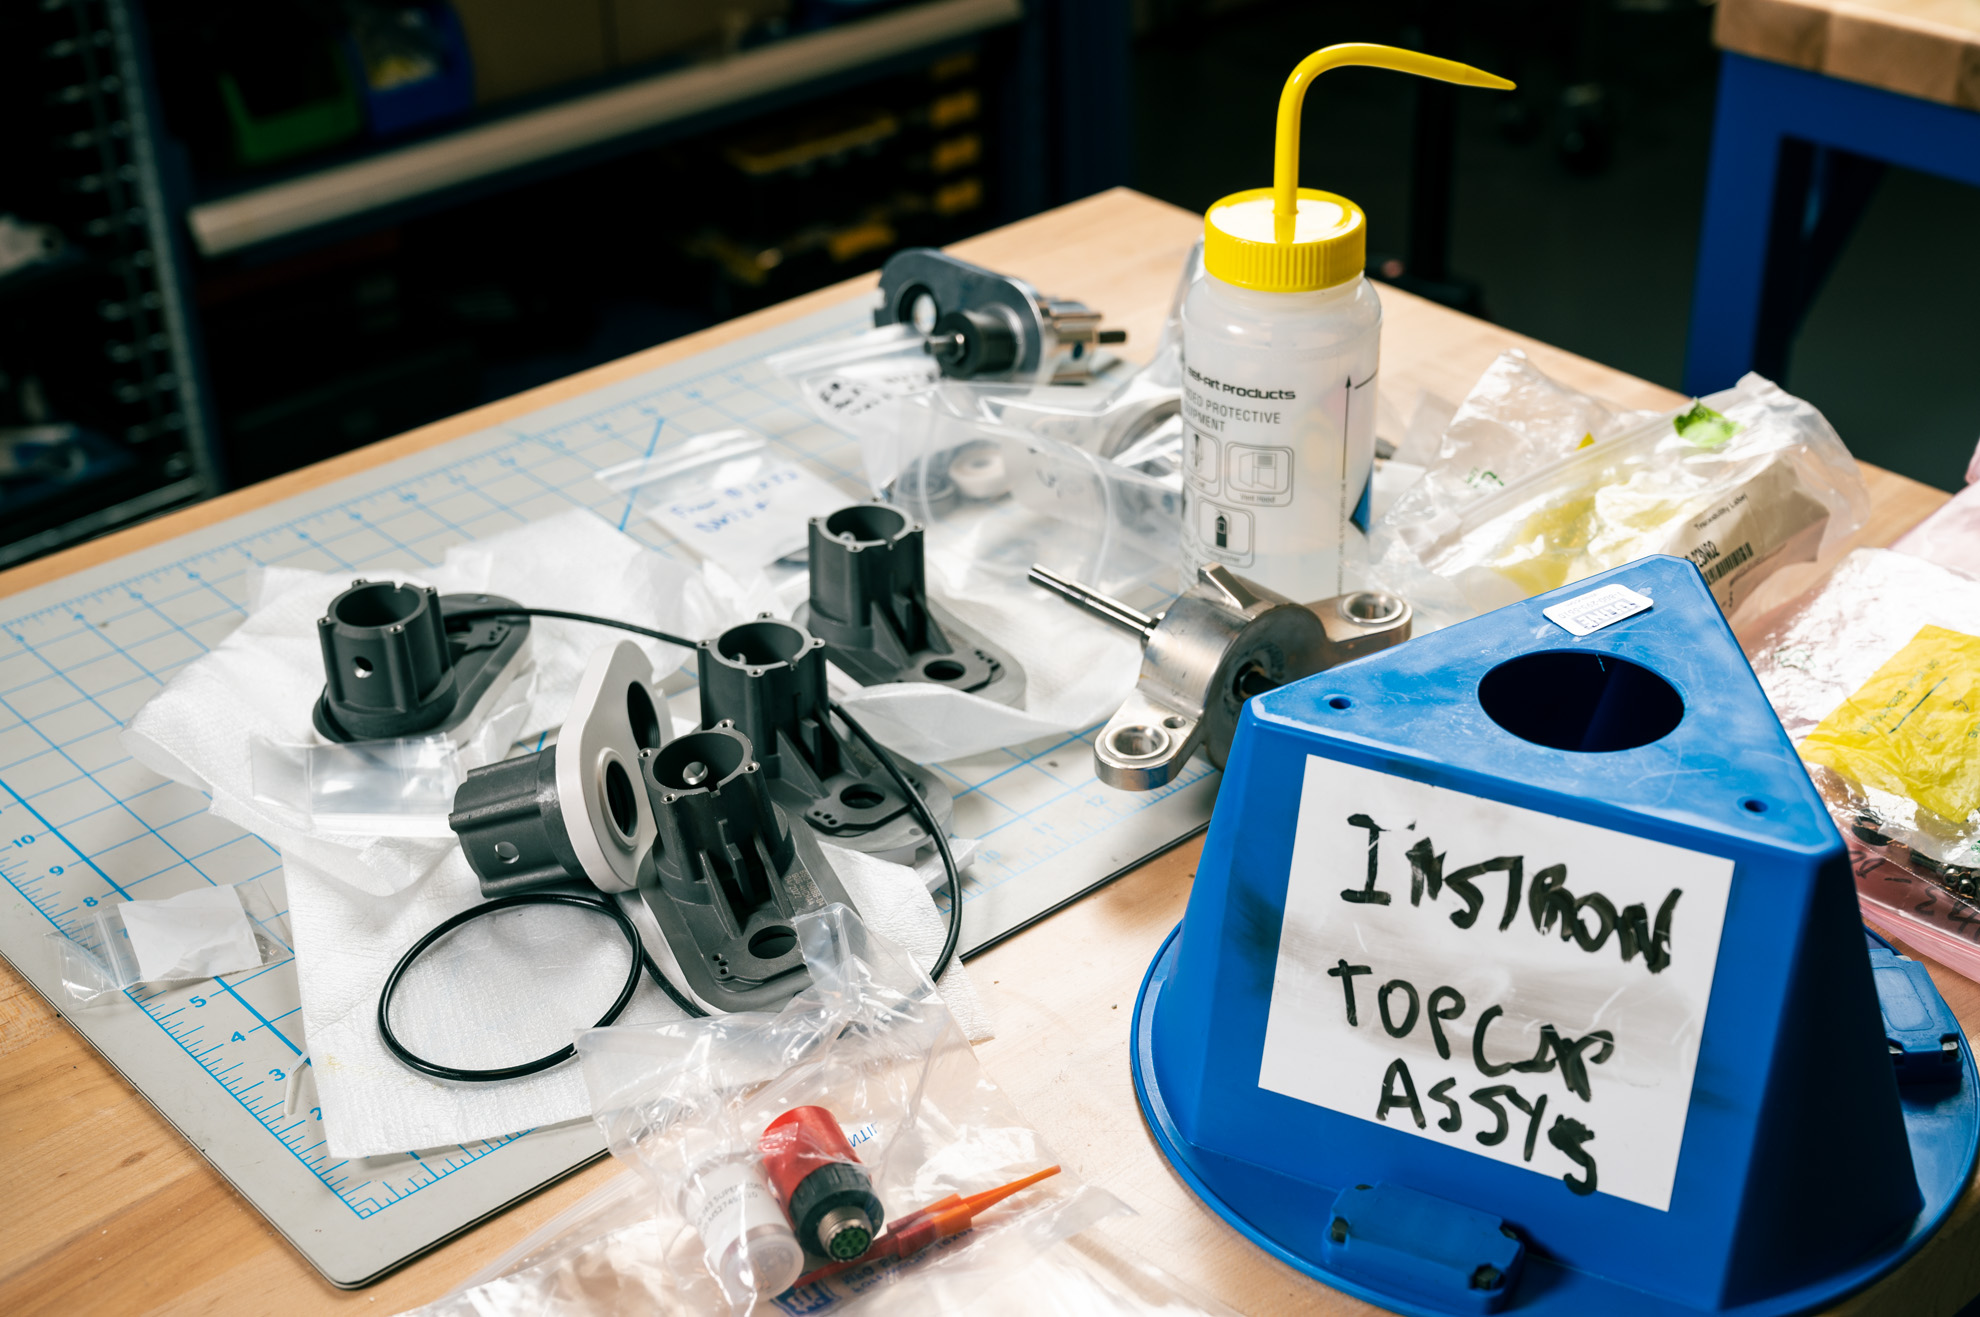
A workbench within X's building, where Tidal develops and tests its underwater camera systems.

The team envisions creating autonomous versions of its tools, possibly in the form of swimming robots equipped with its cameras, that can remotely monitor coastlines and estimate the growth or loss of biomass.

“If we can quantify and measure these systems, we can then drive investment to protect and conserve them,” says Neil Davé, the general manager of Tidal.

Still, some scientists are skeptical that Tidal’s technology will be able to accurately estimate shifting carbon levels in distant corners of the globe, among other challenges.
Indeed, nature-based carbon credits have faced growing criticism: studies and reporting find that such efforts can overestimate climate benefits, create environmental risks, or present environmental justice concerns.

Davé acknowledges that they don’t know how well it will work yet.
But he says that’s precisely what the Tidal team went to Indonesia, along with a group of Australian scientists, to try to find out.

X

Google launched what was then called Google X in early 2010, with a mandate to go after big, hard, even zany ideas that could produce the next Google.

This research division took over the self-driving-car project now known as Waymo.
It developed the Google Brain machine-learning tools that power YouTube recommendations, Google Translate, and numerous other core products of its parent company.
And it gave the world the Google Glassaugmented-reality headset (whether the world wanted it or not).
There were even short-lived flirtations with things like space elevators and teleportation.

X pursued climate-related projects from the start, but has had a very mixed track record in this area to date.

It acquired Makani, an effort to capture wind energy from large, looping kites, but the company shut down in 2020.
It also pursued a project to produce carbon-neutral fuels from seawater, dubbed Foghorn, but abandoned the effort after finding it’d be too hard to match the cost of gasoline.

The two official climate “graduates” still operating are Malta, a spinout that relies on molten salt to store energy for the grid in the form of heat, and Dandelion Energy, which taps into geothermal energy to heat and cool homes.
Both, however, remain relatively small and are still striving to gain traction in their respective markets.

After 12 years, X has yet to deliver a breakout success in climate or clean tech.
The question is whether shifting strategies at X, and the current crop of climate-related efforts like Tidal, will improve that track record.

Astro Teller, the head of X, told MIT Technology Review that the division “pushed hard on radical innovation” at first.
But it has since gradually turned up the “rigor dials” in lots of ways, he says, focusing more on the feasibility of the ideas it pursued.

The earlier X climate efforts were generally high-risk, hardware-heavy projects that directly addressed energy technologies and climate emissions, producing electricity, fuels, and storage in novel ways.

There are some clear differences in the climate projects that X is publicly known to be pursuing now.
The two aside from Tidal are Mineral, which is using solar-panel-equipped robots and machine learning to improve agricultural practices, and Tapestry, which is developing ways to simulate, predict, and optimize the management of electricity grids.

With Tidal, Mineral, and Tapestry, X is creating tools to ensure that industries can do more to address environmental dangers and that ecosystems can survive in a hotter, harsher world.
It’s also leaning heavily in to its parent company’s areas of strength, drawing on Alphabet’s robotics expertise as well as its ability to derive insights from massive amounts of data using artificial intelligence.

Such efforts might seem less transformative than, say, flying wind turbines—less moonshot, more enabling technology.

But while Teller allows that their new thinking may “be changing the character of the things that you see at X today,” he pushes back against the suggestion that the problems it’s pursuing aren’t as hard, big, or important as in the past.

“I don’t know that Tidal has to apologize for some sort of scope problem,” he says.

“Humanity needs the oceans and is killing off the oceans,” he adds.
“We have to find a way to get more value from the ocean for humanity, while simultaneously regenerating the oceans instead of continuing to deplete them.
And that’s just not going to happen unless we find a way to get automation into the oceans.”

A better protein source


Tidal, founded in 2018, grew out of informal conversations at X about the mounting threats to the oceans and the lack of knowledge required to address them, Davé says.

“The goal was overly simplistic: save the oceans, save the world,” he says.
“But it was based on the understanding that the oceans are critical to humanity, but probably the most neglected or misused resource we have.”

They decided to begin by focusing on a single application: aquaculture, which relies on land-based tanks, sheltered bays, or open ocean pens to raise fish, shellfish, seaweed, and more.
Today, these practices produce just over half the fish consumed by humans.
But the more they’re used, the more they might ease the commercial pressures to overfish, the emissions from fishing fleets, and the environmental impact of trawling.

Tidal believed it could provide tools that would allow aquafarmers to monitor their fish in a more affordable way, spot signs of problems earlier, and optimize their processes to ensure better health and faster growth, at lower cost.

 
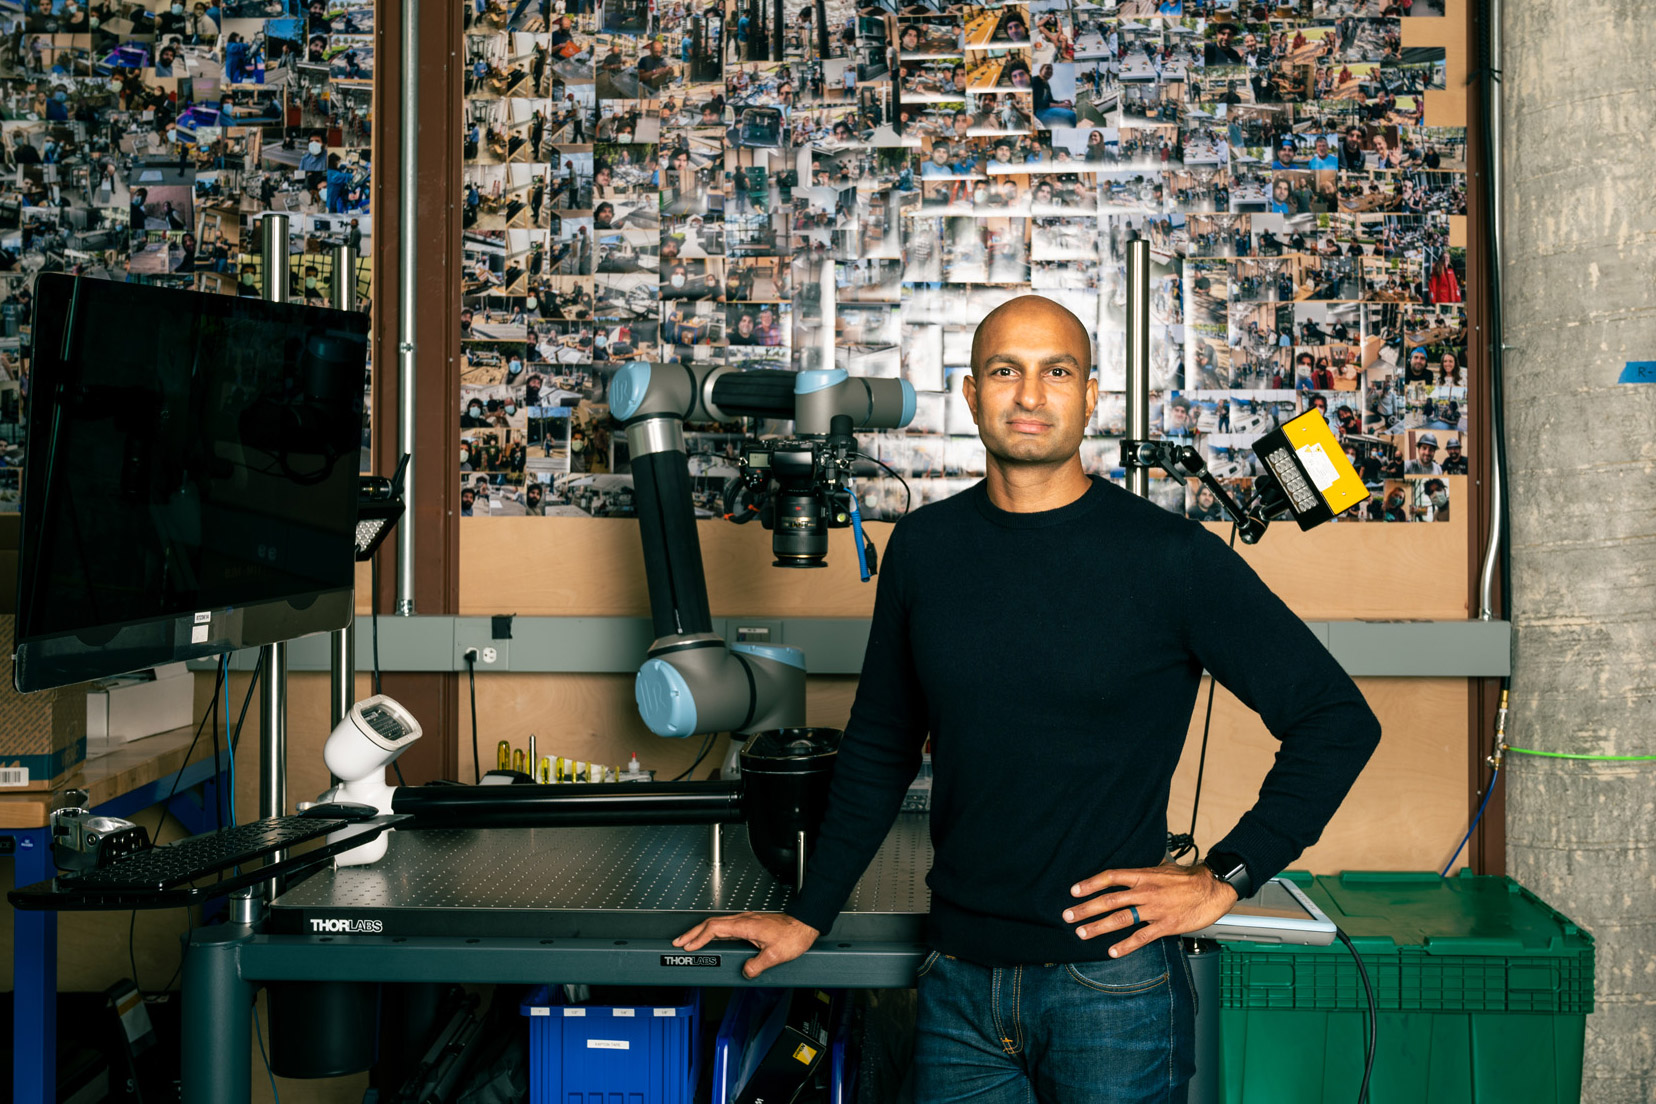
Neil Davé, the general manager of Tidal at X.
photo : Winni Wintermeyer

The researchers developed and tested a variety of prototypes for underwater camera systems.
They also began training computer vision software, which can identify objects and attributes within footage.
To get it started, they used goldfish in a kiddie pool.

For the last five years, they’ve been stress-testing their tools in the harsh conditions of the North Sea, through a partnership with the Norwegian seafood company Mowi.

During a Zoom call, Davé pulled up a black-and-white video of the chaos that ensues at feeding time, when salmon compete to gobble up the food dropped into the pen.
It’s impossible for the naked eye to draw much meaning from the scene.
But the computer vision software tags each fish with tiny colored boxes as it identifies individuals swimming through the frame, or captures them opening their mouths to feed.

Davé says fish farms can use that data in real time, even in an automated way.
For instance, they might stop dropping food into the pen when the fish cease feeding.

The cameras and software can perceive other important information as well, including how much the fish weigh, whether they have reached sexual maturity, and whether they show any signs of health problems.
They can detect spinal deformities, bacterial infections, and the presence of parasites known as sea lice, which are often too tiny for the human eye to see.

“We knew from the early days that aquaculture would be us getting our feet wet, so to speak,” says Grace Young, Tidal’s scientific lead.
“We knew it would be a stepping stone into working on other hard problems.”

Confident that it’s created one viable commercial application, Tidal is now turning its attention to gathering information about natural ocean ecosystems.

“Now is a big moment for us,” she adds, “because we’re able to see how the tools that we built can apply and make a difference in other ocean industries.”
Restoring our coasts

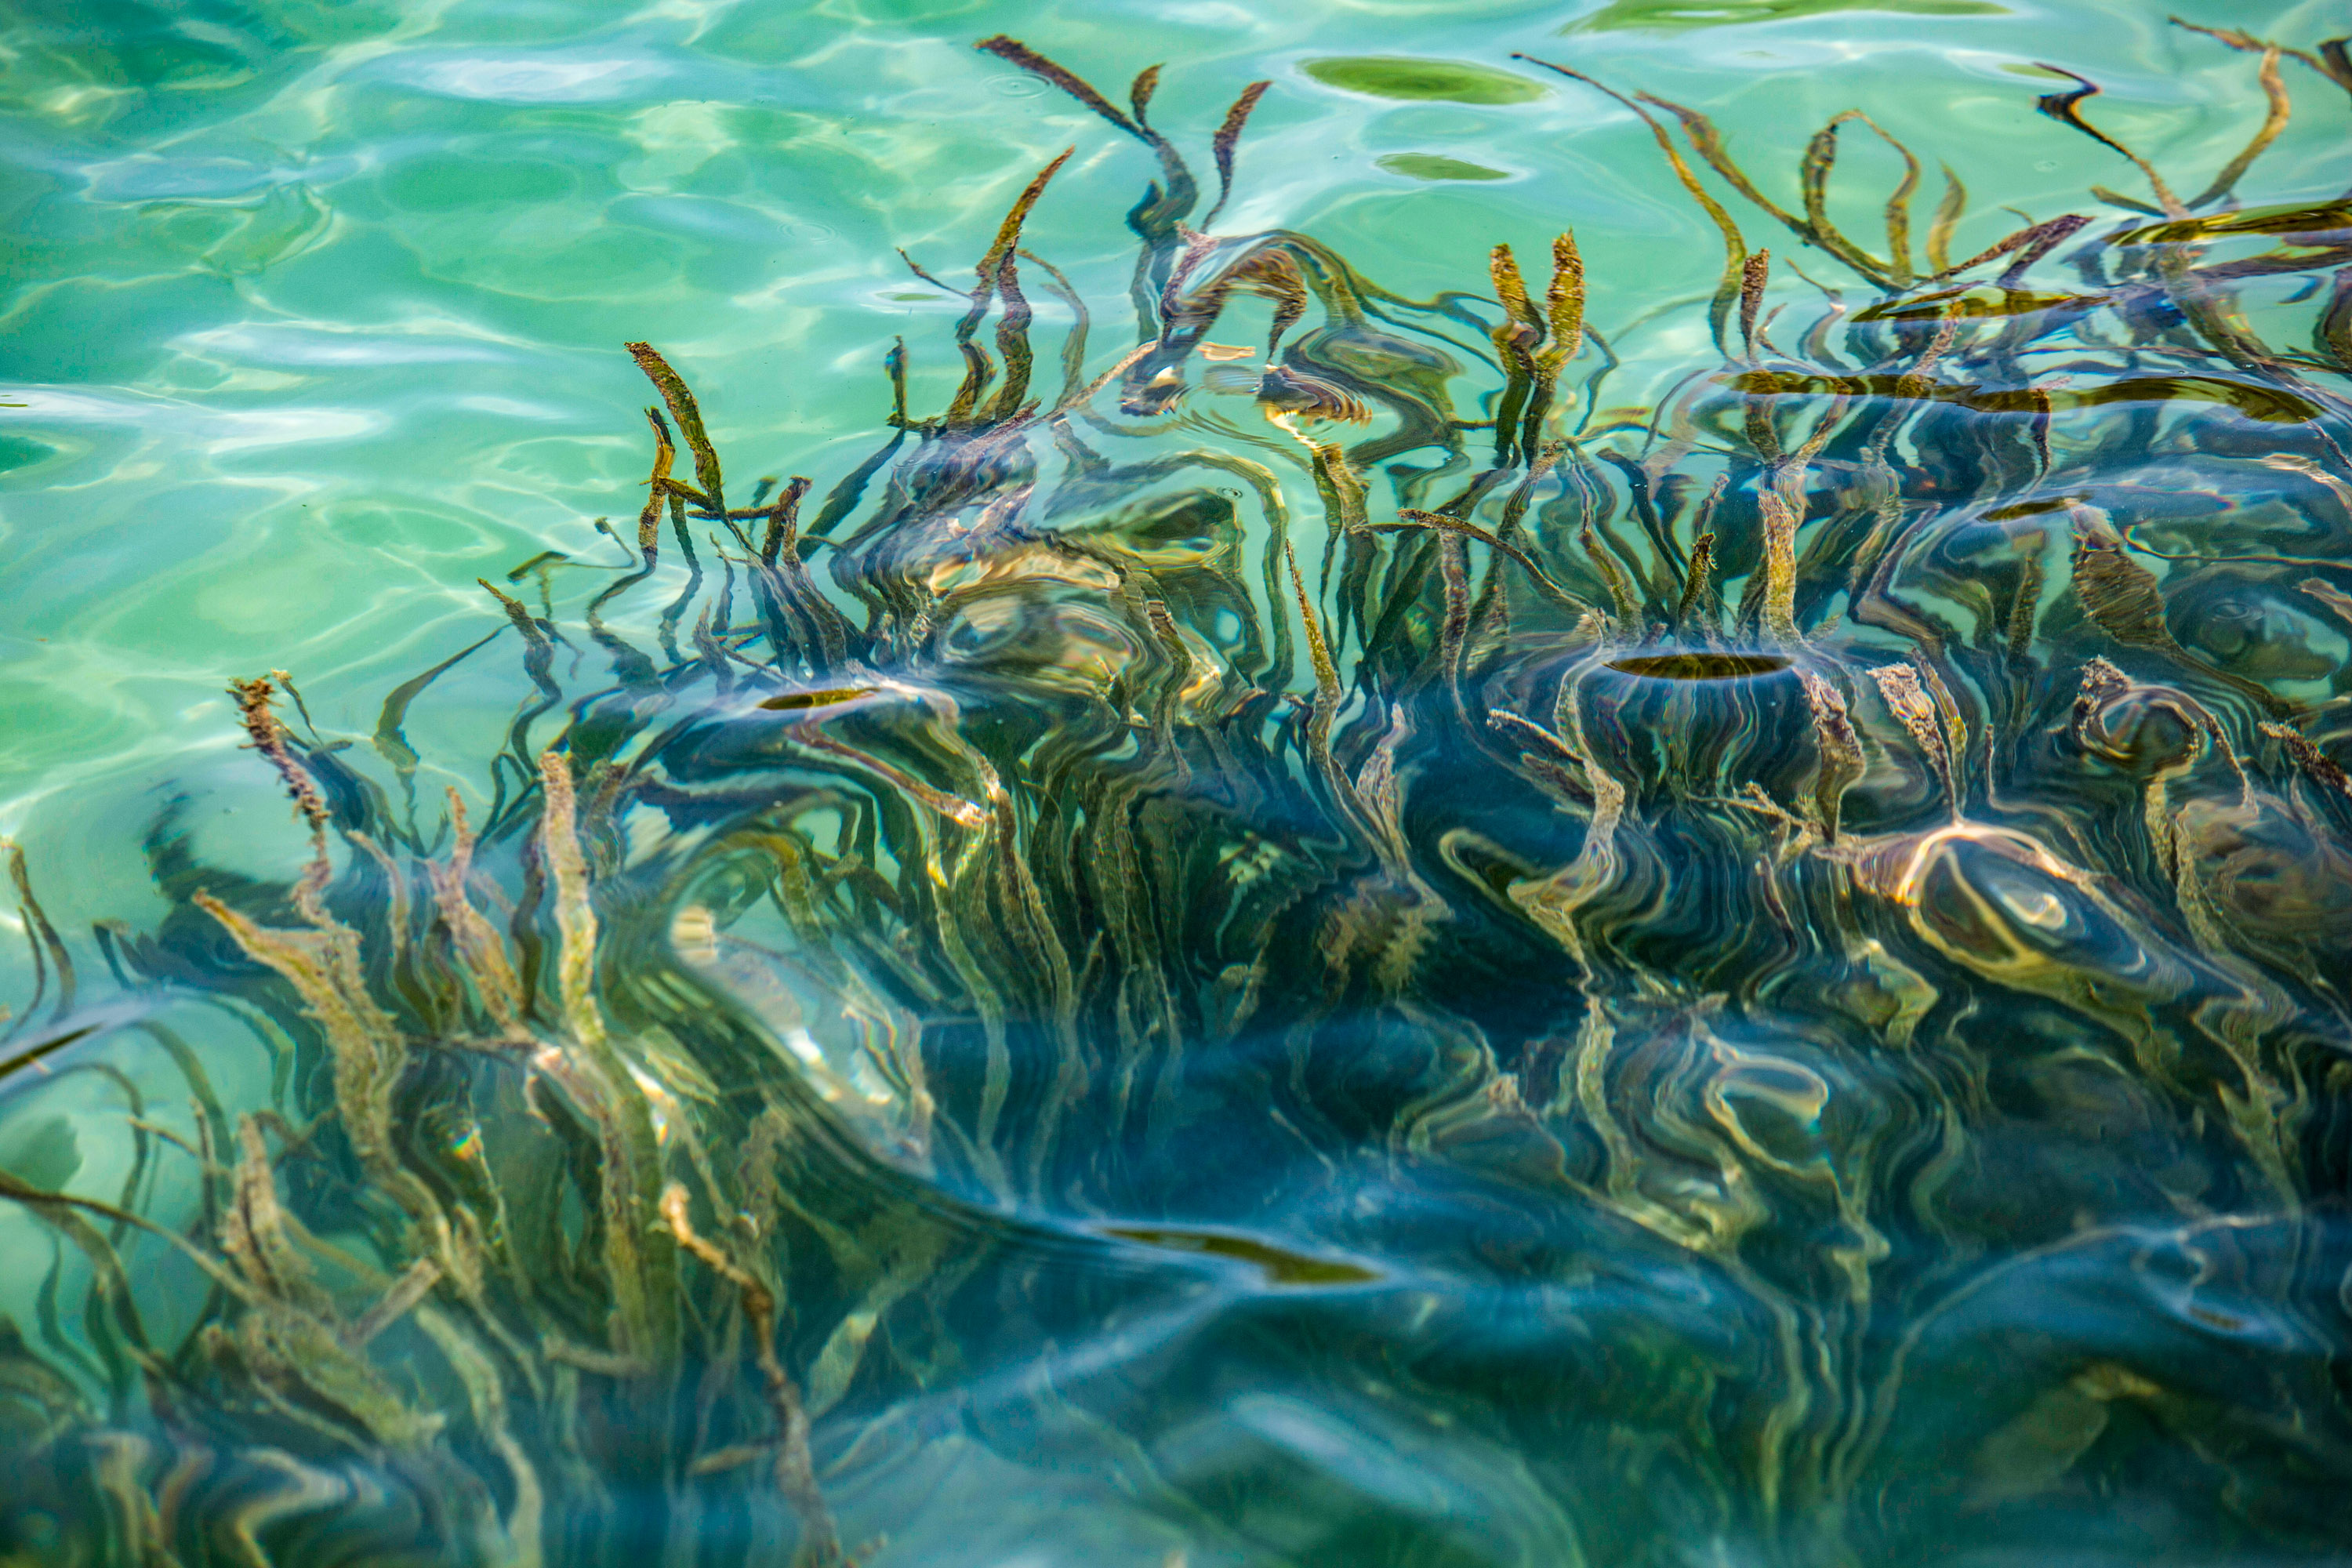
Seagrasses form thick meadows that can run thousands of miles along shallow coastlines, covering up to about 0.2% of the world’s ocean floors.
They provide nutrients and habitat to marine populations, filter pollution, and protectcoastlines.

The plants are photosynthetic, producing the food they need from sunlight, water, and carbon dioxide dissolved in ocean waters.
They store carbon in their biomass and deliver it into the seabed sediments.
They also help capture and bury the carbon in other organic matter that floats past.

Globally, seagrass beds may sequester as much as 8.5 billion tons of organic carbon in seafloor sediments and, to a much, much smaller degree, in their biomass.
On the high end, these meadows draw down and store away about 110 million additional tons each year.

But estimates of the total range and carbon uptake rates of seagrass vary widely.
A key reason is that there is no cheap and easy way to map the planet’s extensive coastlines.
Only about 60% of seagrass meadows have been surveyed in US waters, with “varying degrees of accuracy because of difficulties in remote sensing of underwater habitat,” according to a National Academies study.

 
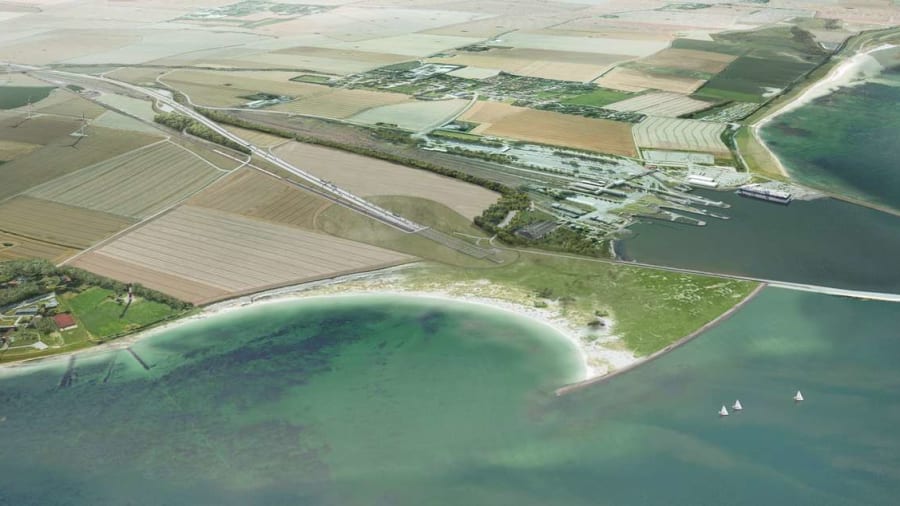
The seagrass meadows along Waecicu Beach in Labuan Bajo, Indonesia.
photo : Agoes Rudianto

Whatever their full expanse, though, we know they are shrinking.
Development, overfishing, and pollution are all destroying coastal ecosystems, which also include carbon-sucking habitats like mangrove forests and salt marshes.
Draining and excavating these shallow biological communities releases hundreds of millions of tons of carbon dioxide each year.
Meanwhile, climate change itself is making ocean waters warmer, more acidic, and deeper, placing greater strains on many of the species.

Nations could help halt or reverse these trends by converting developed shorelines back into natural ones, actively managing and restoring wetlands and seagrass meadows, or planting them in new areas where they may do better as ocean levels rise.

Such work, however, would be wildly expensive.
The question is who would pay for it, particularly if it comes at the expense of lucrative coastal development.

The main possibility is that companies or governments could create market incentives to support preservation and restoration by awarding credits for the additional carbon that seagrass, mangroves, and salt marshes take up and store away.
Tens of billions of dollars’ worth of carbon credits are likely to be traded in voluntary markets in the coming decades, by some estimates.

The carbon market registry Verra has already developed a methodology for calculating the carbon credits earned through such work.
At least one seagrass project has applied to earn credits: a long-running effort by the Nature Conservancy’s Virginia chapter to plant eelgrass around the Virginia Barrier Islands.

But some marine scientists and carbon market experts argue that there need to be more rigorous ways to ensure that these efforts are removing as much carbon as they claim.
Otherwise, we risk allowing people or businesses to buy and sell carbon credits without meaningfully helping the climate.

Diving in


Tidal began exploring whether its tools could be used for seagrass late last year, as a growing body of studies underscored the need for carbon removal and highlighted the potential role of ocean-based approaches.

“We started to double-click and read a lot of studies,” Davé says.
“And found out, ‘Wow, we do have some technology we’ve developed that could be applicable here.’”

The team eventually held a series of conversations with researchers at the Commonwealth Scientific and Industrial Research Organisation (CSIRO), an Australian government science agency that has long used drones, satellites, acoustic positioning systems, and other equipment to survey coral reefs, mangrove forests, and seagrass meadows across the Indo-Pacific.

Seagrass is particularly difficult to map on large scales because in satellite images it’s difficult to distinguish from other dark spots in shallow waters, says Andy Steven, a marine scientist who oversees coastal research efforts at CSIRO.
 
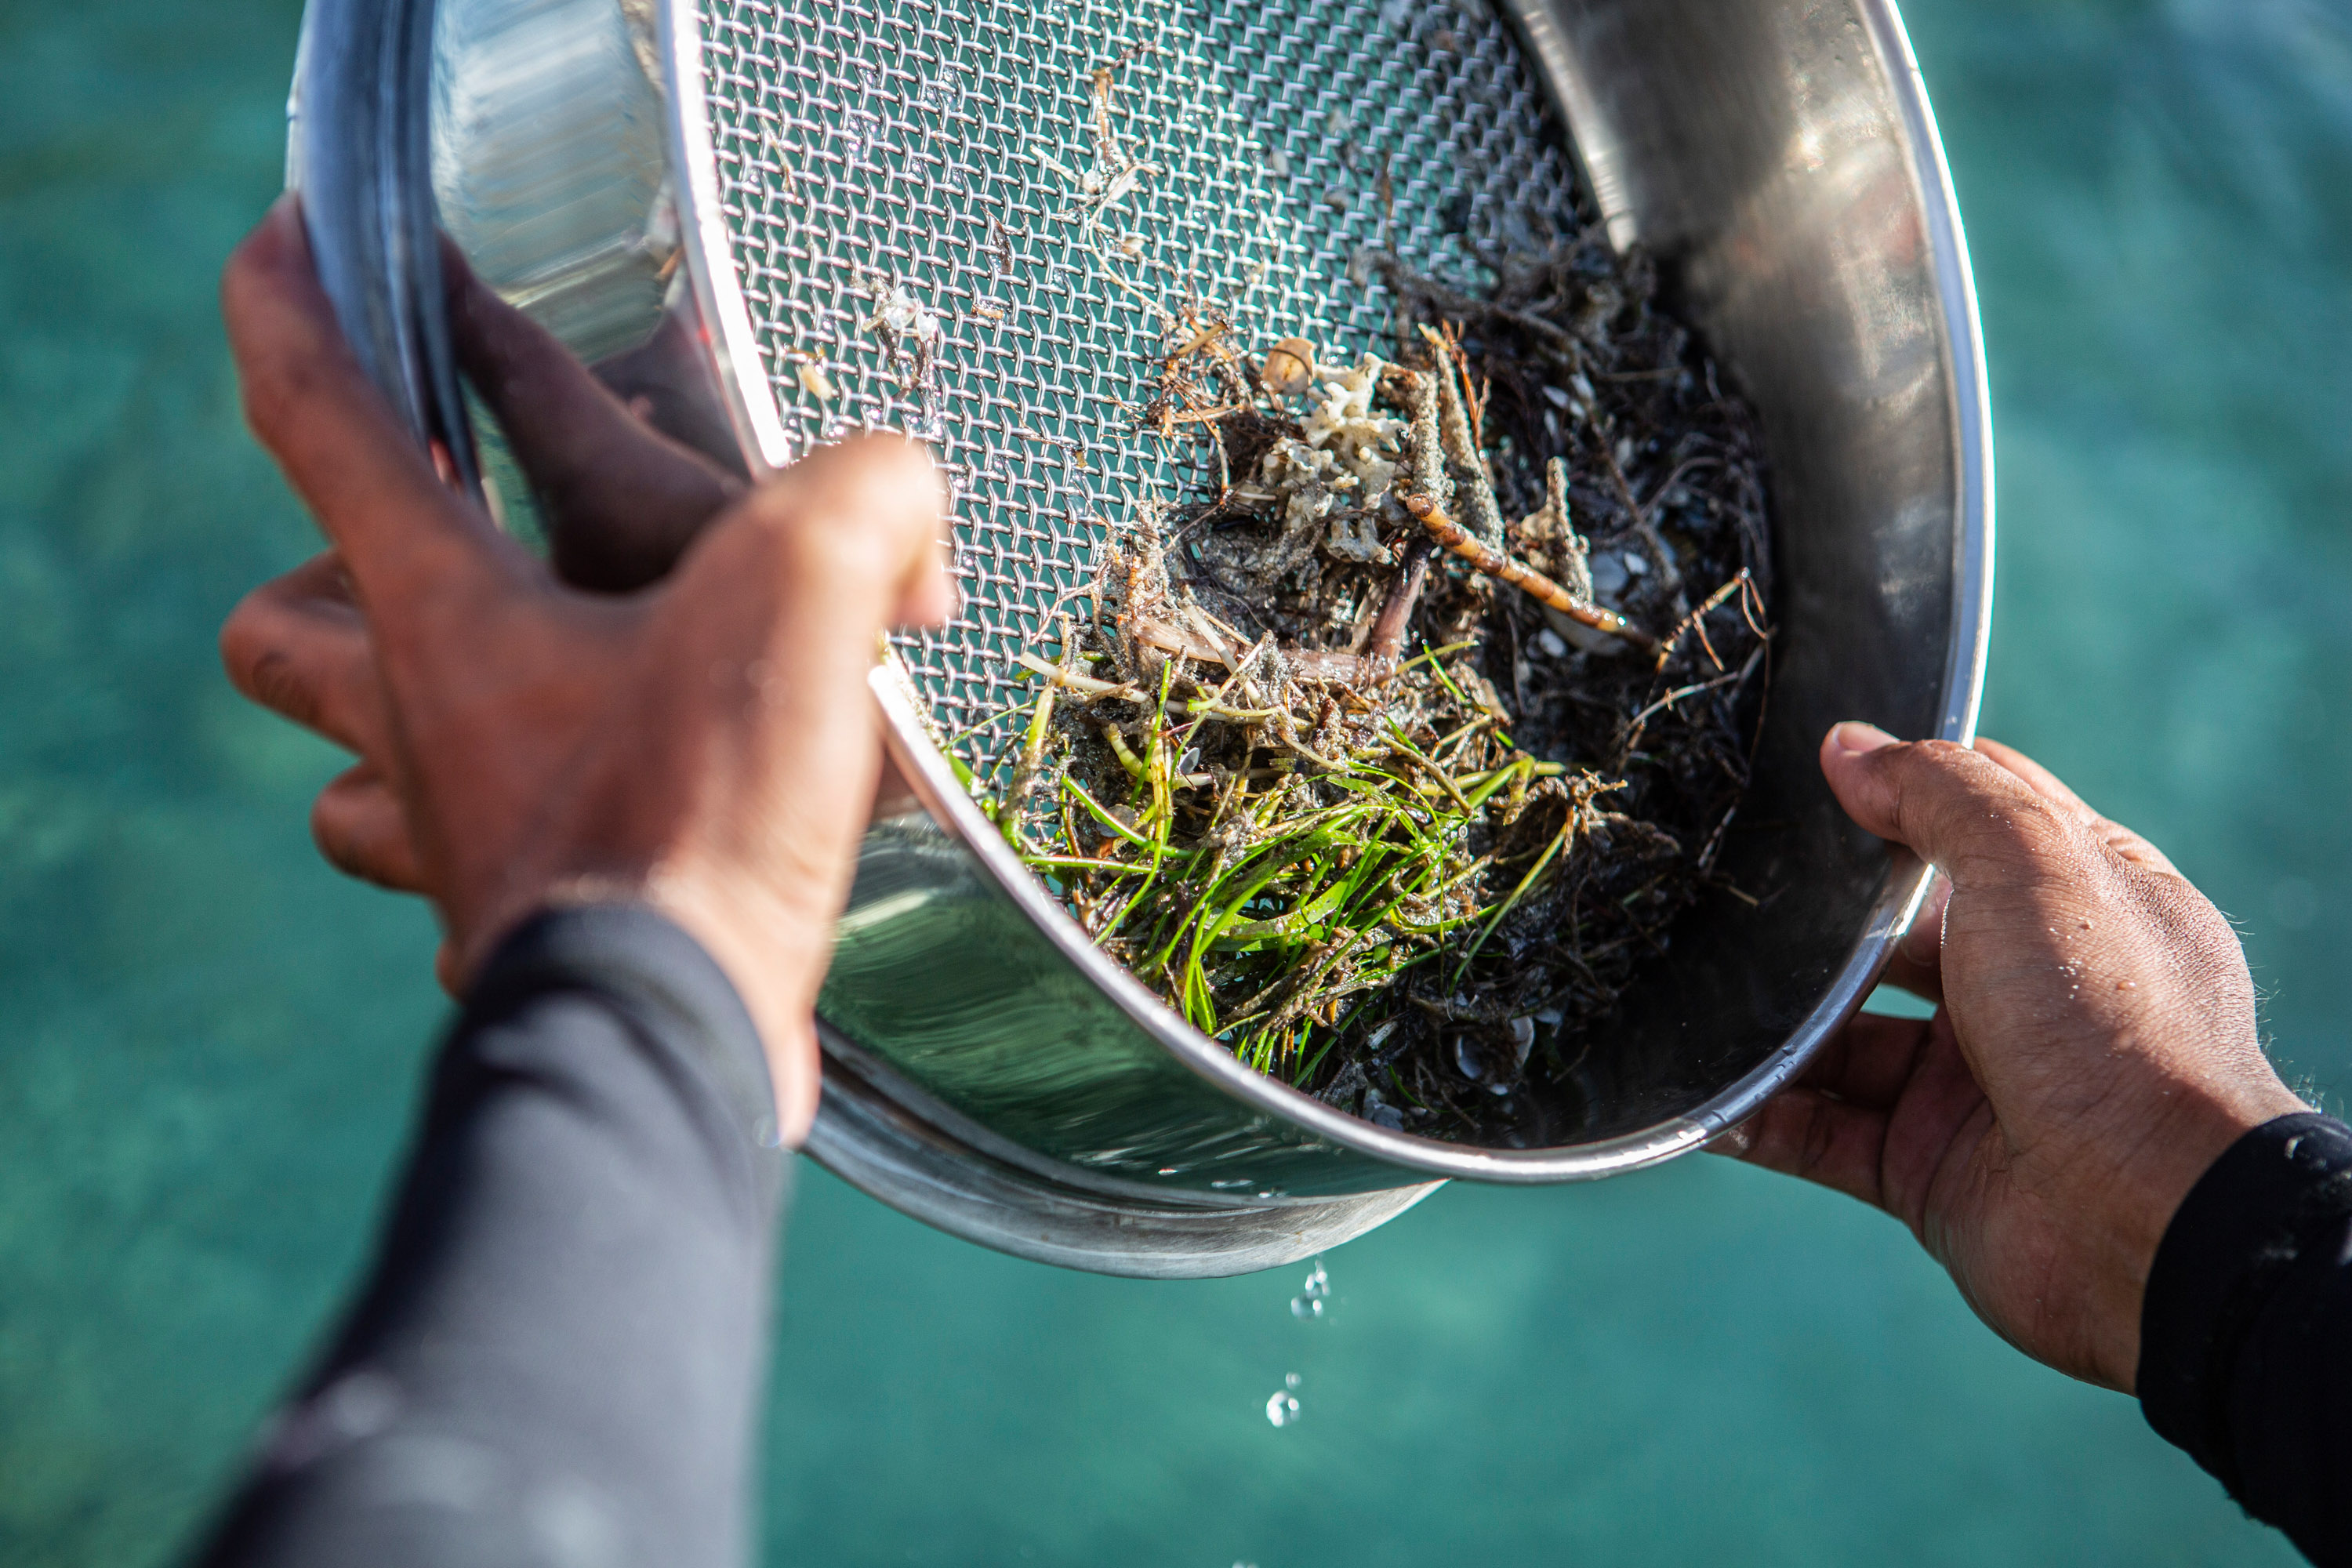
Andy Steven, a marine scientist with Australia's Commonwealth Scientific and Industrial Research Organisation, shows a seagrass sample excavated from meadows along Labuan Bajo, Indonesia. 
photo : Agoes Rudianto


photo : Agoes Rudianto


photo : Agoes Rudianto

Researchers with the Commonwealth Scientific and Industrial Research Organisation pull up and examine seagrass and sediments from research plots.

“The world needs to move to being able to map and then measure change on a far more frequent basis,” Steven says.
“I see the Tidal technology being part of an arsenal of methods that help us rapidly survey, process, and deliver information to decision makers on the time frames that are needed.
It is addressing a really fundamental issue.”

CSIRO agreed to help Tidal test how well its system works.
They collaborated on an earlier field trial off the coast of Fiji this summer and on the subsequent experiment this September in Indonesia.
The latter country's thousands of islands boast one of the world’s largest and most diverse expanses of seagrass meadows.

For the first effort, Tidal opted to couple its software with an off-the-shelf autonomous underwater vehicle equipped with a basic camera.
The hope was that if the researchers could scan meadows using standard hardware, their general approach would be more widely accessible.

It didn’t work.
The seagrass was taller and the tides were lower than expected.
The thruster and rudder quickly got clogged up with seaweed, forcing the team to stop every few minutes, Bahman says.

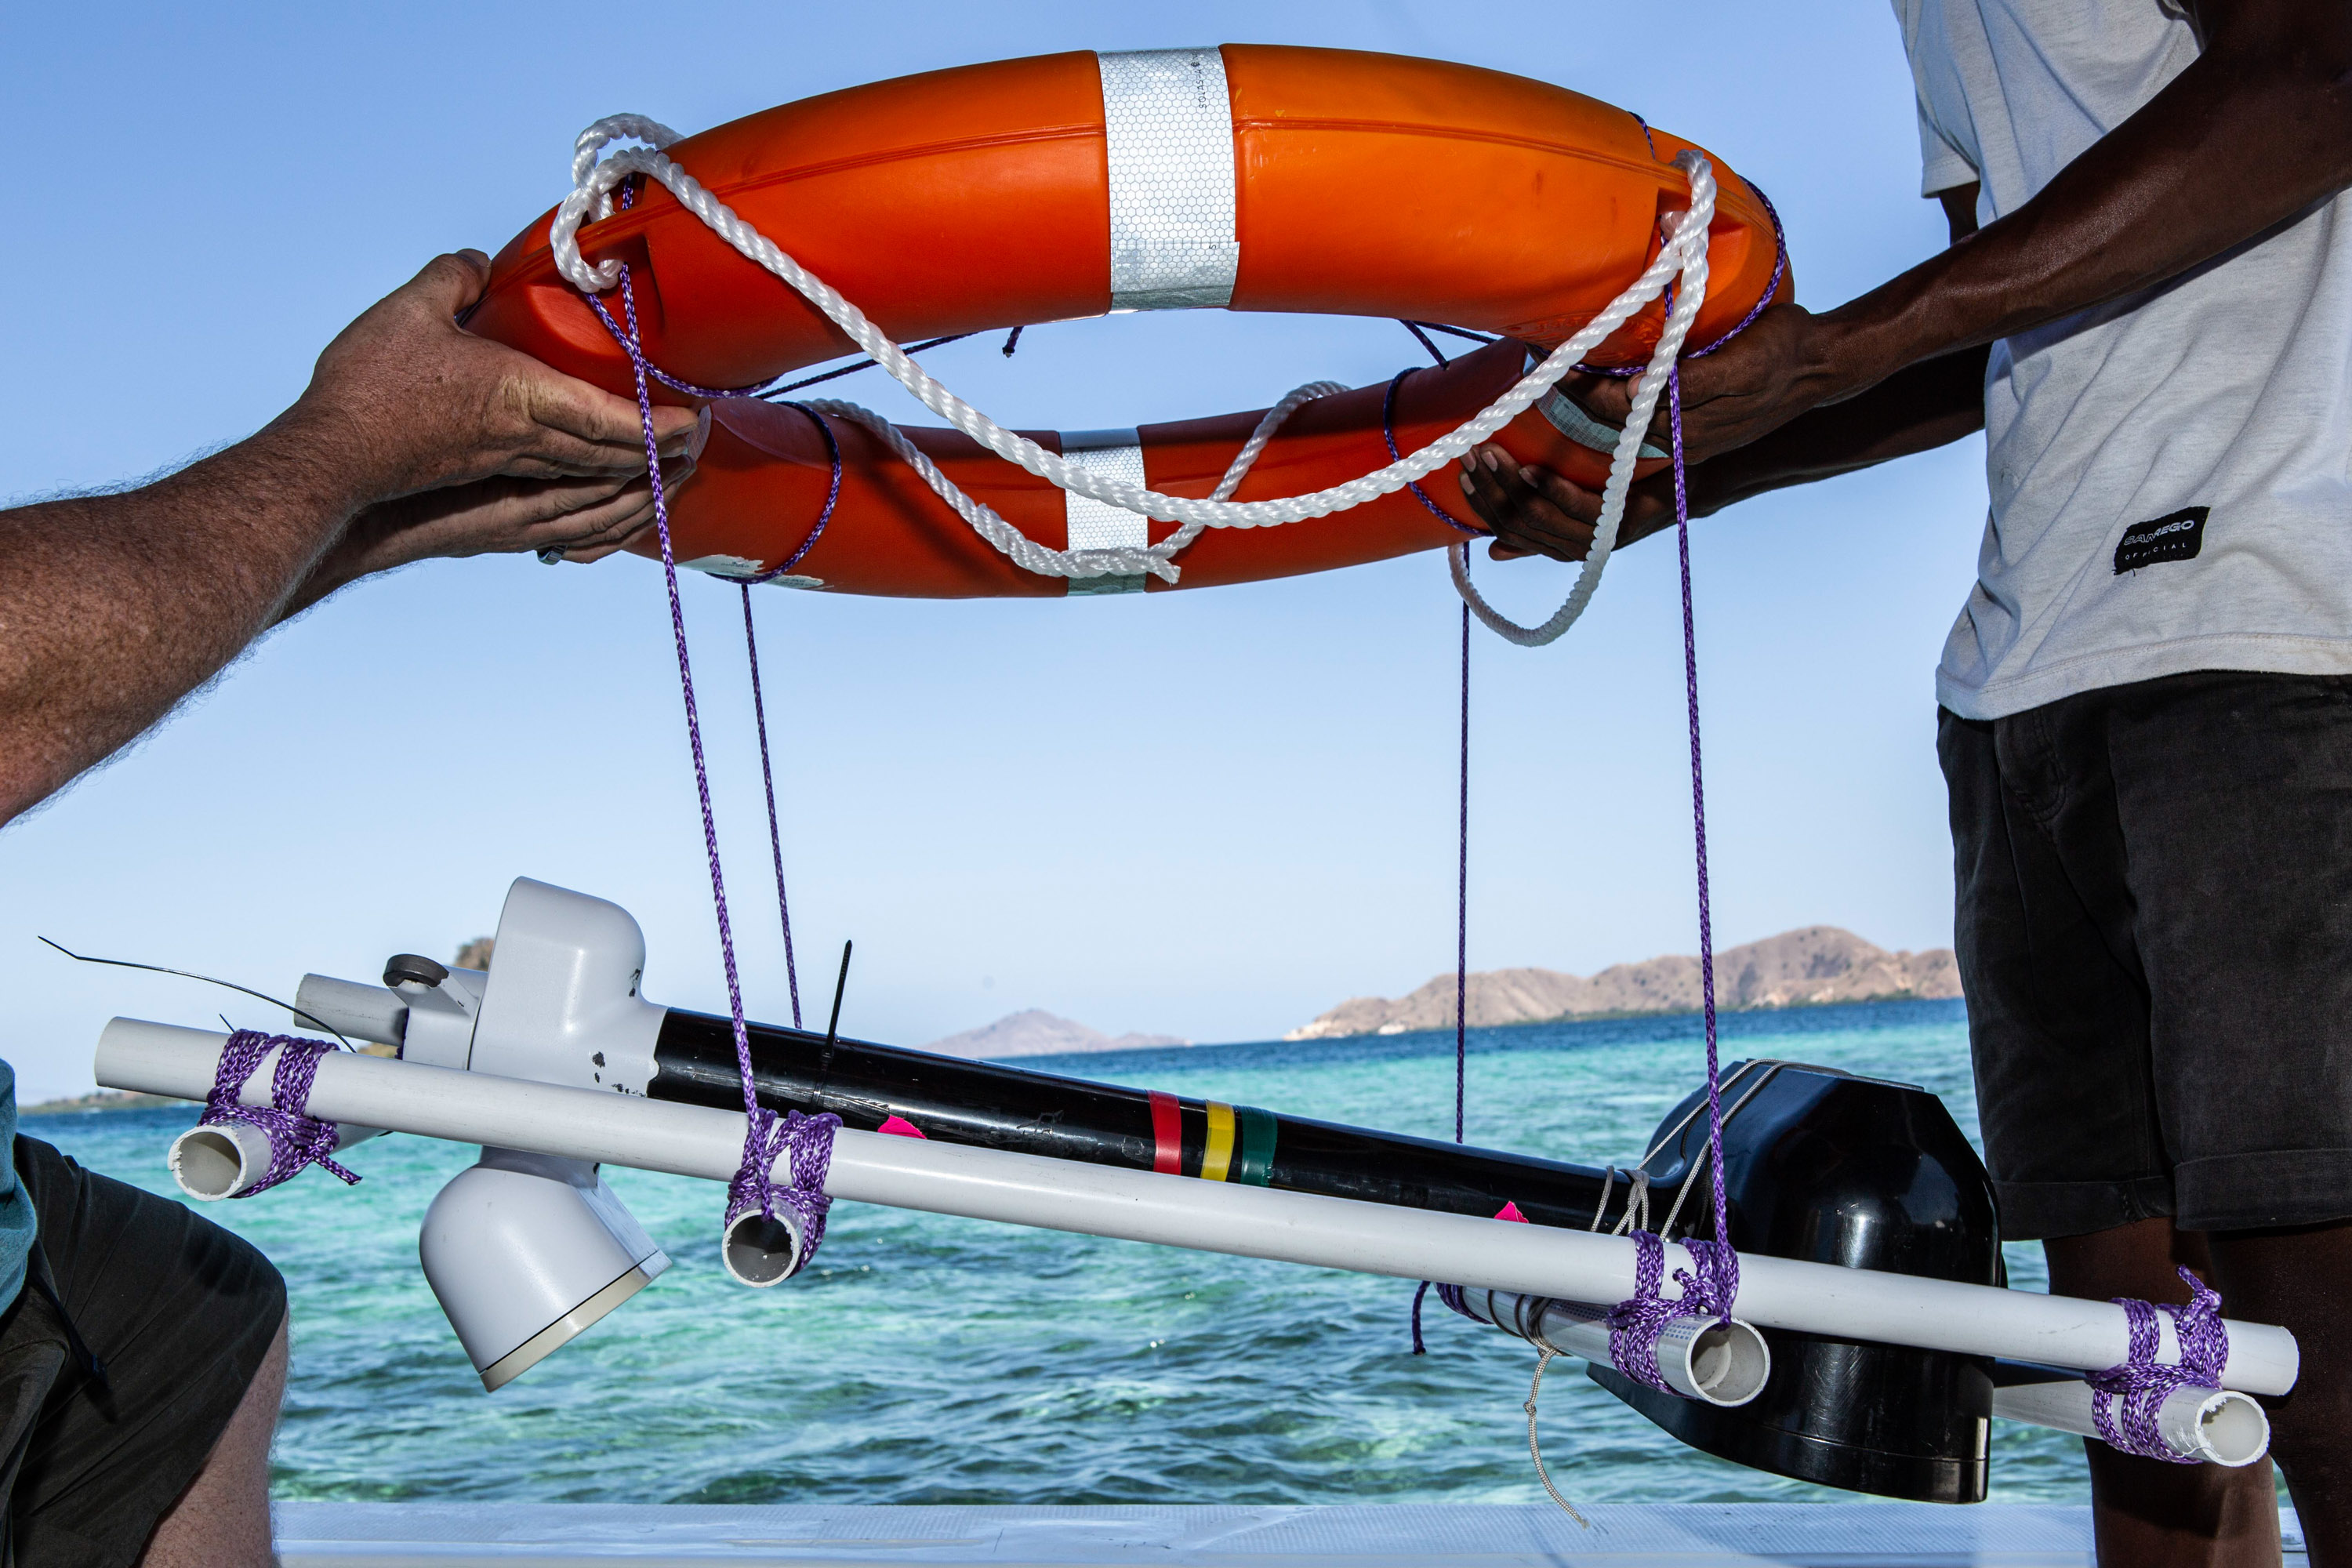
After a brainstorming whiteboard session, the Tidal team decided to take its own camera system, turn it face down, and put it on a float that could be pulled along by a boat.
The so-called Hammersled is equipped with fins to keep it moving straight and a set of ropes and cleats that allow the researchers to dip the camera deeper into the water.


photo : Winni Wintermeyer


photo : Winni Wintermeyer


WINNI WINTERMEYER


photo : Winni Wintermeyer

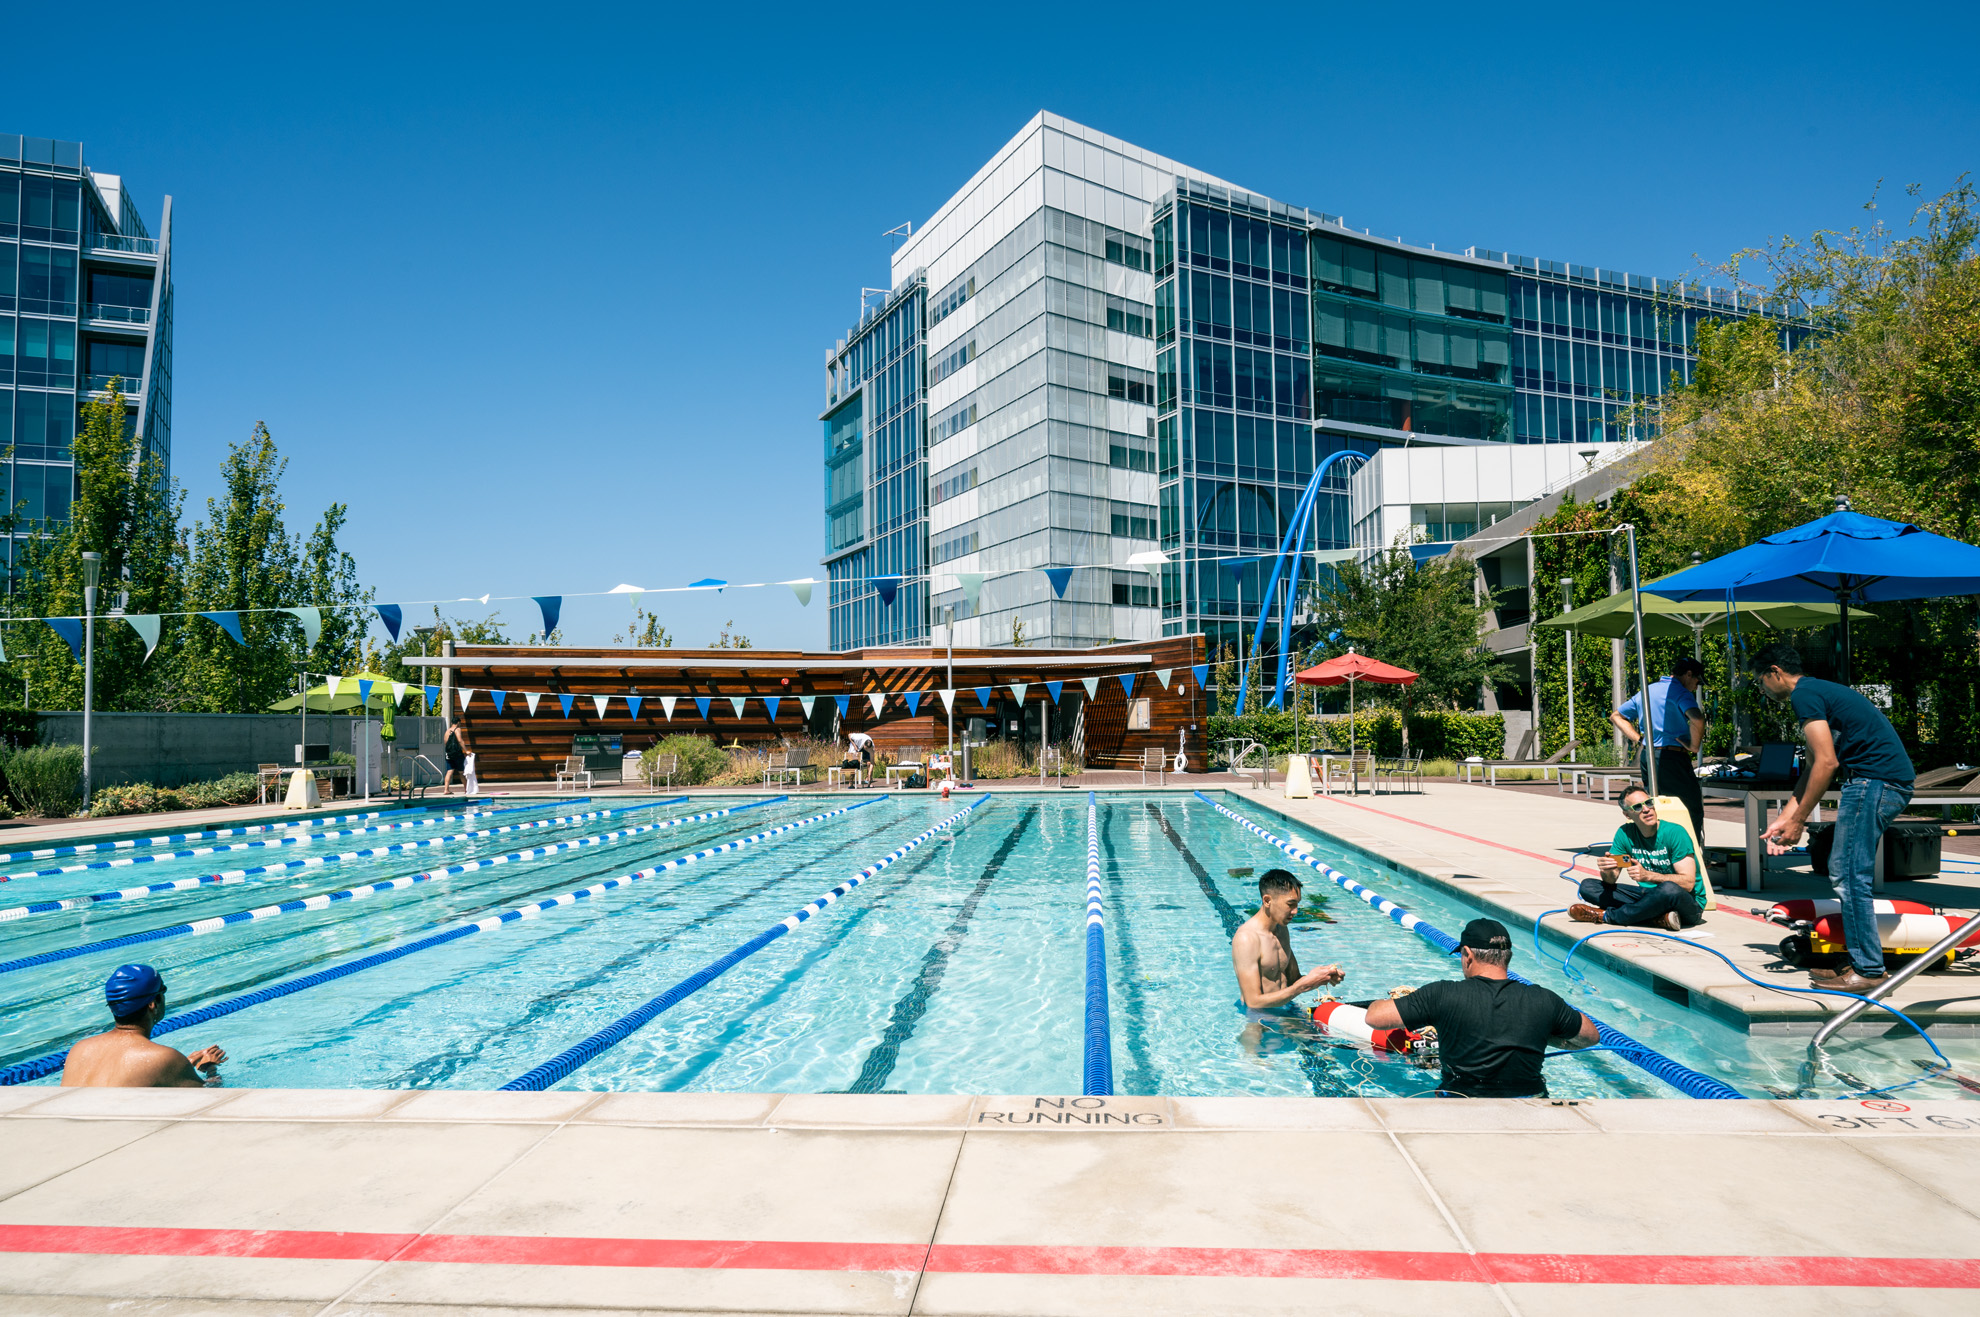
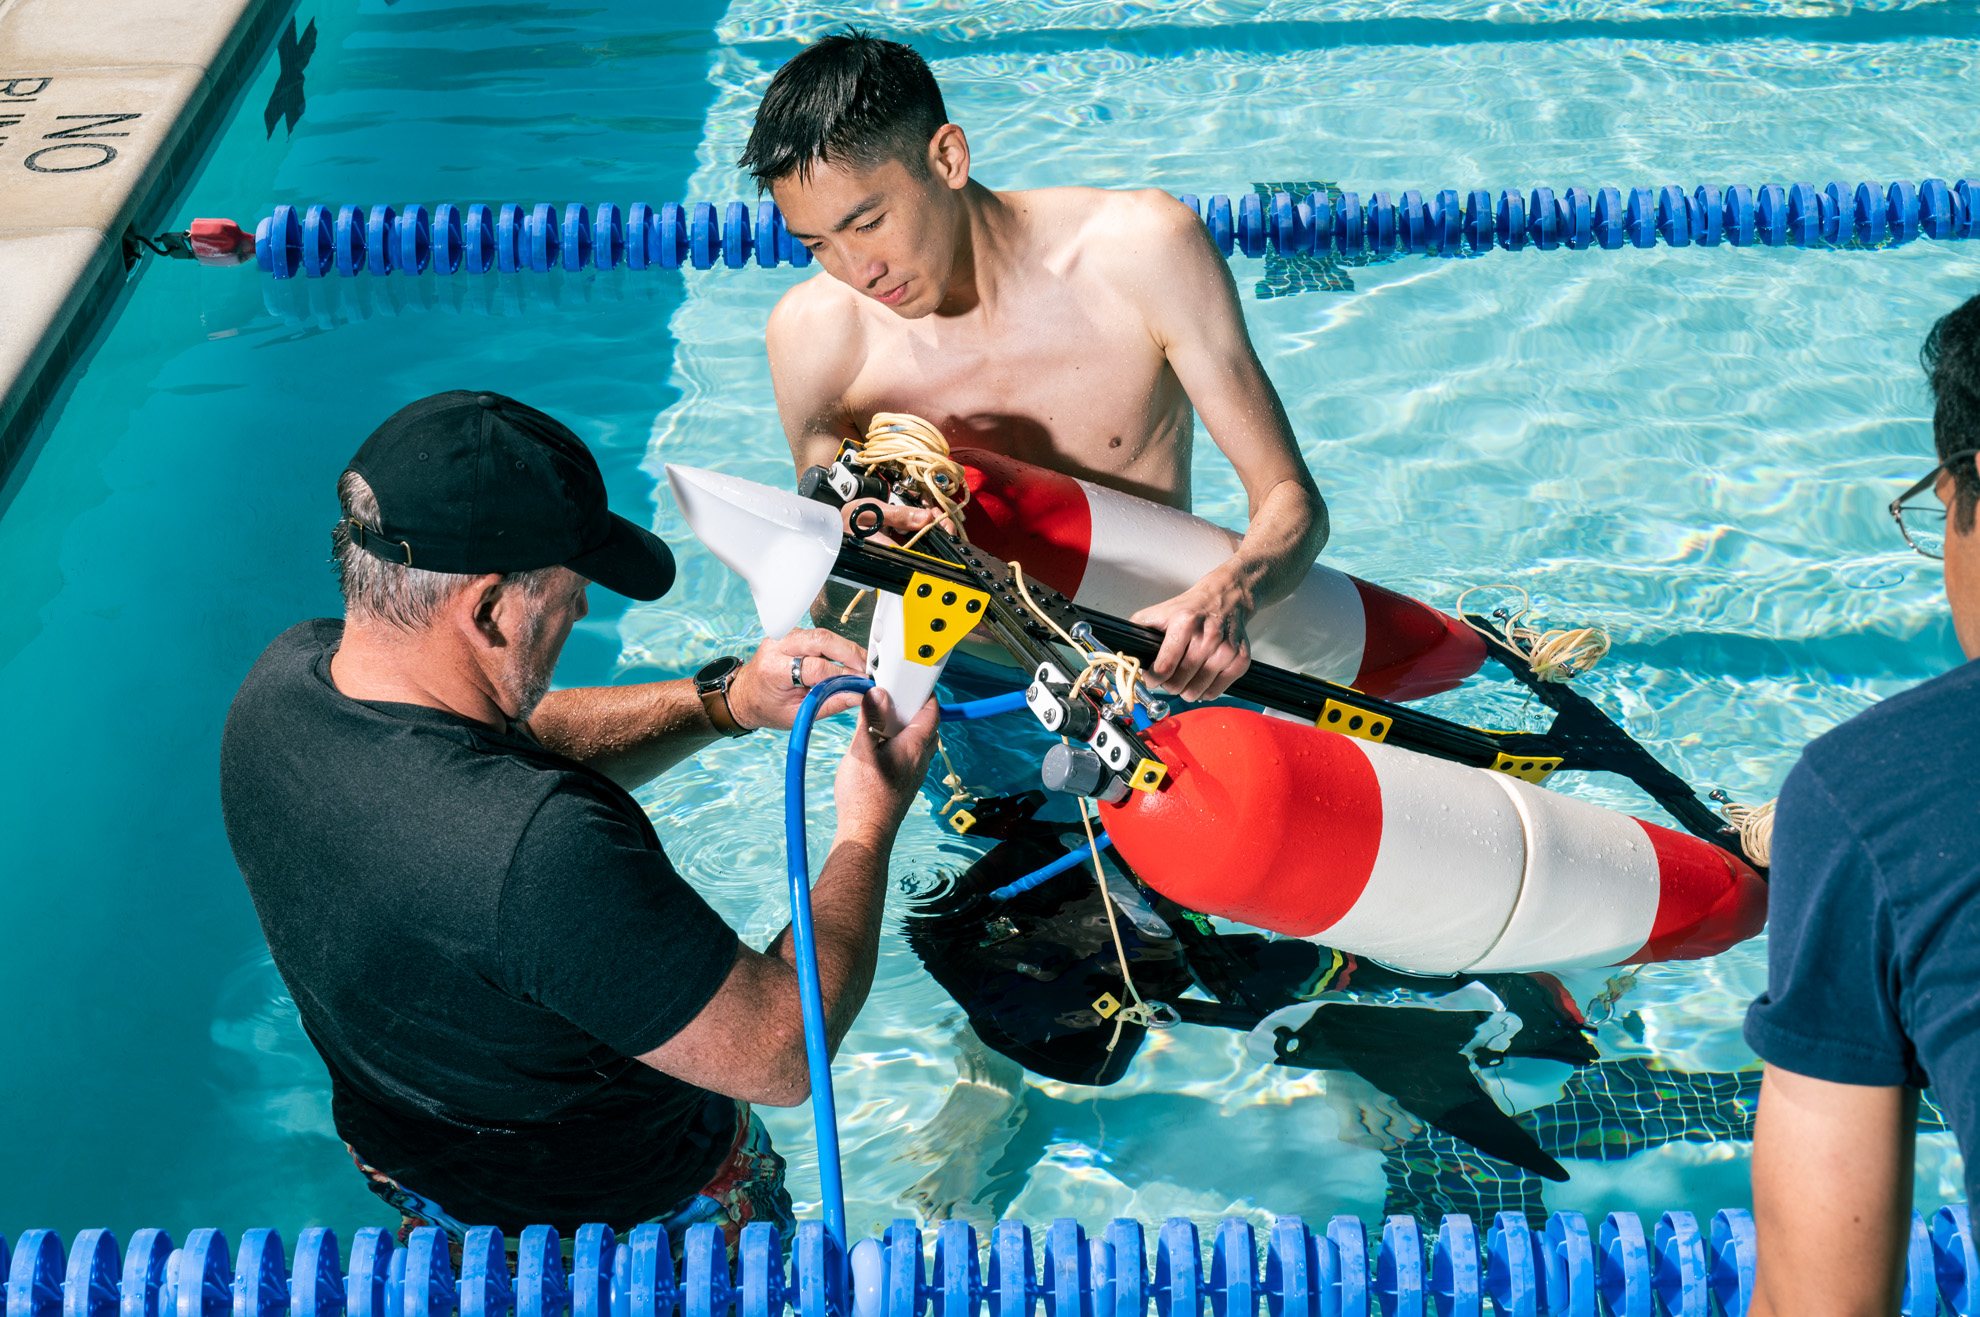
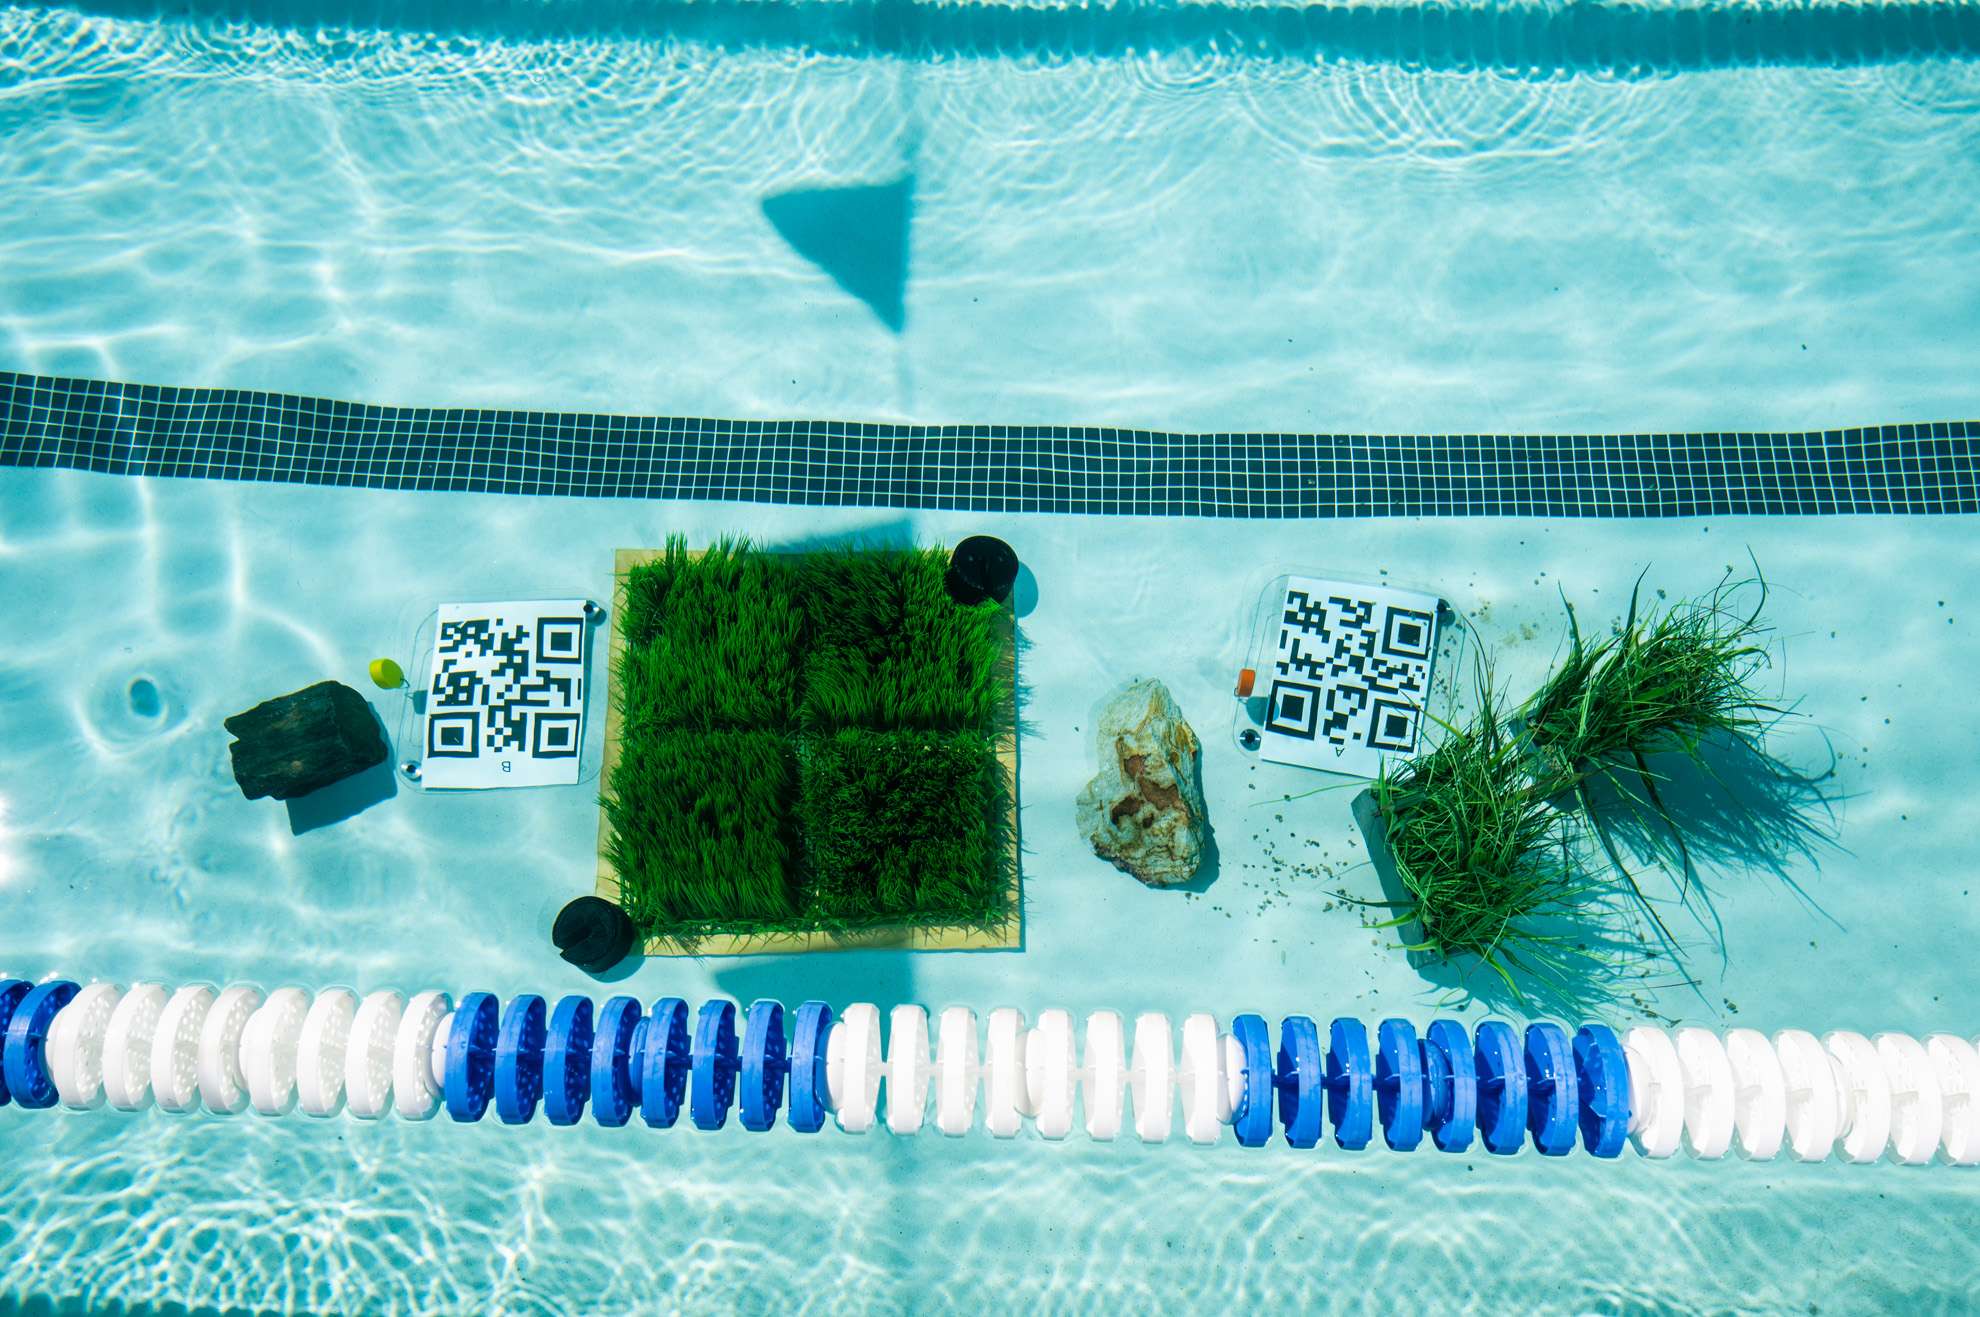
Tidal's researchers test out the "Hammersled" at a pool in the middle of Alphabet’s campus in Sunnyvale, California, by pulling it over patches of plastic seagrass.

The system worked well enough during a few tests in a large pool in the middle of Alphabet’s campus in Sunnyvale, California, where team members pulled it by hand over patches of plastic seagrass on the bottom.

The bigger test, however, is whether Tidal can translate its maps into an accurate estimate of the carbon seagrass holds and buries in the seafloor.

‘We’ve got it’


After Steven and his colleagues arrived in Labuan Bajo, on the western tip of Flores, they rented a 14-cabin liveaboard, the Sea Safari VII, and began sailing around the islands.
They launched surveillance drones from the deck to search for promising seagrass beds to study, prioritizing sites with many different species to help train Tidal’s models and algorithms for the wide variability that occurs in the natural world.

Once the CSIRO researchers selected, measured, tagged, filmed, and photographed their 100-meter transects, the Tidal team passed through.

They used a little Indonesian fishing boat to pull along the Hammersled.
Bahman, software engineer Hector Yee, and other staffers took turns jumping into the water with goggles and flippers to clasp a pontoon and keep the camera pointed straight as they crisscrossed the test area.

Once the process was complete, the CSIRO researchers used spades, peat borers, and other tools to pull up the seagrass and deep sediments from one-meter square study plots.

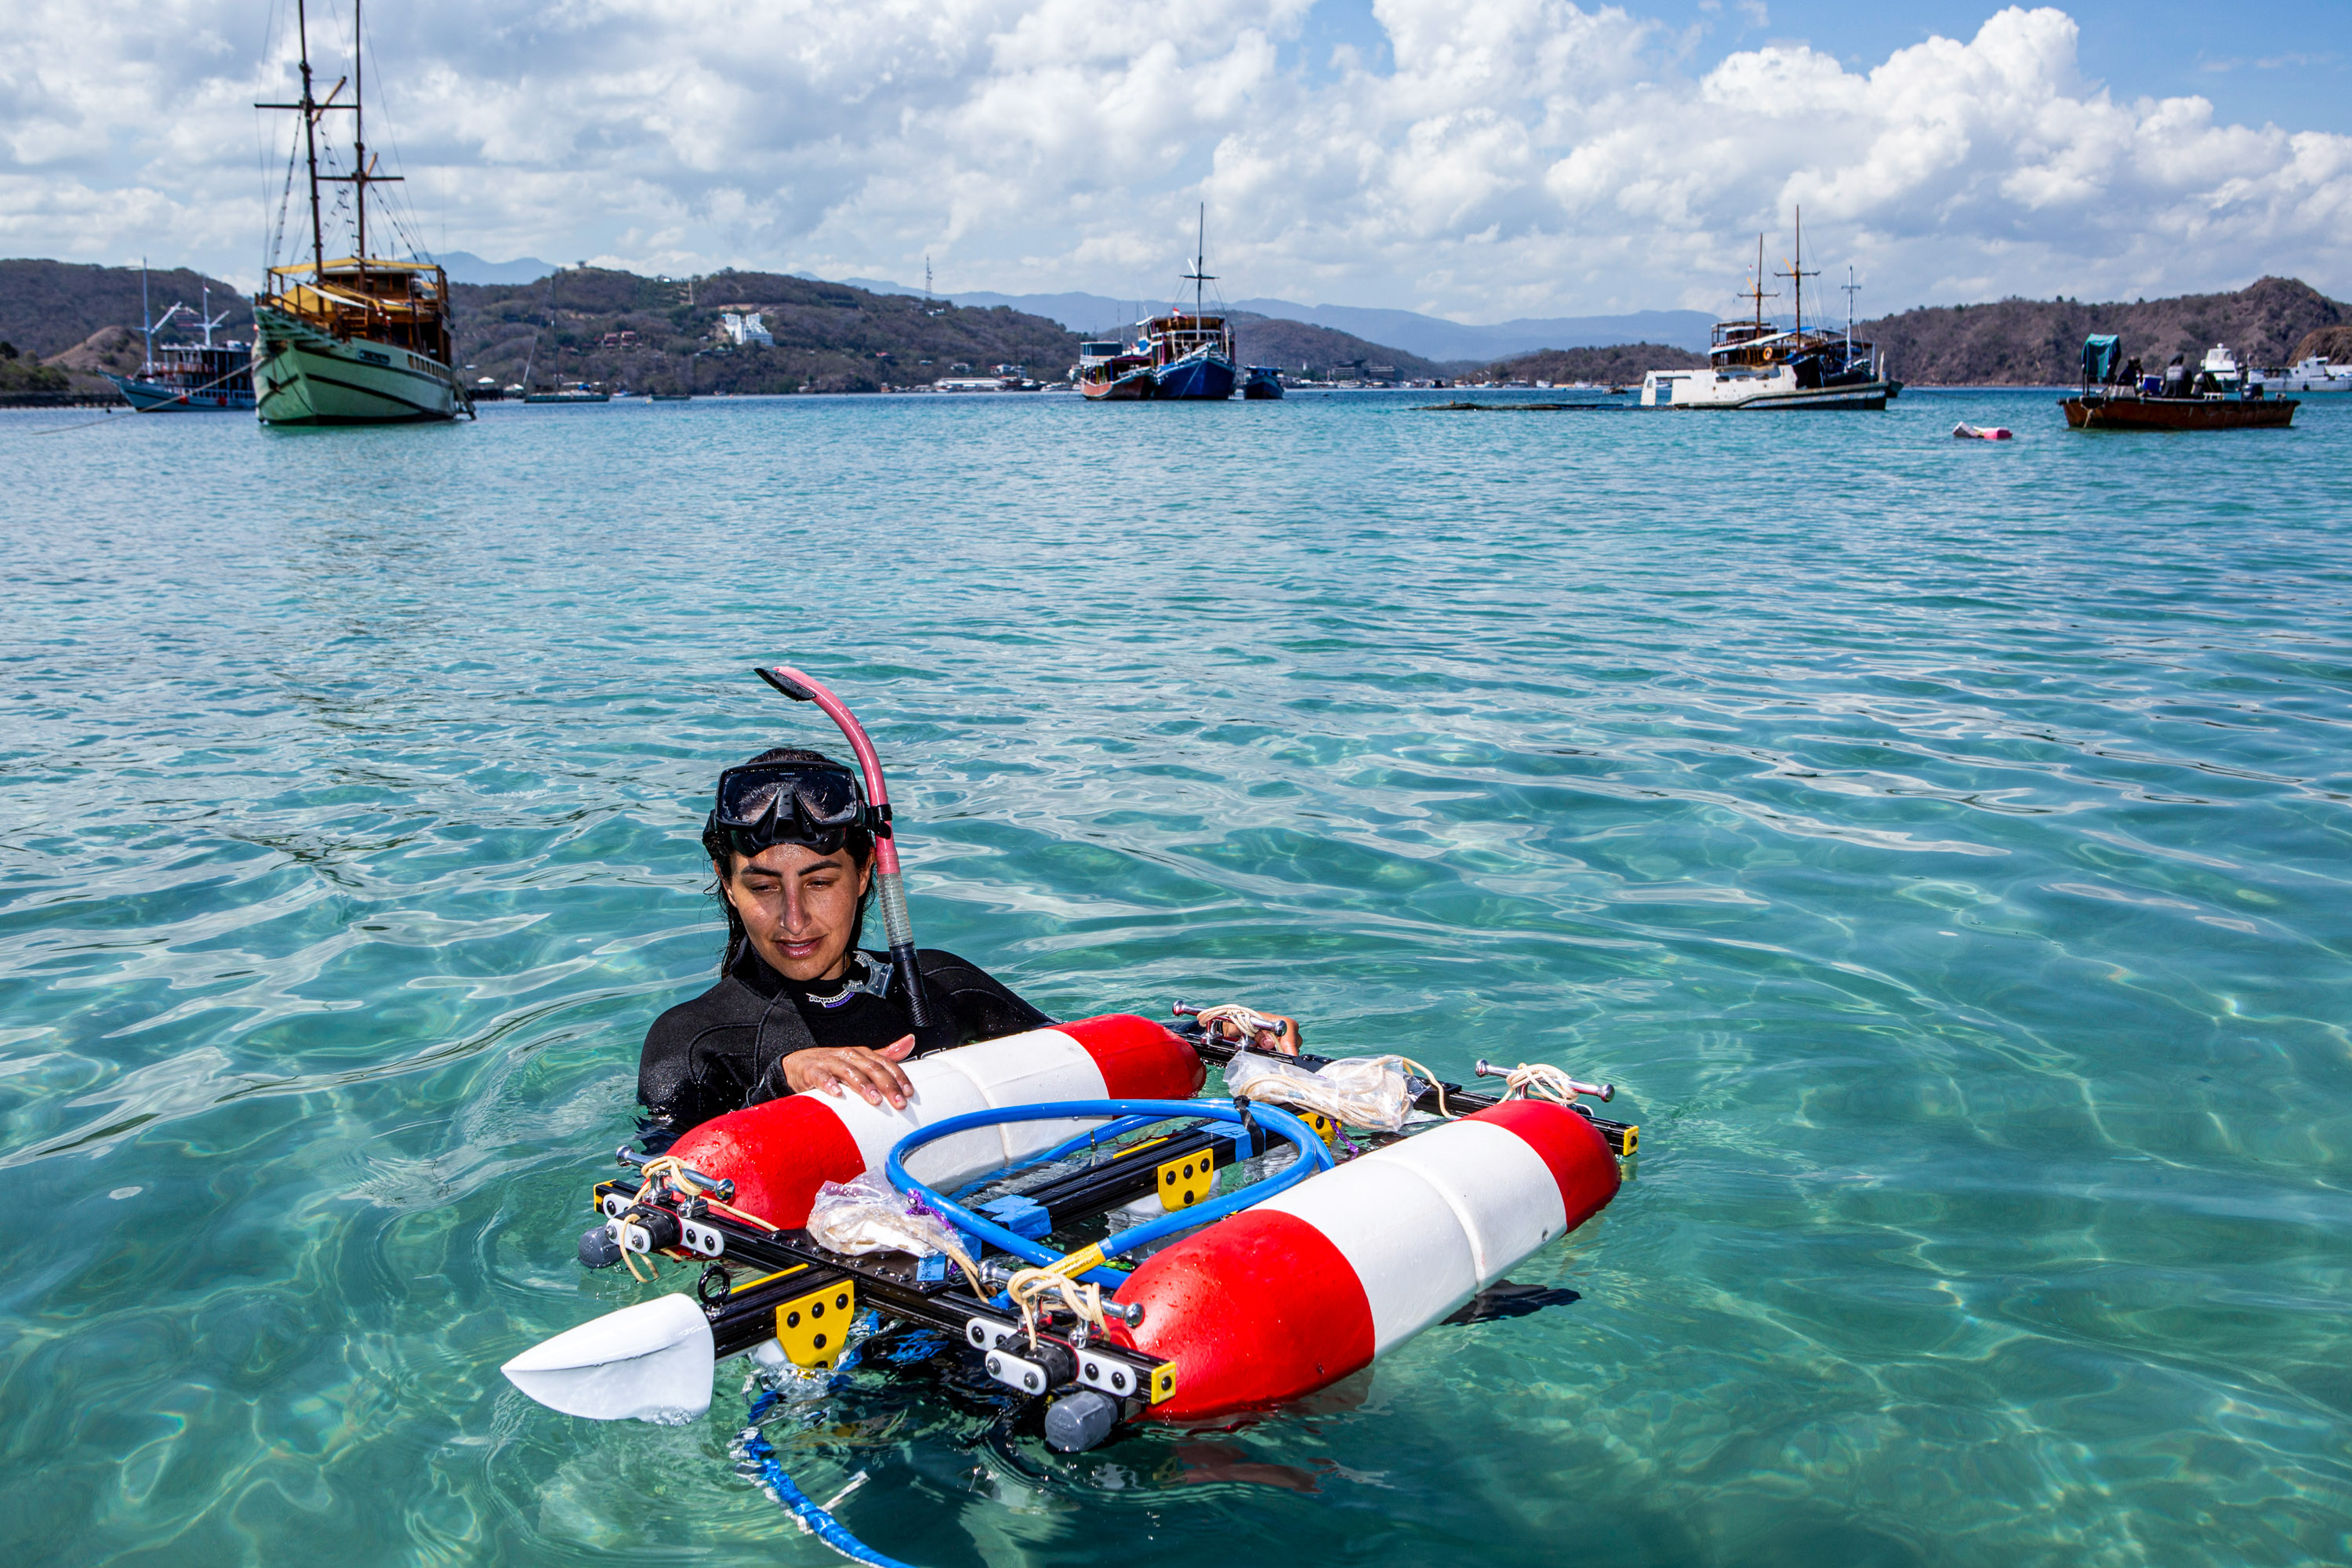
Bianca Bahman, a product manager at Tidal, steers the camera system over seagrass. 
photo : Agoes Rudianto

 
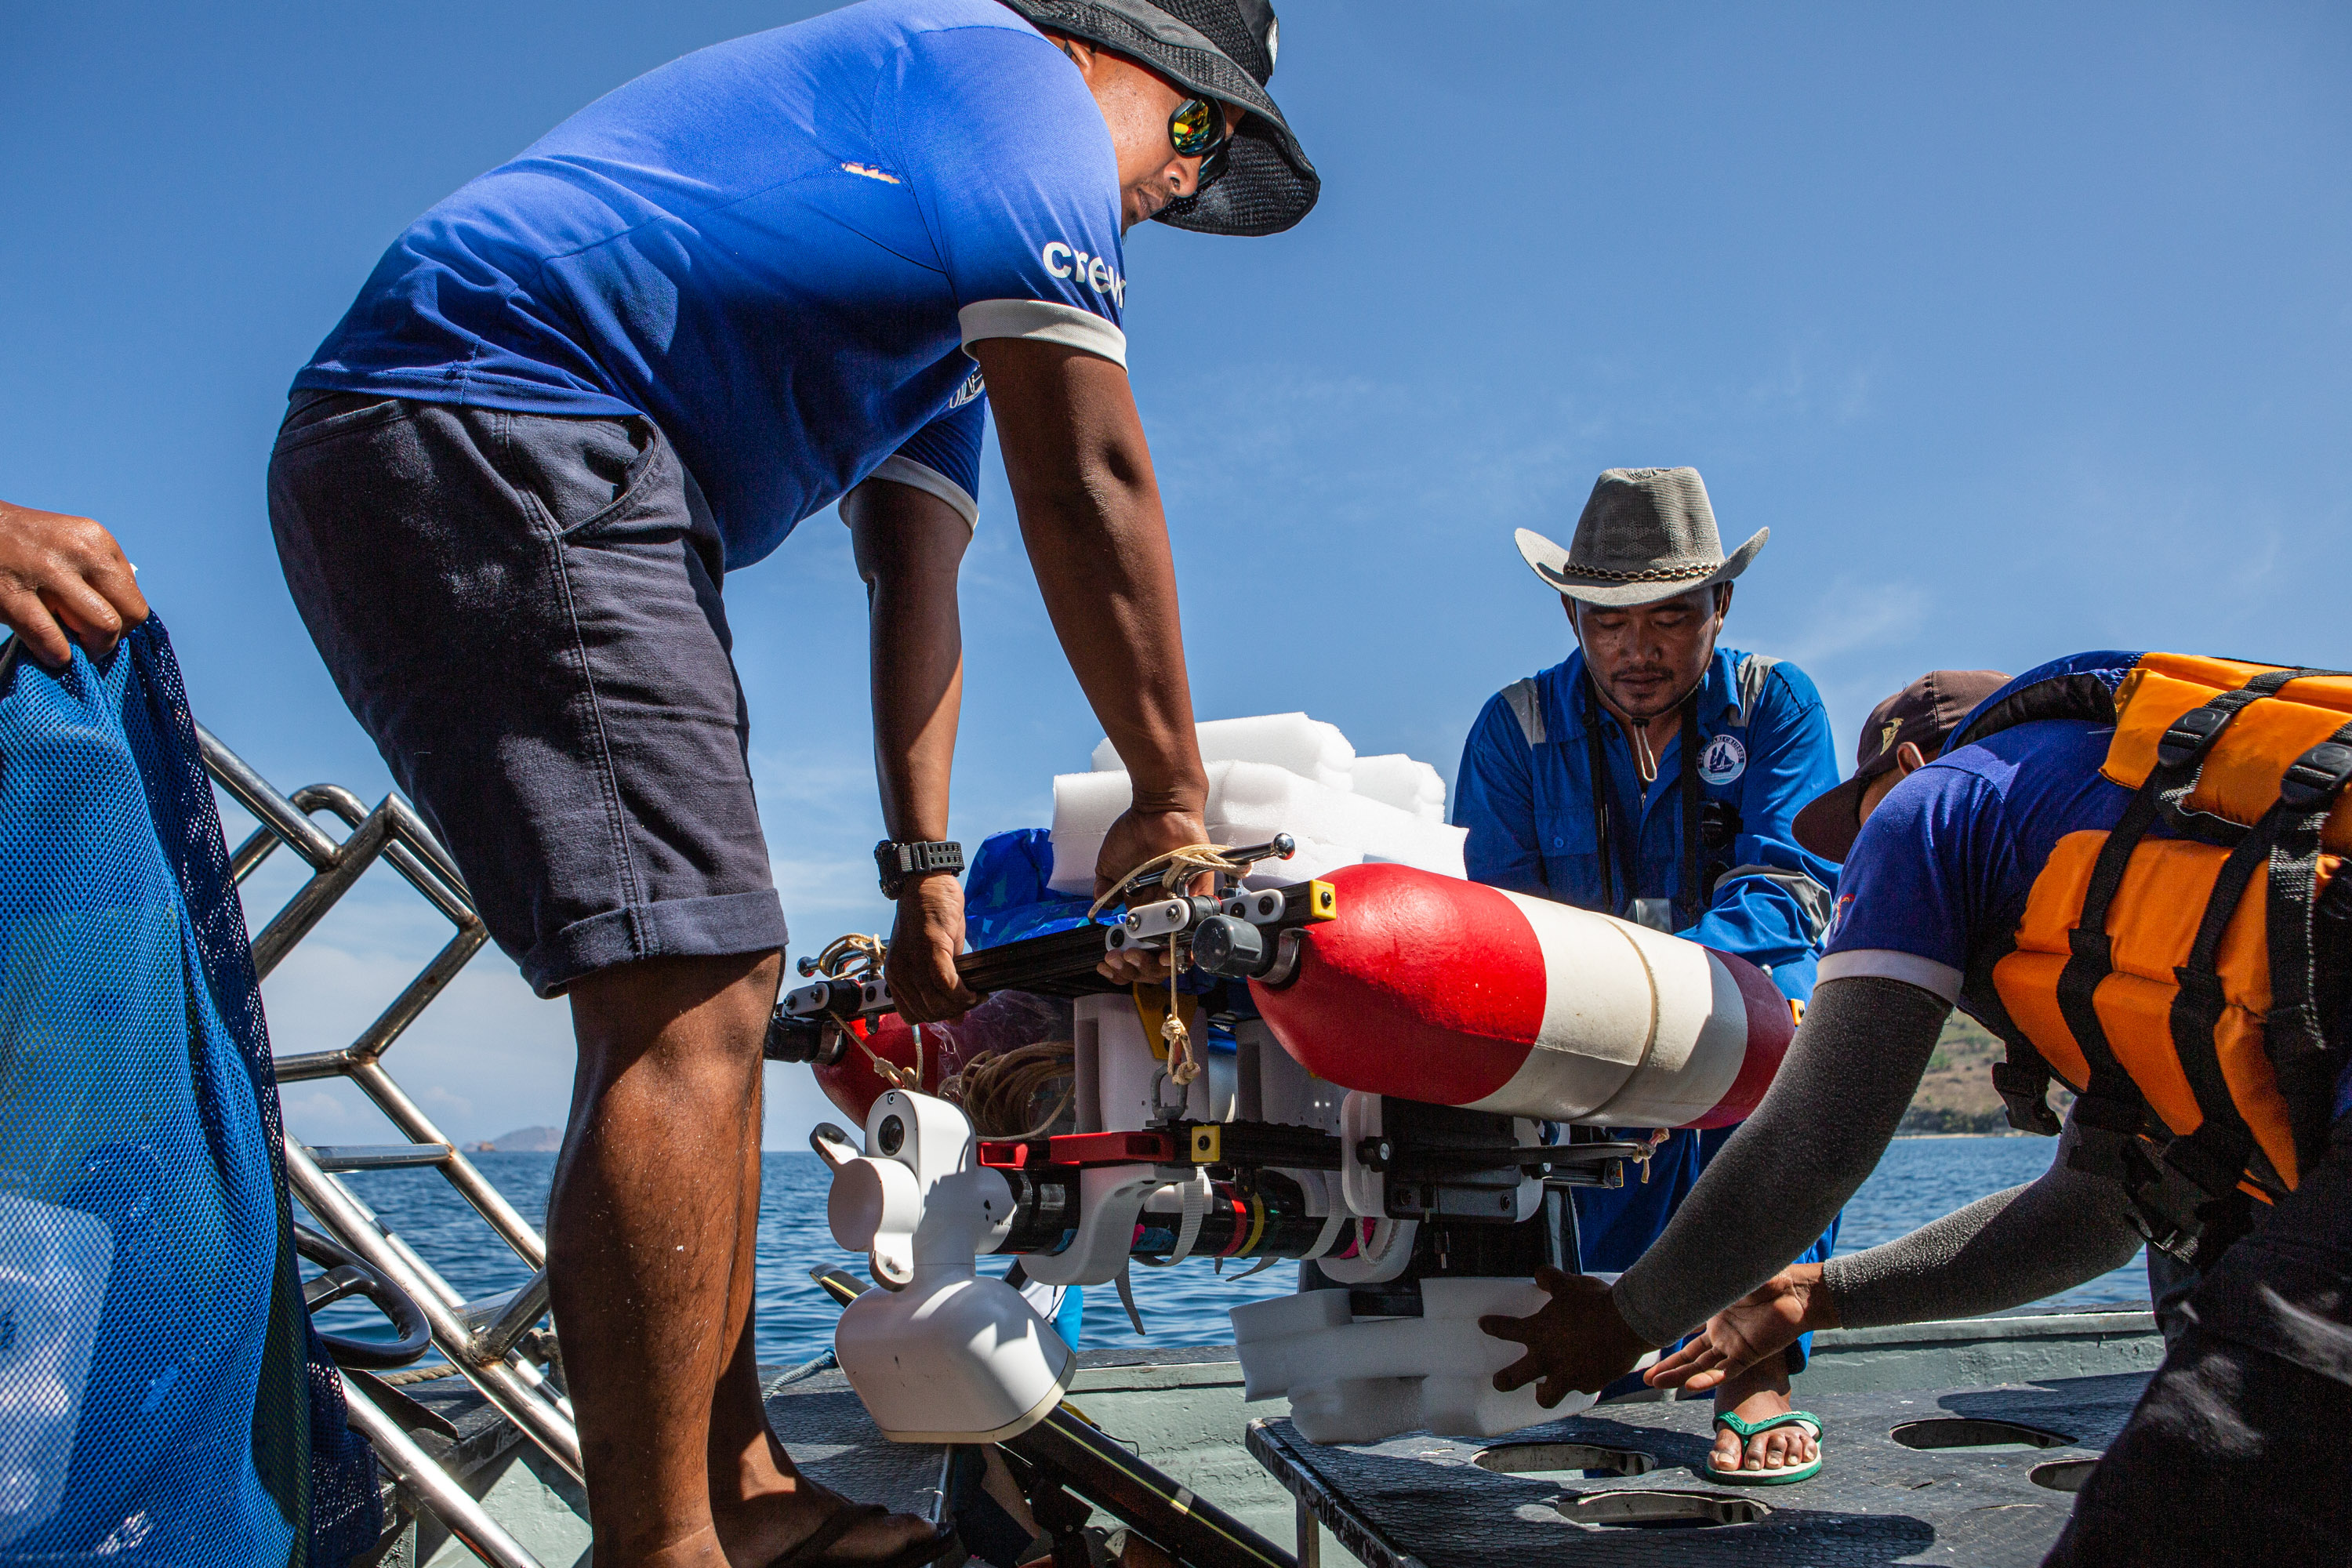
The Sea Safari crew helps the Tidal team load the camera system onto a boat.
photo : Agoes Rudianto

Tidal researchers test out a makeshift float for the camera system, whiled waiting on the Hammersled to arrive.
photo : Agoes Rudianto

Back on the main island, the Australian scientists used makeshift ovens, including some created from hair dryers, to dry out the plant materials and sediments.
Then they ground them up and deposited them into hundreds of plastic bags, carefully marked to denote different locations and depths.

In the months to come, they’ll analyze the carbon content in each batch at their labs in Adelaide, determining the total amount in each plot.

“If our algorithm takes a look at the data we gathered before they took the core samples and comes up with the same answer, then we’ve got it,” says Terry Smith, a solutions engineer with Tidal.
Open questions

Not everyone, however, is convinced that seagrass is a particularly promising path for carbon removal, or one whose climate benefits we’ll be able to accurately assess.

Among the suite of approaches to carbon removal that the National Academies has explored in its studies, those focusing on coastal ecosystems rank near the bottom in terms of the potential to scale them up.
That’s largely because these ecosystems can only exist as narrow bands along shorelines, and there’s considerable competition with human activity.

“We need to do everything we can to preserve seagrass,” says Isaac Santos, a professor of marine biogeochemistry at the University of Gothenburg in Sweden, because of the valuable roles these plants play in protecting coasts, marine biodiversity, and more.

“But on the big question—Are they going to save us from climate change?—the answer is straightforward: No,” he says.
“They don’t have enough area to sequester enough carbon to make a big impact.”

Accurately determining the net carbon and climate impact from seagrass restoration is also problematic, as studies have highlighted.
 
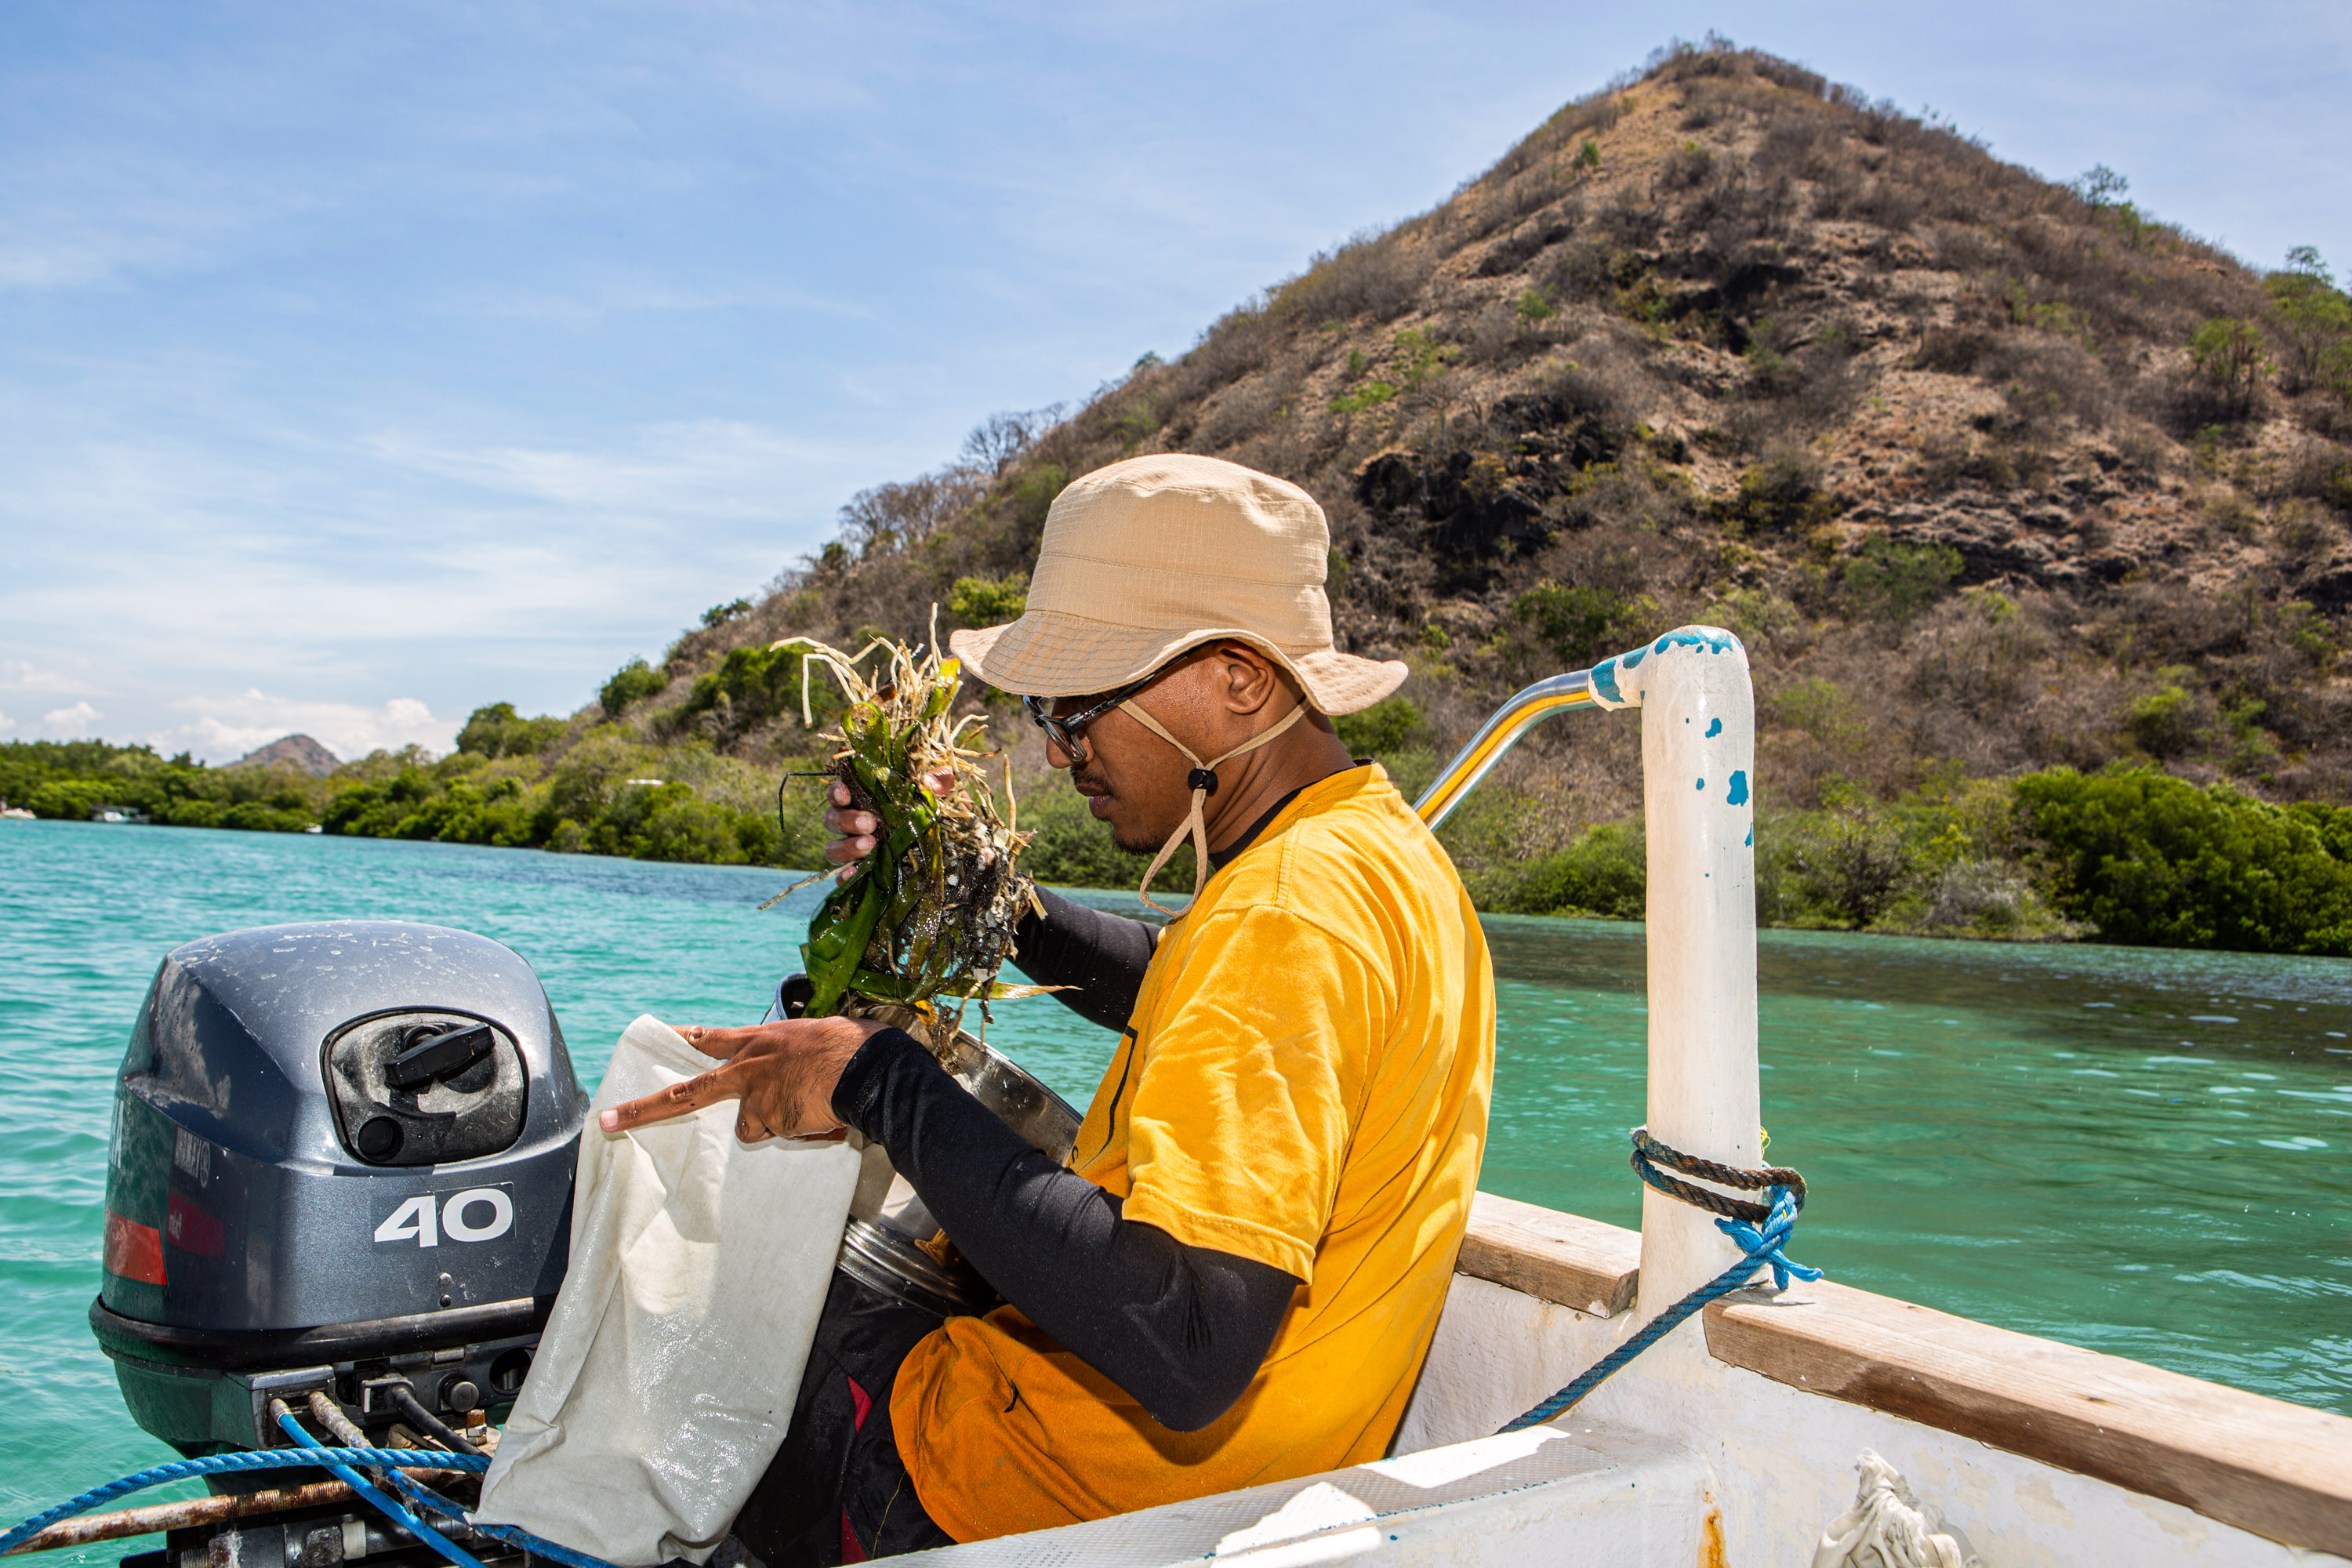
Wiyudha Pandu Laksana, an officer with the Kupang Water Conservation Area, puts a seagrass sample into a small bag near Waecicu Beach in Labuan Bajo, Indonesia.
photo : Agoes Rudianto

Carbon sequestration varies dramatically in these coastal meadows, depending on the location, the season, the mix of species, and how much gets gobbled up by fish and other marine creatures.
The carbon in seafloor sediments can also leak into the surrounding waters, where some is dissolved and effectively remains in the ocean for millennia, and some may escape back out into the atmosphere.
In addition, coastal ecosystems produce methane and nitrous oxide, potent greenhouse gases that would need to be factored into any estimate of overall climate impact.

Finally, the vast, vast majority of the carbon in seagrass beds is buried in the seafloor, not in the plant material that Tidal intends to measure.

“And we also know that the correlation between biomass and sediment carbon is not straight forward,” Santos said in an email.
“Hence, any approach based on biomass only will require all sorts of validations,” to ensure that it actually provides reliable estimates of stored carbon.

An essay in The Conversation late last month highlighted another concern: environmental justice.
The authors, Sonja Klinsky of Arizona State University and Terre Satterfield of the University of British Columbia, stressed that the local communities most affected by such projects should have considerable say in them.
Some coastal towns may not want to turn their active harbor back into, say, a salt marsh.

“Much of the global population lives near the ocean,” they wrote, and some interventions “might impinge on places that support jobs and communities” and provide significant amounts of food.
Unlocking the secrets

Addressing the scientific questions will require better understanding of coastline ecosystems.
CSIRO’s Steven says he hopes that Tidal’s technology will provide easier ways to conduct the necessary studies.
“It’s absolutely a challenge,” he says.
“But you’ve got to start somewhere.”

As for the environmental justice concerns, Tidal stresses that these nature-based approaches to carbon removal potentially provide multiple benefits to natural ecosystems and local communities.
They could, for instance, help to sustain fishery populations.
Tidal is also working with CSIRO to train local communities in Fiji and Indonesia, including university students, to help them participate directly in carbon markets.

“Ultimately, our vision is to provide these communities with tools to be able to manage, protect, and repopulate these local systems locally,” Davé said in an email.

So what’s next for Tidal?

It will still take months for the Australian team to complete its analysis of the seagrass and sediments.
Whatever they find, the teams plan to continue conducting field experiments to refine the models and algorithms and make sure they provide accurate carbon estimates across a variety of seagrass types in different regions and conditions.

For instance, Tidal may look to partner with other research groups focused on the Bahamas, another major seagrass region.

If it does ultimately work well, Tidal believes, its suite of tools could also support other ocean-based approaches to carbon removal, including growing more seaweed and restoring mangrove forests.

Davé says he can envision a variety of potential business models, including providing carbon measurement, reporting, and verification as a service to offsets registries or organizations carrying out restoration work.
They might also create autonomous robotic systems that plant seagrass with little human involvement.

Even if the systems don’t provide reliable enough carbon estimates, Tidal believes its efforts will still aid scientific efforts to understand crucial ocean ecosystems, and support international efforts to protect them.
That could include monitoring the well-being of coral reefs, which are gravely threatened by warming waters, Davé says.

It may not sound like a moonshot in the way that X originally conceived of the concept.
It’s certainly no space elevator.

But by building tools that a variety of organizations could use in a variety of ways to unlock the secrets of Earth’s critical and fragile ecosystems, Tidal may be demonstrating a new way to take on really hard problems.

Links :

Wednesday, November 16, 2022

Global analysis shows where fishing vessels turn off their identification devices


This map shows the estimated total fishing vessel activity and the amount of this activity obscured by suspected disabling of automatic identification systems in areas with sufficient satellite reception.
Areas with highest fishing vessel activity and the highest fraction of activity obscured by disabling occur in three regions of concern for illegal, unreported and unregulated fishing: near Argentina and West Africa, and in the Northwest Pacific.
In contrast, fisheries in waters near Alaska are some of the most intensively managed in the world.
Credit: Global Fishing Watch
 
From PHYS by University of California

Data from the shipboard Automatic Identification System (AIS), which was created as a collision avoidance tool, can provide information about global fishing activity, including illegal, unreported, and unregulated fishing.
Fishing vessels may disable their AIS devices, but a new analysis identifies intentional disabling events in commercial fisheries and shows that, while some disabling events may be for legitimate reasons, others appear to be attempts to conceal illegal activities.

The new study, published November 2 in Science Advances, presents the first global dataset of AIS disabling in commercial fisheries, which obscures up to 6% of vessel activity.

First author Heather Welch, a project scientist in the Institute of Marine Sciences at UC Santa Cruz, worked on the study with researchers at Global Fishing Watch, which maintains an AIS dataset of vessel activity, and NOAA Fisheries.
After Global Fishing Watch developed a way to distinguish intentional disabling from gaps in satellite coverage and other technical issues, Welch used a machine learning method to identify four primary reasons for AIS disabling.

"There are some legitimate reasons why vessels disabled their AIS, but we found two situations in which it is done for potentially nefarious reasons, either to fish in unauthorized locations or to obscure unauthorized transshipments," she said.
"This dataset is now operationalized, and the data are produced in real time, so it can be used to target inspections and improve fisheries management."
 

Estimated total fishing vessel activity and the fraction of this activity obscured by suspected disabling events.
Panels A, C, E, and G show the gear types with the most time obscured by disabling events; panels B, D, F, and H show the flag states with the most time obscured by disabling events.
Only areas with sufficient satellite reception quality (>10 positions/day) are shown.
 

For the study, the researchers identified over 55,000 suspected intentional disabling events between 2017 and 2019, obscuring nearly 5 million hours of fishing vessel activity.
More than 40% of the total hours obscured by suspected AIS disabling occurred across four hotspots, three of which are areas of concern for illegal fishing: the Northwest Pacific and areas adjacent to the Exclusive Economic Zones (EEZs) of Argentina and West African nations.
These areas contain rich fishing grounds with limited management oversight.

"AIS data can tell us a lot, but so can the lack of it," said coauthor Tyler Clavelle, a data scientist at Global Fishing Watch.
"We might not always be able to see what vessels are doing, but knowing when they're intentionally hiding their movements provides valuable information that managers and scientists didn't have before.
Having a better understanding of where vessels may hide their position allows authorities to deploy valuable on-the-water resources more strategically, supporting improved fisheries management."

Disabling events were concentrated in waters adjacent to EEZ boundaries, suggesting that vessels may be disabling AIS before entering unauthorized locations to fish illegally.
In many cases, vessels go dark as they approach the edge of an EEZ where they are not authorized to fish, Welch said.
"For example, you might see a Korean-flagged vessel heading toward Argentina, and then it goes dark in international waters just outside of Argentina's EEZ," she said.

Notably, disabling was particularly common within and adjacent to EEZs with overlapping claims, such as the Falkland/Malvinas Islands that are disputed by the U.K. and Argentina.
The political conflicts in these regions may create blind spots for enforcement.

Disabling events were also common in areas with high transshipment activity, where boats transfer their catches to refrigerated cargo vessels.
Transshipment can be an efficient way to get the catch back to shore and resume fishing quickly, but it can also be used to obscure illegal fishing activity, effectively "laundering" the illegal catch through the cargo vessel.
In addition, it can enable forced labor on fishing boats that never visit ports.
 
Two examples of fishing vessels disabling their AIS devices to obscure their activities from oversight.
(A) The Oyang 77 disabled its AIS device nine times (the last three of which are shown in insets) adjacent to the Argentinean EEZ (gray shading) before being apprehended by Argentinian coast guard and escorted back to port (yellow star).
(B) A fishing vessel disabled its vessel-based AIS device but left its gear-mounted device broadcasting, showing transhipment with a refrigerated cargo vessel during the disabling event.

The study also found evidence that some disabling is done for legitimate reasons by vessels engaged in legal activities.
In some cases, Welch said, AIS disabling may be done to hide the locations of good fishing grounds from competitors.
The fourth disabling hotspot was caused by U.S. trawlers disabling in U.S. waters off the coast of Alaska.
"This is one of the most intensely managed fishing grounds in the world, and these events likely constitute location hiding from competitors," she said.

The other legitimate reason for disabling AIS is for protection from piracy.
"Using a database of historical attacks, we can see that vessels switch off AIS in these historically dangerous waters, and that may be so that pirates aren't able to track and intercept them," Welch said.

The approach demonstrated in this study could be used to support surveillance and enforcement efforts.

"This new dataset is an untapped resource that provides a real opportunity to detect previously unobserved behaviors and illegal fishing activities," Welch said.
"Authorities could use this information to decide where to send surveillance drones or patrol vessels, and it could also be used to focus port inspections on vessels that have disabled AIS adjacent to EEZ boundaries or in transshipment hotspots."

In addition to Welch and Clavelle, the coauthors of the paper include Timothy White, Jennifer Van Osdel, Timothy Hochberg, and David Kroodsma at Global Fishing Watch; Megan Cimino, an assistant researcher at the Institute of Marine Sciences and assistant adjunct professor of ocean sciences at UCSC; and Elliott Hazen, assistant adjunct professor of ecology and evolutionary biology at UCSC.
 
Links :

Tuesday, November 15, 2022

‘Dark ships’ emerge from the shadows of the Nord Stream mystery

This high-resolution image, captured by Pléiades Neo, shows the Nord Stream gas pipeline leak seen on September 29.
Credit: Pléiades Neo

From Wired by Matt Burgess

Satellite monitors discovered two vessels with their trackers turned off in the area of the pipeline prior to the suspected sabotage in September.

The first gas leaks on the Nord Stream 2 pipeline in the Baltic Sea were detected in the early hours of September 26, pouring up to 400,000 tons of methane into the atmosphere.
Officials immediately suspected sabotage of the international pipeline.
New analysis seen by WIRED shows that two large ships, with their trackers off, appeared around the leak sites in the days immediately before they were detected.

This map shows the pair of Nord Stream natural gas pipelines that runs under the Baltic Sea from Russia to Germany.
It comprises the Nord Stream 1 pipeline running from Vyborg in northwest Russia, near Finland, and the Nord Stream 2 pipeline running from Ust-Luga in northwest Russia near Estonia.
Ship traffic in the map can be identified as blue and yellow lines and uses data from the European Marine Observation and Data Network (EMODnet).
Red stars in the image depict the observed leaks as detected by the Copernicus Sentinel-1 mission.
Credit: ESA
 
According to the analysis by satellite data monitoring firm SpaceKnow, the two “dark ships,” each measuring around 95 to 130 meters long, passed within several miles of the Nord Stream 2 leak sites.
“We have detected some dark ships, meaning vessels that were of a significant size, that were passing through that area of interest,” says Jerry Javornicky, the CEO and cofounder of SpaceKnow.
“They had their beacons off, meaning there was no information about their movement, and they were trying to keep their location information and general information hidden from the world,” Javornicky adds.

On September 26, Planet satellites captured an image of the Nord Stream Gas pipeline rupture in the Baltic Sea, approximately 20 km southeast of Bornholm Island, Denmark.
Credit: Planet Labs PBC
 
The discovery, which was made by analyzing images from multiple satellites, is likely to further increase speculation about the cause of the blasts.
Multiple countries investigating the incident believe the Nord Stream 1 and 2 pipelines were rocked by a series of explosions, with many suspicions directed at Russia as its full-scale invasion of Ukraine continues.
(Russia has denied its involvement.) Once SpaceKnow identified the ships, it reported its findings to officials at NATO, who are investigating the Nord Stream incidents.
Javornicky says NATO officials asked the company to provide more information.

This radar image was captured on September 28 by ICEYE— the first New Space company to join the Copernicus Contributing Missions fleet.
Credit: ICEYE 2022
 
NATO spokesperson Oana Lungescu says it does not comment on the “details of our support or the sources used” but confirmed that NATO believes the incident was a “deliberate and irresponsible act of sabotage” and it has increased its presence in the Baltic and North Seas.
However, a NATO official, who did not have permission to speak publicly, confirmed to WIRED that NATO had received SpaceKnow’s data and said satellite imagery can prove useful for its investigations.
 
The animation shows the gas leak as captured by the Copernicus Sentinel-2 mission on September 30, 2022, compared to the acquisition on October 3 where no gas leak is visible.
Credit: Contains modified Copernicus Sentinel data (2022), processed by ESA, CC BY-SA 3.0 IGO

To detect the ships, Javornicky says, the company scoured 90 days of archived satellite images for the area.
The company analyzes images from multiple satellite systems—including paid and free services—and uses machine learning to detect objects within them.
This includes the ability to monitor roads, buildings, and changes in landscapes.
"We have 38 specific algorithms that can detect military equipment," Javornicky says, adding that SpaceKnow’s system can detect specific models of aircraft on landing strips.

In response to the gas leak, GHGSat, a leader in methane emissions monitoring from space and also part of ESA’s Third Party Mission Program, tasked its satellites to measure the pipeline leak with its constellation of high-resolution satellites.
By tasking its satellites to obtain measurements at larger viewing angles, GHGSat was able to target the area where the sun’s light reflected the strongest off the sea surface – known as the ‘glint spot’.
On September 30, the estimated emission rate derived from its first methane concentration measurement was 79,000 kg per hour – making it the largest methane leak ever detected by GHGSat from a single point source.
This rate is extremely high, especially considering it was four days following the initial breach, and this is only one of four rupture points in the pipeline.
Credit: GHGSat 

Once it gathered archive images of the area, SpaceKnow created a series of polygons around the gas leak sites.
The smallest of these, around 400 square meters, covered the immediate blast area, and larger areas of interest covered several kilometers.
In the weeks leading up to the explosions, SpaceKnow detected 25 ships passing through the region, from “cargo ships to multipurpose larger ships,” Javornicky says.
In total, 23 of these vessels had their automatic identification system (AIS) transponders turned on.
Two did not have AIS data turned on, and these ships passed the area during the days immediately ahead of the leaks being detected.

By international law, large ships are required to install and use AIS.
This vessel tracking system was created to help ships navigate and avoid potential collisions with other vessels.
When turned on, AIS will broadcast a ship’s name, location, the direction of travel, speed, and other information.

It is relatively rare for ships to turn off their AIS transponders.
Ships that “go dark” are often suspected of being involved in illegal fishing or modern slavery, with officials in Europe previously investigating ships that are believed to have turned off their AIS transponders.
“It would not be common practice [to have AIS turned off], unless the vessels have a classified military mission or they would have some clandestine objectives, because the Baltic Sea is one of the busiest seas in the world in terms of commercial traffic,” says Otto Tabuns, the director of the Baltic Security Foundation, an NGO that focuses on the region.

Tabuns says the Baltic Sea has multiple main “arteries” where ships travel and it is “responsible” for ships in the area to have their AIS trackers turned on.
Collisions at sea can be deadly and environmentally ruinous.
“There are many places in the [Baltic] sea that are not navigable for bigger ships,” Tabuns says.
“There are also some areas that are not recommended or where it is prohibited to ship because of the heritage of World War Two.” Decades-old wartime submarines and munitions litter the Baltic Sea’s floor.

SpaceKnow detected the ships that had AIS turned off using synthetic aperture radar (SAR) images from satellites.
Most satellites observing Earth take photos of what’s beneath them; others, however, also use SAR to bounce radio waves off the ground and create images from them.
Andrey Kurekin, a coastal ocean color scientist at the Plymouth Marine Laboratory who has analyzed satellite images for detecting objects at sea, says SAR technology can be useful for detecting ships, as it shows reflections from metal objects.
“They are shown as bright objects in SAR images,” Kurekin says.

Kurekin says SAR images can be used to identify the longitude and latitude coordinates of a ship, the direction it is heading, and potentially to estimate its speed.
“The main advantage of SAR over optical sensors is that the microwaves penetrate through clouds,” Kurekin says.
The images are less impacted by the weather and can also provide visibility at night.
“It's quite difficult to hide a ship from a SAR sensor,” Kurekin adds.

SAR images of the dark ships shared with WIRED show the vessels as glowing objects, not far from the explosion site around Nord Stream 2.
“We assume it was one of those two dark ships that we have detected, but we're not making any decision,” Javornicky says.
He says the company is not in the business of determining what may have happened or who is responsible but instead provided the data to authorities.

Kurekin cautions that AIS tracking systems onboard ships can, at times, fail.
The signal from AIS could stop communicating with satellites or receivers on land, Kurekin says, adding that the signal can be impacted by the weather too.
“If there is a vessel that you can see in SAR image but it's not reported by the AIS system, it does not necessarily mean that there's something wrong with this vessel,” Kurekin says.
Signals from AIS transponders can also be manipulated—warships have had their AIS data spoofed, and ships around Russia and the Black Sea have vanished from trackers in recent years.

While there are multiple ongoing investigations into the explosions, determining the full picture of what happened may take some time.
Police in Copenhagen said its initial investigations have determined that “powerful explosions” caused “extensive damage” to the pipes.
Images taken from around the exploded sections of the pipe appear to show that at least 50 meters of the pipeline were destroyed in the explosions.

In an email, the Swedish security service, Säkerhetspolisen, said that due to “secrecy” around its operations, it could not discuss its investigation or whether it was looking at satellite data.
However, agency spokesperson Gabriel Wernstedt says the organization is conducting a “criminal investigation of gross sabotage” around both the Nord Stream 1 and 2 pipes.
“Certain seizures were made during the onsite investigations that are being analyzed,” Wernstedt says.
In public statements, Säkerhetspolisen has confirmed denotations happened at the pipes and that the Swedish armed forces are involved in the investigations.

However, while the investigations are ongoing, there appear to be difficulties between the countries that are looking into the incident, which could slow the process.
While Sweden says it is working with investigators in Germany and Denmark, the official leading its investigation has rejected plans to form a joint investigation.

Tabuns says he hopes that the incident will act as motivation for countries to work on better ways to share intelligence, particularly as Sweden and Finland apply to join NATO.
Each country will have its own levels of classification for information and systems where it collects intelligence—these may often not be compatible, Tabuns says.
However, he adds that the events should see countries look at increasing the “integration of existing national systems so that there would be real-time information sharing for any response.”

Links :

Monday, November 14, 2022

Denmark and Germany now building the world's longest immersed tunnel

A lot has already happened on the Fehmarnbelt Tunnel construction site on the German side since construction began in 2021.
Site development on Fehmarn is completed, and also off the coast of Fehmarn work is well underway.
Now we are continuing to establish the construction site on Fehmarn, and preparing for the construction of the 3 bridges, the tunnel portal and access roads.
 
Localization with the GeoGarage platform (BSH nautical raster chart)
 
From CNN by Jacopo Prisco
 
Descending up to 40 meters beneath the Baltic Sea, the world's longest immersed tunnel will link Denmark and Germany, slashing journey times between the two countries when it opens in 2029.

After more than a decade of planning, construction started on the Fehmarnbelt Tunnel in 2020 and in the months since a temporary harbor has been completed on the Danish side.
 
When completed, the Fehmarnbelt Fixed Link will be the longest combined road and rail tunnel anywhere in the world.
Descending up to 40 meters beneath the Baltic Sea, it will link Denmark and Germany.
This rendering shows the ramp to the tunnel on the Danish side.
 
It will host the factory that will soon build the 89 massive concrete sections that will make up the tunnel.
"The expectation is that the first production line will be ready around the end of the year, or beginning of next year," said Henrik Vincentsen, CEO of Femern A/S, the state-owned Danish company in charge of the project.
"By the beginning of 2024 we have to be ready to immerse the first tunnel element."
 
At 18 kilometers long it will be also be the world's longest immersed tunnel.
 
The tunnel, which will be 18 kilometers (11.1 miles) long, is one of Europe's largest infrastructure projects, with a construction budget of over 7 billion euros ($7.1 billion).
By way of comparison, the 50-kilometer (31-mile) Channel Tunnel linking England and France, completed in 1993, cost the equivalent of £12 billion ($13.6 billion) in today's money.

Temporary harbor: After more than a decade of planning, construction started on the Fehmarnbelt Tunnel in 2020 and, in the months since, a temporary harbor has been completed on the Danish side.
The first cargo ship arrived in the temporary work harbor on July 18, 2022.
 
Although longer than the Fehmarnbelt Tunnel, the Channel Tunnel was made using a boring machine, rather than by immersing pre-built tunnel sections.
It will be built across the Fehmarn Belt, a strait between the German island of Fehmarn and the Danish island of Lolland, and is designed as an alternative to the current ferry service from Rødby and Puttgarden, which carries millions of passengers every year.
 
Fehmarn Belt: The tunnel will be built across the Fehmarn Belt, a strait between the German island of Fehmarn and the Danish island of Lolland.

Where the crossing now takes 45 minutes by ferry, it will take just seven minutes by train and 10 minutes by car.

Production hall: The roof of the first production hall where the tunnel sections will be built in Denmark was completed on June 8, 2022.

The tunnel, whose official name is Fehmarnbelt Fixed Link, will also be the longest combined road and rail tunnel anywhere in the world.
It will comprise two double-lane motorways -- separated by a service passageway -- and two electrified rail tracks.
"Today, if you were to take a train trip from Copenhagen to Hamburg, it would take you around four and a half hours," says Jens Ole Kaslund, technical director at Femern A/S, the state-owned Danish company in charge of the project.
"When the tunnel will be completed, the same journey will take two and a half hours.

Built on site: The factory will assemble the 89 massive concrete sections that will make up the tunnel.
 
"Today a lot of people fly between the two cities, but in the future it will be better to just take the train," he adds.
The same trip by car will be around an hour faster than today, taking into account time saved by not lining up for the ferry.
Besides the benefits to passenger trains and cars, the tunnel will have a positive impact on freight trucks and trains, Kaslund says, because it creates a land route between Sweden and Central Europe that will be 160 kilometers shorter than today.
At the moment, traffic between the Scandinavian peninsula and Germany via Denmark can either take the ferry across the Fehmarnbelt or a longer route via bridges between the islands of Zealand, Funen and the Jutland peninsula.


Work in progress: This full-scale trial cast of a tunnel element was built in July 2022.
 
Work begins

The project dates back to 2008, when Germany and Denmark signed a treaty to build the tunnel.
It then took over a decade for the necessary legislation to be passed by both countries and for geotechnical and environmental impact studies to be carried out.
While the process completed smoothly on the Danish side, in Germany a number of organizations -- including ferry companies, environmental groups and local municipalities -- appealed against the approval of the project over claims of unfair competition or environmental and noise concerns.
In November 2020 a federal court in Germany dismissed the complaints: "The ruling came with a set of conditions, which we kind of expected and we were prepared for, on how we monitor the environment while we are constructing, on things like noise and sediment spill.
I believe that we really need to make sure that the impact on the environment is as little as possible," says Vincentsen.
 
The hard part begins: Dredging works started off the German coast in the fall of 2021.

Now the temporary harbor on the Danish site is finished, several other phases on the project are underway, including the digging of the actual trench that will host the tunnel, as well as construction of the factory that will build the tunnel sections.
Each section will be 217 meters long (roughly half the length of the world's largest container ship), 42 meters wide and 9 meters tall.
Weighing in at 73,000 metric tons each, they will be as heavy as more than 13,000 elephants.
"We will have six production lines and the factory will consist of three halls, with the first one now 95% complete," says Vincentsen.
The sections will be placed just beneath the seabed, about 40 meters below sea level at the deepest point, and moved into place by barges and cranes.
Positioning the sections will take roughly three years.

Special sections: Ten of the sections will be "special," with a basement that will house the electrical equipment necessary to make the tunnel function.
As this rendering shows, these have been designed with a parking bay for maintenance vehicles, from which workers can safely descend into the basement.
 
A wider impact

Up to 2,500 people will work directly on the construction project, which has been impacted by the global supply chain woes.
"The supply chain is a challenge at the moment, because the price of steel and other raw materials has increased.
We do get the materials we need, but it's difficult and our contractors have had to increase the number of suppliers to make sure they can get what they need.
That's one of the things that we're really watching right now, because a steady supply of raw materials is crucial," says Vincentsen.
Michael Svane of the Confederation of Danish Industry, one of Denmark's largest business organizations, believes the tunnel will be beneficial to businesses beyond Denmark itself.
 
Entry area: An illustration of what the entry area at Puttgarden, on Fehmarn, will look like after construction.

"The Fehmarnbelt tunnel will create a strategic corridor between Scandinavia and Central Europe.
The upgraded railway transfer means more freight moving from road to rail, supporting a climate-friendly means of transport.
We consider cross-border connections a tool for creating growth and jobs not only locally, but also nationally," he tells CNN.

 
Construction of the Fehmarnbelt Tunnel (animation)
 
While some environmental groups have expressed concerns about the impact of the tunnel on porpoises in the Fehmarn Belt, Michael Løvendal Kruse of the Danish Society for Nature Conservation thinks the project will have environmental benefits.
"As part of the Fehmarnbelt Tunnel, new natural areas and stone reefs on the Danish and German sides will be created.
Nature needs space and there will be more space for nature as a result," he says.

"But the biggest advantage will be the benefit for the climate.
Faster passage of the Belt will make trains a strong challenger for air traffic, and cargo on electric trains is by far the best solution for the environment." 
 
Links :