Saturday, October 1, 2022

Roman-era anchor found at windfarm on display in Ipswich


The anchor could provide evidence of the seafaring activity off the east coast during Roman times
 
From BBC

An "incredibly rare" wrought iron anchor thought to be up 2,000 years old is going on display for one day after being found at an offshore windfarm.

The anchor, believed to be Roman or late Iron Age, was found off the Suffolk coast in 2018 during survey work on the East Anglia One windfarm.

 
It will be on show for the first time at Ipswich Museum on Tuesday, before being moved for further analysis work.
Experts said it was an "incredibly rare, distinctive" anchor.
It was thought to have come from a 500-600 tonne vessel and was believed to be between 2,000 and 1,600 years old.
The anchor was found in 2018 and removed from the sea last year

"Everything points to this being a Roman anchor of almost 2,000 years old; if this is confirmed it would be hard to overstate its significance," said Brandon Mason from Maritime Archaeology Ltd.
"We only know about three pre-Viking anchors from northern European waters outside the Mediterranean region, and only two actually survived.
"We believe this find could be the oldest and one of the largest surviving examples, giving us hard evidence of the incredible amount of activity that must have been going on in the waters in Roman times, but that we know relatively little about."


Ross Ovens of Scottish Power Renewables with the anchor at Ipswich Museum where it is appearing for one day only before more research is carried out on it

Image Scottish Power

The anchor will undergo further tests to find its age

Detail of the corrosion on the wrought iron anchor, which weighs 100kg (220lb)
Image  Mike Liggins / BBC Image

After its discovery, the anchor was protected by an exclusion zone installed on the seabed during construction work on the wind turbines.

Measuring two metres (6.5ft) long and weighing around 100kg (220lb), the anchor was recovered from the North Sea in 2021.

Once the analysis and conservations works are complete, the anchor will go on permanent display in conjunction with Colchester and Ipswich Museums.

German submarine

Although it has yet to be dated more precisely, archaeologists said there were several features that suggested it could come from the Imperial Roman period.

If confirmed, it would provide evidence of ancient Romans seafaring and trading in the southern North Sea, off the coast of the East of England.

The Imperial Roman period lasted from about 27BC to the late 3rd and 4th Century when the empire expanded, especially to the west.

In 54-55BC Julius Caesar tried to invade Britain, but failed, and then in AD43 the Roman army landed in Kent and began to conquer what is now England and Wales.

Scottish Power Renewables, which built the windfarm, said it made other finds during the work including a missing German submarine from World War One and an ancient wild cattle skull, which has been radiocarbon-dated to more than 6,000 years old.

The East Anglia One windfarm is located around 40km (25 miles) off the coast of Suffolk and will have 102 turbines when finished.
 
Links :


Friday, September 30, 2022

France & misc. (SHOM) layer update in the GeoGarage platform

2 new nautical raster charts added and 157 charts updated
 

The race to find the Nord Stream saboteurs


Photograph: Danish Defence/Anadolu Agency/Getty Images
 
From Wired by Matt Burgess

Damage to the pipeline that runs between Russia and Germany is being treated as deliberate.
Finding out what happened may not be straightforward.


The Nord Stream gas pipelines are colossal pieces of infrastructure.
Running more than 1,200 kilometers from Russia, across the Baltic Sea to Germany, the pipes can carry up to 110 billion cubic meters of gas, enough for 26 million homes.
The Nord Stream 1 pipeline alone is constructed of 202,000 huge pieces of piping.
Each section is 12 meters long and contains piping that uses around 4 centimeters of steel, which is covered with 11 centimeters of concrete.
The pipes are not built to break.
 

Sources: European Network of Transmission System Operators for Gas (ENTSOG); Danish and Swedish maritime authorities
 see also GEUS
 
Locations of the current navigation warnings due to Nord Stream 1 and 2 leaks marked on map containing both pipelines.

 source : @OAlexander
 
DGA raster chart

ENC DKBORNH with Nord Stream I & II display
Title : Baltic Sea.
(the water depth at the location of the leak, near the island of Bornholm,
should reach about 50-70 meters)
Scale : 180000 / Cat : 2 / Type : General
Edition_date : 20010917 / Edition : 41 - Update_date : 20220906 / Update : 4
 
Going by the coordinates of the leak in Nord Stream 2 (54.876670, 15.410000) and the leaks basically being confirmed as caused by the explosions, the first explosion was 1.41km away from Danish territorial waters.
source : @OAlexanderDK
 
So when the pressure in one of the Nord Stream pipes dropped on June 26, alarm bells started ringing.
Danish authorities told ships to steer clear of the pipes as methane gas was bubbling into the sea.
Hours later, two more leaks were detected, one in Nord Stream 2 and a second in Nord Stream 1.
Now, authorities are suspecting foul play.
“We are not talking about an accident,” Mette Frederiksen, the Danish prime minister said.
 

 A leak in NordStream2 is visible in Sentinel1 SAR image captured 29 Sep
 
Orbital EOS team, while analyzing European Space Agency - ESA´s Sentinel 2 data.
The anomaly has a radius of 350-400 m, presumed to be liberating a large amount of methane into the atmosphere.
 
NordStream gas pipeline leak seen from space (Airbus Pléiades)
 

Ursula von der Leyen, head of the European Commission, believes the leaks may be a result of “sabotage” and said any “deliberate disruption” of energy infrastructure will “lead to the strongest possible response.” NATO officials agree; the US has pledged its support to help Europe find out what happened.
However, the incidents have raised fears about attacks on critical infrastructure and the security protections in place around systems that can provide the world’s fuel.
The incident comes on top of Russia reducing its supply of gas to Europe, with large parts of the continent facing winter energy crises.

While officials have indicated the leaks may have been caused deliberately, very little evidence about the attacks has emerged so far.
Military flights over the region show gas bubbling at the surface more than a kilometer wide, and Swedish seismic experts say they are convinced explosions took place after they recorded tremors equal to a magnitude 2.3 earthquake.
 

Unexplained leaks in two Russian gas pipelines that churned up the Baltic Sea with bubbles on Tuesday, raised concerns from Copenhagen to Moscow about sabotage on infrastructure at the heart of a European energy standoff.
 
Fingers immediately pointed at Russia, which partly owns the pipes.
Ukraine has said it is a “terrorist attack,” and German newspaper Der Spiegel reported that the CIA warned German officials about possible attacks against Baltic pipelines several weeks ago.
(Right-wing commentators in the US and one Polish MP accused the US of being involved after President Joe Biden said, in February, he would “put an end” to Nord Stream 2 if Russia invaded Ukraine.)

"It's a very classic Russian hybrid warfare approach,” says Hans Tino Hansen, the CEO of Risk Intelligence, a Denmark-based security firm that deals with maritime issues.
Hansen says if Russia did attack the Nord Stream pipelines it would show they have “complete deniability.” Because Russia partly owns the Nord Stream infrastructure, it makes people question why it would be behind any attacks against it.
(The Kremlin claimed suggestions it is behind the leaks are “stupid.) “They are showing that they can attack seabed energy infrastructure, with the pipelines, which then sends the signal that they can attack and destroy any energy infrastructure in Europe," Hansen says.

Investigators across Europe, including intelligence agencies, will now be trying to piece together exactly who and what caused the apparent explosions.
This is likely to involve multiple steps, such as examining what data is held about the area, including seismic data and other sensors, checking whether any communications around the incident have been intercepted, and examining the pipelines to see if there are any signs of intentional destruction.

Neither of the pipes is operational—Nord Stream 1 was paused for repairs in August and Nord Stream 2 has not officially opened after Germany pulled support for it ahead of Russia’s full-scale invasion of Ukraine in late February—but both pipes are holding gas.
All three leaks happened relatively close to each other, near the Danish island of Bornholm, in the Baltic sea.
The island is surrounded by Denmark to the west, Sweden to the north, and both Germany and Poland to the south.
The leaks are in international waters, but also sit in both Denmark and Sweden’s exclusive economic zones.
“It's quite shallow, around 50 meters on average in this region,” says Julian Pawlak, a research associate at the Helmut Schmidt University and the German Institute for Defence and Strategic Studies.

Security sources have speculated if the attacks were deliberate, they could have been conducted by unmanned underwater drones, involve mines being dropped or planted by boats, been carried out by divers, or even from within the pipes themselves.
“We still don't know what the origin is of those explosions or where they came from—if they originated from the outside or if they originated from the inside of the pipelines,” Pawlak says.
In a process called “pigging,” cleaning and inspection machines can be sent down the pipes from Russia in the direction of Germany.
It’s possible pigging was repurposed to carry out an attack.

Back in 2007, before the first Nord Stream pipeline was constructed, a review of the project by the Swedish Defence Research Agency (FOI) warned about potential explosions around the pipe, in the context of terrorism.
“Despite its concrete coating, a pipeline is rather vulnerable, and one diver would be enough to set an explosive device,” its report said.
“However, the impact of such an assault would probably be rather modest and most likely a minor incident of this type would not result in a large explosion.”

"They [Russia] have the capability for subsea warfare, with the divers, but also with mini-submarines and drones,” Hansen says.
However, confirming any responsibility isn’t necessarily straightforward.
The relatively shallow depth of the area around the Nord Stream pipes means it is unlikely that any large submarines would have been operating nearby, as they would be easy to detect.

Pawlak says any vessels in the area could potentially detect others that may have caused the damage.
Undersea sensors could equally spot something in the area moving, but it is unclear where any of these systems are.
“It's still not the case that all of the Baltic Sea is filled up with sensors and that NATO knows every movement,” Pawlak says.
“On the surface, but especially on the seabed, it's still not possible to know, at every time, at every place, what's moving, what's going on.”

However, the Nord Stream incidents draw into focus the protections that are placed around critical infrastructure.
In recent years, cyberattacks have shut down the US Colonial Pipeline, cutting off fuel supplies.
And ahead of Russia’s full-scale invasion of Ukraine, its military hackers used the country as a cyberwarfare testing ground, shutting down power grids with their code.

Undersea infrastructure can be particularly vulnerable to damage—either from natural causes, such as earthquakes, or physical attacks.
Since the Nord Stream pipes burst on Tuesday huge volumes of gas have poured into the sea, potentially causing an “unprecedented” environmental impact.
"As we—and many others—have been saying for many years, we need to address the security of energy infrastructure and also everything subsea,” Hansen says.
This includes the myriad of internet cables stretching thousands of kilometers around the world and keeping billions of people online.

In January, the head of the UK’s armed forces warned that Russian submarines have been threatening subsea cables.
“Russia has grown the capability to put at threat those undersea cables and potentially exploit those undersea cables,” Admiral Tony Radakin said.

Hansen says there are two starting points for protecting subsea infrastructure: first, building out ways to detect faults and issues with equipment automatically and then also making sure there is equipment, such as underwater drones, that are able to scramble to sites to inspect them when damage has happened.
Those steps may already be underway, with Norway’s prime minister saying the country will up the military protection of its energy infrastructure.
 
Links :

Thursday, September 29, 2022

European drought unearths sunken Nazi warships, ‘Spanish Stonehenge’


Low water levels have revealed the wreckage of Nazi warships in the Serbian section of the Danube River.
(Fedja Grulovic/Reuters)


From WP by Marina Lopes

One of the worst droughts on record in Europe has parched the continent’s major waterways, revealing relics such as a long-submerged village and World War II-era battleships.

This week, low water levels on the Serbian section of the Danube River exposed a graveyard of sunken German warships filled with explosives and ammunition.
The vessels, which emerged near the port town of Prahovo, were part of a Nazi Black Sea fleet that sank in 1944 while fleeing Soviet forces.
More ships are expected to be found lodged in the river’s sandbanks, loaded with unexploded ordnance.

A junior Serbian transport minister told local media there were about 10,000 explosive devices in the water.


Europe's worst drought in years has exposed dozens of explosives-laden German warships sunk during World War II near Serbia's river port town of Prahovo.
(Video: Reuters)


Other ruins have also emerged around Europe as waters recede in the drought.
In July, a Roman bridge built during the first century B.C.
was uncovered in the Tiber River, and in August, a village that had been deliberately flooded in 1963 to build a dam appeared from the Belesar reservoir in Spain.

The village is one of several sites submerged under reservoirs in Spain.
A ghost town that had been flooded to build a dam on Spain’s border with Portugal emerged in February, revealing houses with windows and walls still intact.

The drought has threatened shipping routes, food supply and electricity in Europe this summer.
European Union researchers said earlier this month that nearly half of the continent is under “warning” conditions, which connote a severe drought and a major soil moisture deficit, The Washington Post has reported.

The Dolmen of Guadalperal, a collection of prehistoric stones also known as the Spanish Stonehenge, can be seen because of receding waters.
(Susana Vera/Reuters)


This is not the first time most of the sites and relics have poked out of the water.
The Nazi ships, for instance, also made an appearance during a 2003 heat wave. But the severity of this year’s drought has made the waterways particularly difficult to navigate, as the sunken boats pose a danger to fishing and shipping vessels that have to skirt the hulks to get by.
Ships now have to squeeze through a 110-yard stretch of the Danube, nearly half the available waterway to which they once had access, according to Reuters.

Officials estimate it will cost $30 million to remove more than 20 ships, ammunition and explosives, the newswire reported.

But the dry conditions have also given archaeologists and researchers a rare glimpse into the past and contact with ruins that are normally difficult to access.

Earlier this week, the unrelenting heat wave that left the Iberian Peninsula drier than any time in the last 1,200 years also exposed dozens of prehistoric stones in a reservoir in central Spain.

The drought drained the reservoir to a fraction of its capacity, the Spanish government said, granting archaeologists access to the Dolmen of Guadalperal, believed to be from 5000 B.C.
Known as the “Spanish Stonehenge,” in a reference to the prehistoric monument built in what is now England, the stones were first uncovered in the 1920s.
The area where they stood was flooded in the 1960s to build a dam, and they have been fully visible only a handful of times since, according to the NASA Earth Observatory.

“It’s a surprise, it’s a rare opportunity to be able to access it,” archaeologist Enrique Cedillo, who is rushing to examine the relics before they become submerged again, told Reuters.

Wednesday, September 28, 2022

Do you know what CatZoc is?

visualization with the GeoGarage platform of the CATZOC cartridge for raster chart 7567 SHOM


The oceans account for approximately 70% of the planet Earth, where about 50,000 ships ply every day.
But how is it secured that they ply in safe areas?
The seabed is a complex surface that is likely to differ in depth at all points across the ship hull. How has such a large area been measured and mapped accurately to make sure that the water depth is adequate?

Ships’ navigation for the transport of goods has been present for thousands of years, with Britannica recording the first indications of waterborne vessels as early as 4000 BCE.
Measuring the ocean depths is not a task that took place in one day and certainly remains a key task of the world’s hydrographic offices in each state.


Measuring the oceans’ depth

In the past, the measuring of water level was carried out manually with ropes and acoustic signals. A more recent method included a wire being towed by two or more ships with weights sunk at a fixed depth.
Any obstruction in the area the wire was being dragged would be detected by the wire being stretched.

With the technological advancements of today, the method of conducting these hydrographic surveys has changed.
The modern approach for recording the oceans’ depth is using SONAR (SOund Navigation And Ranging).
The SONAR technique is using sound propagation, to measure distances or detect objects underwater. The data collected through SONAR are then processed in combination with other data, such as tide, to make the depth measurement as accurate as possible.

However, the data shown on nautical charts and ENCs may have errors depending on how these data were measured and when they were measured.
The older the data are, the less accurate they will be, due to the limited technology equipment used in each time.

A case study

The Captain and the second officer are reviewing the passage plan. At some point, they realize that the under keel clearance – the vertical distance between the bottom of the ship and the seabed- is 1.5 meters which is more than enough under the company’s SMS.
But how trustworthy is this estimation?
What if the depth is lower?

Looking at it a bit further, they realize that the measurement provided for this point of the passage plan was made over a century ago.
And while navigating on this route would be alright under the company’s procedures, it could prove catastrophic in practice.
So how much of a range should the crew expect regarding the water depth?
This is what CatZoc addresses.

CatZoc and its importance for safe navigation

As there are several parts of the water that were mapped years ago, with different technological means, it is expected to not trust all the measurements. The main possible errors may concern the actual depth measurement, as well as the positionat which the depth measurement is depicted. At the same time, the potential errors of these two variables are not constant.

In this respect, a CATZOC (also known as Zone of Confidence) is a deviation that helps make sure which of these variables are accurate and to what extent errors are expected. Considering the possible error on depth and position, the data is divided into 6 confidence zones (CATZOC):
CatZocPosition Depth 
A15 meters0.5 meters + 1% of depth
A220 meters1.0 meters + 2% of depth
B50 meters1.0 meters + 2% of depth
C500 meters2.0 meters + 5% of depth
DOver 500 metersOver 2.0 meters + 5% of depth
U                           (Not assessed)
The zones of confidence above provide the maximum errors per depth and position.
As such, CatZoc (Categories of Zone Of Confidence) is a rather simple aspect of understanding ECDIS and electronic nautical charts (ENCs). On ECDIS, the CatZocs are symbolized by a number of stars.
A map with six stars means the information is very accurate and with two stars very inaccurate.

Example

If on an ENC map, CATZOC is Confidence zone B, this would mean thatthe location of depths marked on this chart may be inaccurate by approximately 50 meters; or
the possible error of the depth is 1 meter + 2% of the depth, e.g., if the mapped depth shows 20 meters, the error in that could be 1.4 meters (1 meter + 2% of 20 meters).

Did you know?

The effects of shallow water on ships’ navigation can be not only disrupting but also dangerous. For example, a very big cruise ship, e.g., the size of the Costa Concordia, is unable to float if the water is less than 26ft deep.

Usually, when a ship is navigating in shallow waters, maneuvering becomes more sluggish and the speed of the ship over water reduces. Rolling and pitching will probably reduce, and the ship may start to vibrate. If the ship increases its speed, the keel will come closer to the ground and the ship will sheer about unpredictably.

Links :

Ocean scientists measure sediment plume stirred up by deep-sea-mining vehicle

A movie of the Patania II pre-prototype collector vehicle entering, driving through, and leaving the low-lying turbidity current plume as part of a selfie operation.
For scale, the instrumentation post attached to the front of the vehicle reaches about 3m above the seabed.
The movie is sped up by a factor of 20.
Video credit: Global Sea Mineral Resources
 
From MIT by Jennifer Chu

A new field study reveals a previously unobserved fluid dynamic process that is key to assessing impact of deep-sea mining operations.

What will be the impact to the ocean if humans are to mine the deep sea? It’s a question that’s gaining urgency as interest in marine minerals has grown.

The ocean’s deep-sea bed is scattered with ancient, potato-sized rocks called “polymetallic nodules” that contain nickel and cobalt — minerals that are in high demand for the manufacturing of batteries, such as for powering electric vehicles and storing renewable energy, and in response to factors such as increasing urbanization.
The deep ocean contains vast quantities of mineral-laden nodules, but the impact of mining the ocean floor is both unknown and highly contested.

Now MIT ocean scientists have shed some light on the topic, with a new study on the cloud of sediment that a collector vehicle would stir up as it picks up nodules from the seafloor.

The study, appearing today in Science Advances, reports the results of a 2021 research cruise to a region of the Pacific Ocean known as the Clarion Clipperton Zone (CCZ), where polymetallic nodules abound.
There, researchers equipped a pre-prototype collector vehicle with instruments to monitor sediment plume disturbances as the vehicle maneuvered across the seafloor, 4,500 meters below the ocean’s surface.
Through a sequence of carefully conceived maneuvers.
the MIT scientists used the vehicle to monitor its own sediment cloud and measure its properties.

Their measurements showed that the vehicle created a dense plume of sediment in its wake, which spread under its own weight, in a phenomenon known in fluid dynamics as a “turbidity current.”
As it gradually dispersed, the plume remained relatively low, staying within 2 meters of the seafloor, as opposed to immediately lofting higher into the water column as had been postulated.

“It’s quite a different picture of what these plumes look like, compared to some of the conjecture,” says study co-author Thomas Peacock, professor of mechanical engineering at MIT.
“Modeling efforts of deep-sea mining plumes will have to account for these processes that we identified, in order to assess their extent.”

The study’s co-authors include lead author Carlos Muñoz-Royo, Raphael Ouillon, and Souha El Mousadik of MIT; and Matthew Alford of the Scripps Institution of Oceanography.
 

Deep-sea maneuvers

To collect polymetallic nodules, some mining companies are proposing to deploy tractor-sized vehicles to the bottom of the ocean.
The vehicles would vacuum up the nodules along with some sediment along their path.
The nodules and sediment would then be separated inside of the vehicle, with the nodules sent up through a riser pipe to a surface vessel, while most of the sediment would be discharged immediately behind the vehicle.

Peacock and his group have previously studied the dynamics of the sediment plume that associated surface operation vessels may pump back into the ocean.
In their current study, they focused on the opposite end of the operation, to measure the sediment cloud created by the collectors themselves.

In April 2021, the team joined an expedition led by Global Sea Mineral Resources NV (GSR), a Belgian marine engineering contractor that is exploring the CCZ for ways to extract metal-rich nodules.
A European-based science team, Mining Impacts 2, also conducted separate studies in parallel.
The cruise was the first in over 40 years to test a “pre-prototype” collector vehicle in the CCZ.
The machine, called Patania II, stands about 3 meters high, spans 4 meters wide, and is about one-third the size of what a commercial-scale vehicle is expected to be.

While the contractor tested the vehicle’s nodule-collecting performance, the MIT scientists monitored the sediment cloud created in the vehicle’s wake.
They did so using two maneuvers that the vehicle was programmed to take: a “selfie,” and a “drive-by.”

Both maneuvers began in the same way, with the vehicle setting out in a straight line, all its suction systems turned on.
The researchers let the vehicle drive along for 100 meters, collecting any nodules in its path.
Then, in the “selfie” maneuver, they directed the vehicle to turn off its suction systems and double back around to drive through the cloud of sediment it had just created.
The vehicle’s installed sensors measured the concentration of sediment during this “selfie” maneuver, allowing the scientists to monitor the cloud within minutes of the vehicle stirring it up.

For the “drive-by” maneuver, the researchers placed a sensor-laden mooring 50 to 100 meters from the vehicle’s planned tracks.
As the vehicle drove along collecting nodules, it created a plume that eventually spread past the mooring after an hour or two.
This “drive-by” maneuver enabled the team to monitor the sediment cloud over a longer timescale of several hours, capturing the plume evolution.

Out of steam

Over multiple vehicle runs, Peacock and his team were able to measure and track the evolution of the sediment plume created by the deep-sea-mining vehicle.

“We saw that the vehicle would be driving in clear water, seeing the nodules on the seabed,” Peacock says.
“And then suddenly there’s this very sharp sediment cloud coming through when the vehicle enters the plume.”

From the selfie views, the team observed a behavior that was predicted by some of their previous modeling studies: The vehicle stirred up a heavy amount of sediment that was dense enough that, even after some mixing with the surrounding water, it generated a plume that behaved almost as a separate fluid, spreading under its own weight in what’s known as a turbidity current.

“The turbidity current spreads under its own weight for some time, tens of minutes, but as it does so, it’s depositing sediment on the seabed and eventually running out of steam,” Peacock says.
“After that, the ocean currents get stronger than the natural spreading, and the sediment transitions to being carried by the ocean currents.”

By the time the sediment drifted past the mooring, the researchers estimate that 92 to 98 percent of the sediment either settled back down or remained within 2 meters of the seafloor as a low-lying cloud.
There is, however, no guarantee that the sediment always stays there rather than drifting further up in the water column.
Recent and future studies by the research team are looking into this question, with the goal of consolidating understanding for deep-sea mining sediment plumes.

“Our study clarifies the reality of what the initial sediment disturbance looks like when you have a certain type of nodule mining operation,” Peacock says.
“The big takeaway is that there are complex processes like turbidity currents that take place when you do this kind of collection.
So, any effort to model a deep-sea-mining operation’s impact will have to capture these processes.”

“Sediment plumes produced by deep-seabed mining are a major concern with regards to environmental impact, as they will spread over potentially large areas beyond the actual site of mining and affect deep-sea life,” says Henko de Stigter, a marine geologist at the Royal Netherlands Institute for Sea Research, who was not involved in the research.
“The current paper provides essential insight in the initial development of these plumes.”

This research was supported, in part, by the National Science Foundation, ARPA-E, the 11th Hour Project, the Benioff Ocean Initiative, and Global Sea Mineral Resources.
The funders had no role in any aspects of the research analysis, the research team states.

Links :

Tuesday, September 27, 2022

Surveying the seabed for the Danish Energy Island

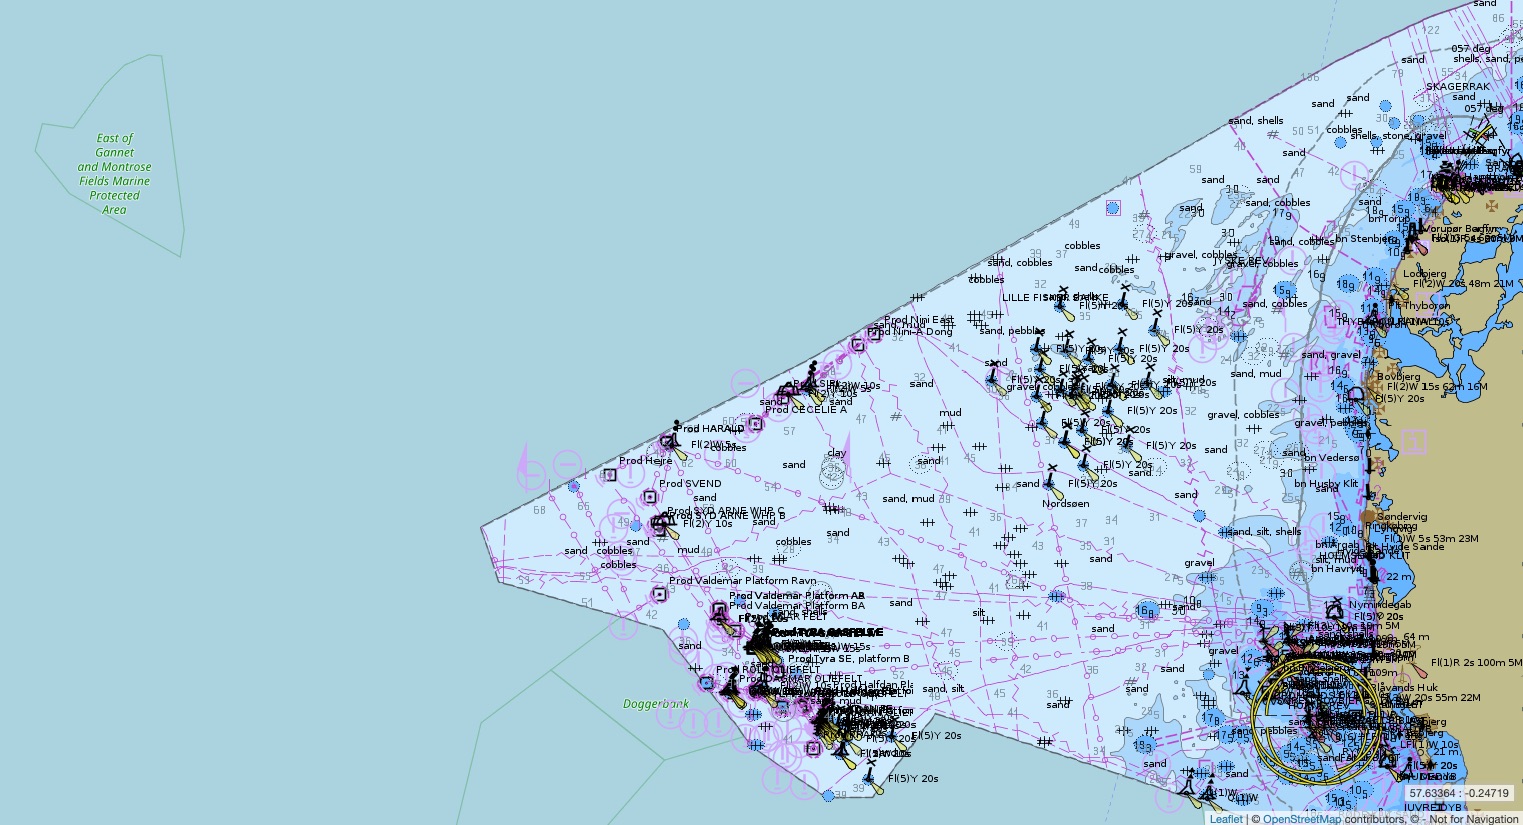
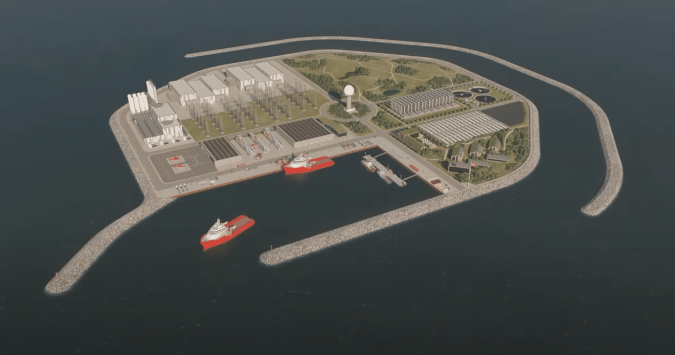
Artist’s impression of the North Sea energy island

From Hydro by Wim van Wegen


How Hydrography is crucial for shaping the renewable revolution

The Danish government is building an energy island in the North Sea, 80 kilometres off the coast, with the aim of accelerating the energy transition.
The ambition is that the island becomes a role model for the green transition globally.
However, the plans for this enormous project will remain just that without geophysical, seismic and hydrographic surveys.
A survey of the seabed, a geophysical study and object detection (i.e.
UXO surveys) have produced a detailed digital map of the seabed and the geological layers beneath it.
This article gives a brief overview of what is involved.

Energinet – the Danish company that will construct and operate the electrical transmission system connecting the island to neighbouring countries – is partnering with a couple of renowned players in the hydrographic surveying sector to make sure that its ambitions are founded on solid ground.
MMT started pre-construction geophysical and seismic surveys in a 526km2 area in May 2021, which will be completed in September 2022, while Fugro has been awarded a marine site characterization contract for the project.

The sea is between 25 and 50 metres deep in the survey area; a relatively shallow sea depth that makes the North Sea an excellent location for large offshore wind farms, and now also an artificial energy island.
The seabed in this area is also suitable for laying foundations for the around 200 offshore wind turbines initially planned, plus the artificial island.

The four phases of the Energy Island location mapping

The work is divided in four phases.
Phase 1 consists of the geophysical survey, including 2D surveys down to 100m below the seabed.
Phase 2 will use remotely operated vehicles (ROVs) to carry out Unexploded Ordnance (UXO) magnetometer surveys.
Phase 3 is a 3D Ultra High Resolution Seismic (UHRS) survey of the energy island locations, and Phase 4 consists of a survey and inspection to assist the Danish Navy in removing confirmed UXO.

The aim of the seabed mapping is to ensure that the North Sea energy island, the surrounding offshore wind farms and the seabed cables are constructed and laid in a manner that, while technically feasible, ensures maximum consideration of nature and the environment.

 
Location of the proposed energy island
 
DK2NORSO ENC North Sea
Scale : 350000 / Cat : 2 / Type : General
Edition_date : 20031209 / Edition : 67 
Update_date : 20220913 / Update : 2


Focusing on the geophysical site survey, which included a 2D UHRS survey, Fugro aimed to exceed the client’s expectations.
Energinet required high specification data, but through the use of the company’s dedicated survey vessels and innovative solutions, Fugro was able to deliver superior data quality.
Fugro mapped the high-resolution bathymetry, static and dynamic elements of the seabed surface and the sub-surface geological soil layers to at least 100m below the seabed.
For this, the Fugro Pioneer, a multipurpose dedicated survey vessel and a range of innovative UHR specialized survey equipment were employed.
The geophysical site survey was completed in October 2021.
The survey and offshore wind consultancy teams then used the acquired geodata to provide reliable site interpretation.

Fugro began the UXO survey in December 2021, and a couple of months later was surveying no fewer than 90 sites, each 150 x 50m in size.
Also part of the package is a high-resolution acoustic survey of the seabed, in which the Fugro Frontier – a multipurpose dedicated survey vessel that can be configured to tow a variety of survey equipment – will play a pivotal role.

Survey challenges and unexpected issues

While the survey work started with very detailed project plans that attempted to mitigate as many risks as possible, there are always challenges that come up on a project of this size and duration.
The three biggest challenges were related to fishing activities, pycnoclines and poor weather conditions.

One example is gill nets, which are used by fishermen but are often not picked up by sonar.
The chance of the equipment getting tangled in the nets is therefore high, and can result in damage to the nets and the equipment – something all parties would like to avoid.
Together with Energinet, Fugro worked to build a good relationship with the local fishing community.
A fishing liaison officer was present onboard Fugro vessels and the fishing community was kept well informed of the areas being surveyed, plus a dedicated scouting vessel was employed to ensure that they did not run across any nets.
If for any reason the Fugro crew came across fishing activities, the towed survey sensors were raised to ensure that they avoided the nets.
While this limited any impact on fishing activities and equipment, it resulted in scans with diluted resolution and reduced coverage, and the crew had to redo the survey to ensure data quality as per client specifications.

Another challenge was the impact of pycnoclines on site investigations.
A pycnocline occurs when water density increases rapidly with depth due to changes in temperature and/or salinity.
As sound travels differently depending on the density of the water, this impacts the coverage of the sonar.
Pycnoclines therefore cause artefacts in the data, obscuring a good image of the seafloor.
To avoid this, a sound velocity check was conducted six hours prior to each survey.
In addition, a moving vessel profiler was used that continuously recorded sound velocity – critical for sonars on a survey.

Finally, challenging weather conditions resulted in vessels being placed on standby.
While weather is of course a factor than cannot be changed, what definitely helped was being able to rely on a very accurate weather forecast model.
Furthermore, Fugro’s Seawatch Wind Lidar Buoys were deployed on-site to provide accurate measurements of wind profiles, waves and current profiles, which were fed into the weather model.
All of this information helped to foresee potential delays and better plan the survey.
Geophysical and geotechnical surveys

Fugro’s dedicated survey vessels arrived on-site in March 2022 to begin the geophysical and geotechnical surveys.
These included ROV inspections and shallow geotechnical investigations using Fugro’s innovative Blue Snake geotechnical system.
The Blue Snake integrates CPT and sampling technology to enable data to be captured in a single pass with testing completed consecutively at fixed distances along the cable route.
The system integrates a high-performance vibrocorer and ten-ton CPT into a single frame with a customized launch and recovery system – minimizing manual handling and improving workability in difficult weather conditions.
This innovative technology optimizes data correlation, improving design and engineering for future cable installation works.

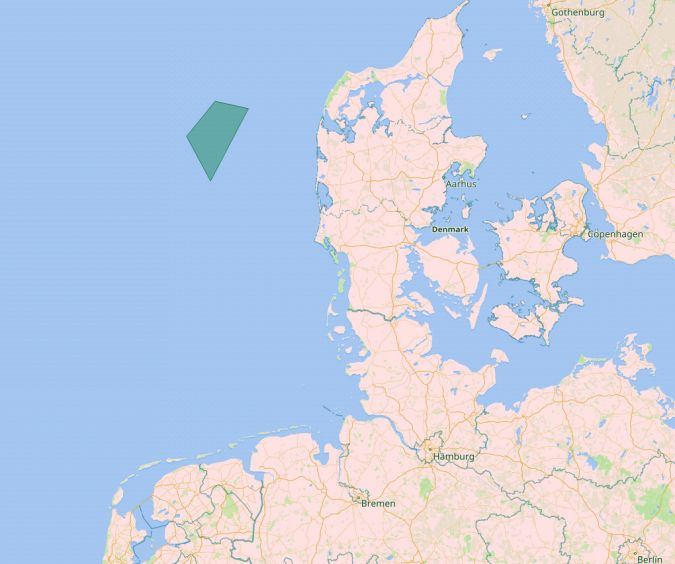
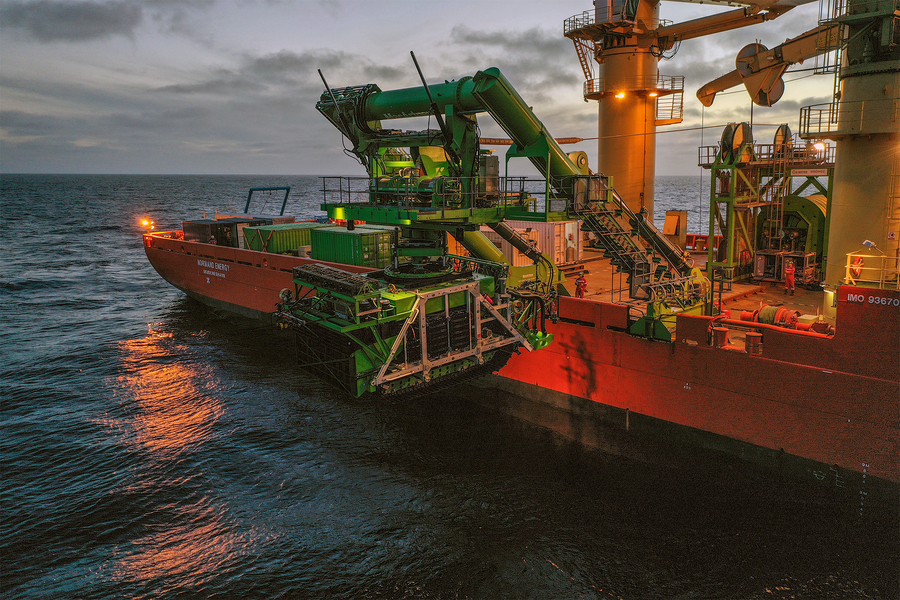
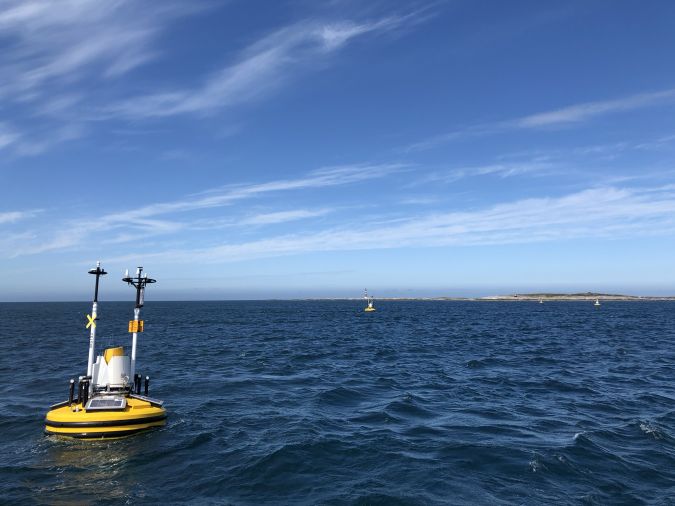
Seawatch Wind Lidar Buoys record continuous wind measurements to support wind-resource mapping for the energy island.

From drawing board to energy island

Of course, preparing plans for such a major project is a process that gradually takes shape, from vague contours (fuelled by a clear vision) to a design that will serve as a pioneering example for the world to make the energy transition happen.
COWI, the renowned Danish international consulting group, was invited to develop alternative concepts to visualize what the world’s first energy island could look like.
Being a project without precedent, it is no wonder that there were many questions that puzzled the COWI engineers involved.
For example, should the energy island be realized in phases or in one go? What is the best way to handle the many mechanical and electrical installations that will be required? Other factors also had to be considered, such as the area requirements, the location in relation to offshore wind farms, and cable landfalls.

The island will be protected from the stormy North Sea on three sides by high sea walls, and promises to be the largest construction project in Danish history.
The artificial island will serve as a hub for offshore wind farms and supply 3GW of energy, with a long-term expansion potential of 10GW.
One challenge is to determine the optimal perimeter protection, as this must be high enough to keep water out while also strong enough to resist natural forces and keep maintenance requirements to a minimum.

The sketches distributed by the Danish Ministry of Energy give an idea of what the island could look like.
The energy island will float but will be attached to the seabed, the depth at the intended location being well suited for this.

Conclusion


The boundless Danish energy ambitions provide many opportunities for the engineering sector, and certainly also for the hydrographic industry.
Renewables are already an important pillar in the success of many companies in our branch, and projects such as the Danish energy island in the North Sea will only boost this.
As this article outlines, such projects provide a lot of work for the recognized specialists that characterize the hydrographic field.
The energy transition will require a lot more survey activities all around the world, but there is one snag: the lack of skilled personnel to conduct all the mapping and surveying projects is clearly a major concern.

Denmark wants to be completely energy neutral by 2050 and in order to make sure that things keep moving, intermediate targets have been set for every five years, with emissions targets for all economic sectors.
The industry has therefore – supported by the government which stimulates research – invested heavily in energy-efficient technologies and renewable energy generation.
The Danish energy transition generates exports and investments worth billions and lowers energy bills for consumers and companies and can count on widespread support within the country.

Focusing on climate and sharing knowledge and technology with foreign countries is proving highly rewarding for Denmark.
To capitalize on the tremendous market potential, the Danish government has launched an export strategy that aims to double energy technology exports to roughly USD20 billion by 2030.

 
The multipurpose dedicated survey vessels Fugro Pioneer and Fugro Frontier are being used to complete the energy island site surveys.
 
Links :

Monday, September 26, 2022

The infamous 1972 report that warned of civilization's collapse


Photograph: JONATHAN ERNST/Getty Images

From Wired by Matt Simon

The Limits to Growth argued that rampant pollution and resource extraction were pushing Earth to the brink.
How does it hold up 50 years later?


The computer modeling made it plain: If people continued to overextract finite resources, pollute on a massive scale, and balloon the human population in an unsustainable way, civilization could collapse within a century.
It sounds like that modeling could have been done last week, what with climate change, water shortages, and microplastics corrupting every corner of the Earth.
But in fact it dropped in the 1972 book The Limits to Growth, published by the Club of Rome, an international organization of intellectuals founded in 1968.

The book sold millions of copies and was translated into at least 30 languages, attracting a storm of controversy.
It was, after all, very early computer modeling—completed on a punch-card machine at MIT—and a highly simplified simulation of complex global systems.
And it was making rather grand and consequential predictions.
(As the old quip goes: All models are wrong, but some are useful.)
That model spit out scenarios in which humanity either got more sustainable and equitable, and thus flourished, or continued letting capitalists plunder the planet and our civilization to death.

“What came from the simulations is that most of the cases—but not all, and it's important to say not all—the evolution of a number of variables like population, production, pollution, was showing that around the mid-21st century, we would have a scenario of collapse of human civilization,” says Carlos Alvarez Pereira, vice president of the Club of Rome and co-editor of the new retrospective book Limits and Beyond: 50 Years on From The Limits to Growth, What Did We Learn and What’s Next? “The whole thing was framed into doomsday prophecy.
We didn't succeed in bringing the message that it was not about that.
It was really about: We have the capacity to choose.
We have, as humanity, the capacity to decide what kind of future we want.”

To mark the book’s 50 year anniversary, WIRED sat down with Alvarez Pereira to talk about how that future is shaping up, what’s changed in the half-century since Limits, and how humanity might correct course.
The conversation has been condensed and edited for clarity.

WIRED: For folks who aren't familiar with the original report, can you give a background?

Carlos Alvarez Pereira: It was an attempt to open the space of possibilities for the future of humanity.
In the ’60s and early ’70s, the fundamental question was: Is it possible to expand the concept of human development we had at the time to the whole planet, without negative consequences?

Limits to Growth was, I think, a serious and rigorous attempt to use the best, not only knowledge, but also computer tools, which at the time were quite primitive, to simulate a number of scenarios for the future, to inquire on this big question.
In some scenarios it was conceivable to find a balance between human well-being or human development, and the finiteness of resources on Earth.

WIRED: Let’s take two of the report’s extreme scenarios.
What factors produce collapse, and which produce a more sustainable future where we avoid collapse? Is it bringing down pollution? Is it bringing down consumption?

CAP: The main variables are a set of five: population, food production, industrial production, natural resources, and pollution.
What produces collapse in most of the scenarios is the combination—it's not all only one thing.
In the case of fossil fuels, it's both the consumption of the reserves of fossil fuels and the pollution.

What could lead to a more sustainable scenario, or a scenario of balance? Fundamentally, it is about equity, managing the resources in an equitable way, knowing in advance that they're limited.
Realizing that it's not higher and higher consumption which makes us live in a good way, have a healthy life and well-being.
It's the quality of our relationships with other humans, with nature, that makes possible the scenarios in which you can decouple well-being and the growth of consumption.

We have incredible capacities to develop new technologies, but the point is that we don't use them under the assumption that they should reduce the ecological footprint.
This is not a criteria of design.
And let's remember that ecological footprints are extremely unequal.
Typically, the average footprint in the US is 20 to 40 times the average footprint in Africa.

WIRED: Right, there's this notion that first and foremost the problem we have is population growth.
But that ignores the fact that the United States alone is responsible for a quarter of historical emissions.
It's not so much the fact that we have more people, it's that we have unsustainable lifestyles.


CAP: We already have an ecological footprint that is far too high compared to what the Earth can carry.
It's a matter, in my view, of considering that well-being comes with relationships, not necessarily a high degree of material consumption.
It's a matter of considering that we can dramatically reduce the ecological footprint of the so-called rich countries.
I know that it sounds weird, because we are so used to associating well-being with material consumption.
Saying this is like, “Oh, we are proposing going back to the Middle Ages.” No, not at all.

WIRED: I think you could safely characterize the reaction to Limits to Growth as an uproar.
Did that come from scientists or capitalists or politicians? Or maybe all of the above? What were the main points of contention?


CAP: We have to be in a good balance with the planet where we live.
And that part of the message was completely lost, very rapidly.
Jimmy Carter, when he was president, was listening to this kind of approach.
And then of course, the political mood changed a lot with the rise of Ronald Reagan and Margaret Thatcher.
Reagan himself has a discourse in which he says, literally, there are no limits to growth.
So from a political point of view, there was a complete denial of what the book was saying.

What creates a little bit of frustration is that in the scientific domain, there was not enough controversy, because somehow the book was discarded by many.
Not by everybody.
By many, it was discarded as a doomsday prophecy.
And for sure, we were not successful among economists at the time.

WIRED: Presumably economists weren't too fond of it because growth is inherent to capitalism.
And unchecked growth really, a kind of maniacal, ecologically-destructive growth at all costs that's built into the system.

CAP: What the system has done, as a mechanism to continue with growth at all costs, is actually to burn the future.
And the future is the least renewable resource.
There is no way that we can reuse the time we had when we started this conversation.
And by building up a system which is more debt-driven—where we keep consumption going, but by creating more and more debt—what we're actually doing is burning or stealing the time of people in the future.
Because their time will be devoted to repaying the debt.

WIRED: It seems obvious that we’ll eventually run out of finite resources.
But there was even pushback against that idea when the report came out.
Where does that insistence come from?


CAP: The paradox is that capitalism is also based on the notion of scarcity.
Our system is organized around the idea that resources are scarce, then we have to pay for them, and people in the value chain will profit from this idea of scarcity.
Conventional capitalism is saying that while these resources might be finite, we will find others: Don't worry, technology will save us.
So that we continue in the same way.

WIRED: 50 years on from the original report, are we on the right course as a species?


CAP: No, if you look at the reality.
And no, in particular, if you look only at what governments and corporations do, if you look at what the decision makers decide, and the systems of governance we have, whether national or global.
We're not better in terms of pollution, because we have climate warming, an existential issue.
We're not better in terms of biodiversity.
We are not in terms of inequality.
So there are plenty of reasons to say no.

But there are also good reasons for optimism of the will.
And those reasons are possibly less obvious, less evident, less in the headlines in the media and elsewhere.
We definitely think there is an ongoing cultural change often hidden in plain sight.
Many are experimenting, often at the community level, trying to find their own pathways towards that balance of well-being within a healthy biosphere.
A change that brings hope to me is the change in the status of women, the increasing roles of women.
And I would say that if you look at what’s happening with the younger generations, there is a big change as well.

So politically, at the level of corporations, at the official level, things are going pretty much in the wrong direction.
Culturally, below the line, my bet is that a lot of things are happening in the good direction.
The human revolution is already happening—it's just that we don't see it.
And maybe it's good that we don't see it yet, until the very moment where it makes a lot of things shift.

Links :