It was a first in sailing, shedding new light on an event taking place hundreds of kilometers from the shoreline.
The crashing waves and turbulent seas of the Volvo Ocean Race have never been captured in more dramatic style than when Sam Greenfield first brought drone footage to the event often dubbed the world's toughest race.
"It was just a shot that hadn't been done before and it was, you know, an opportunity to get a perspective off the boat that no one had ever seen," Greenfield tells CNN Mainsail.
"I just went for it on the most absolutely dead calm day in the middle of the ocean and slowly worked up confidence ... it's really awesome to see that it's just something that everyone's embracing."
Yann Riou (team Brunel) shows how you do a drone flight on moving ship on the middle of the ocean.
This year's Volvo Ocean Race is 46,000 nautical miles, traversing four oceans, six continents and 12 host cities.
The event's nine-month long progress can be tracked online, where competitors are currently on their sixth leg between Hong Kong and Auckland.
Onboard reporter Sam Greenfield is the first person to record the iconic Volvo Ocean Race from an aerial perspective.
Travelling together with the ship’s crew, he used a DJI Phantom to capture the race from his behind-the-scenes point of view.
These unique images show the true scale of the Volvo Ocean Race.
Mastering the art
Growing up in the Noank, Connecticut, a small village with a rich history on fishing, sailing and ship-building, Greenfield hails from seafaring stock.
He made history in the 2014-15 edition when he successfully flew a drone above the Dongfeng Race Team yacht while serving as an on-board reporter (OBR).
He describes his role as "the direct link between the race yacht crew and the rest of the world," wrestling with the elements to capture the perfect angle of the race for each of the seven teams competing.
"It can be really easy or it can be really challenging depending on the sea state and the wind conditions," says Greenfield.
"If it's over 25 knots (46km/h) you get sea spray which can take the drone down. If you have a lot of waves and you're going up-wind retrieving it is incredibly difficult.
"But if you're running down-wind and the boat's going fast and you have long waves it's actually kind of pleasant after a bit of practice."
courtesy of Ugo Fonollá, mediaman onboard of Mapfre
'More risks' lie ahead
On the surface, the Volvo Ocean Race may not seem particularly spectator-friendly; but take a tour of the race's website, and you'll find videos, photos, live satellite trackers, blogs and leaderboards -- much of which has been captured within the past hour.
Mirpuri Foundation "Turn the Tide on Plastic" boat drone footage during Volvo Ocean Race Leg 2 from Lisbon to Cape Town.
courtesy of James Blake, mediaman onboard of "Turn the Tide on Plastic"
Greenfield's innovation may have been a leap into the future of sailing, but he predicts that viewers will be brought even closer to the sport in the coming years.
"I think people really want to see live stream content from really remote parts of the world," he says.
"Basically launch a drone, have it direct back into somebody's living room with commentary from the boat and I think that's probably available now if not very soon.
"And beyond that it's just going to be bigger conditions, bigger waves and more risks ... in terms of what you're seeing and what it's actually like out there."
A powerful new weather satellite launched today (March 1) from Cape Canaveral Air Force Station in Florida, heading toward a perch above the eastern Pacific Ocean to monitor extreme weather as it develops.
NOAA's GOES-S satellite launched March 1 on ULA's Atlas V rocket from Cape Canaveral Air Force Station in Florida.
The advanced weather satellite will give researchers and meteorologists unparalleled views of the U.S. West
The satellite, called GOES-S (Geostationary Operational Environmental Satellite-S), lifted off on ULA's Atlas V rocket at 5:02 p.m.EST (2202 GMT).
The National Oceanic and Atmospheric Administration (NOAA) will operate GOES-S in partnership with NASA.
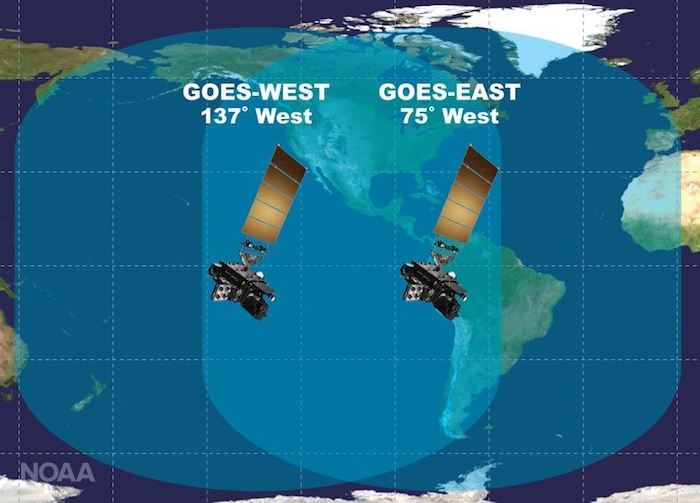
The Lockheed Martin-built satellite will join GOES-East, currently in orbit, to provide a broad, high-definition view of weather on Earth.
It is the second in a series of four advanced weather satellites that will reside in geostationary orbit — hanging in place over one spot on Earth as they orbit and the world turns.
"GOES-S will provide more accurate data with higher temporal resolution to track storm systems, lightning, wildfires, the coastal fog [and] volcanic ash plumes that impact the western U.S., Alaska, Hawaii and the coastal to eastern Pacific ocean," Louis Uccellini, director of the National Weather Service at NOAA, said during a news conference Tuesday (Feb. 27).
"There are unique aspects of these intense Pacific storms that we'll be able to observe more accurately and use in our forecast process."
"I believe very strongly GOES-S will improve the scientific understanding for the western U.S., just like GOES-East has for the eastern U.S., and is another step forward in our overall effort to build a weather-ready nation," Uccellini added.
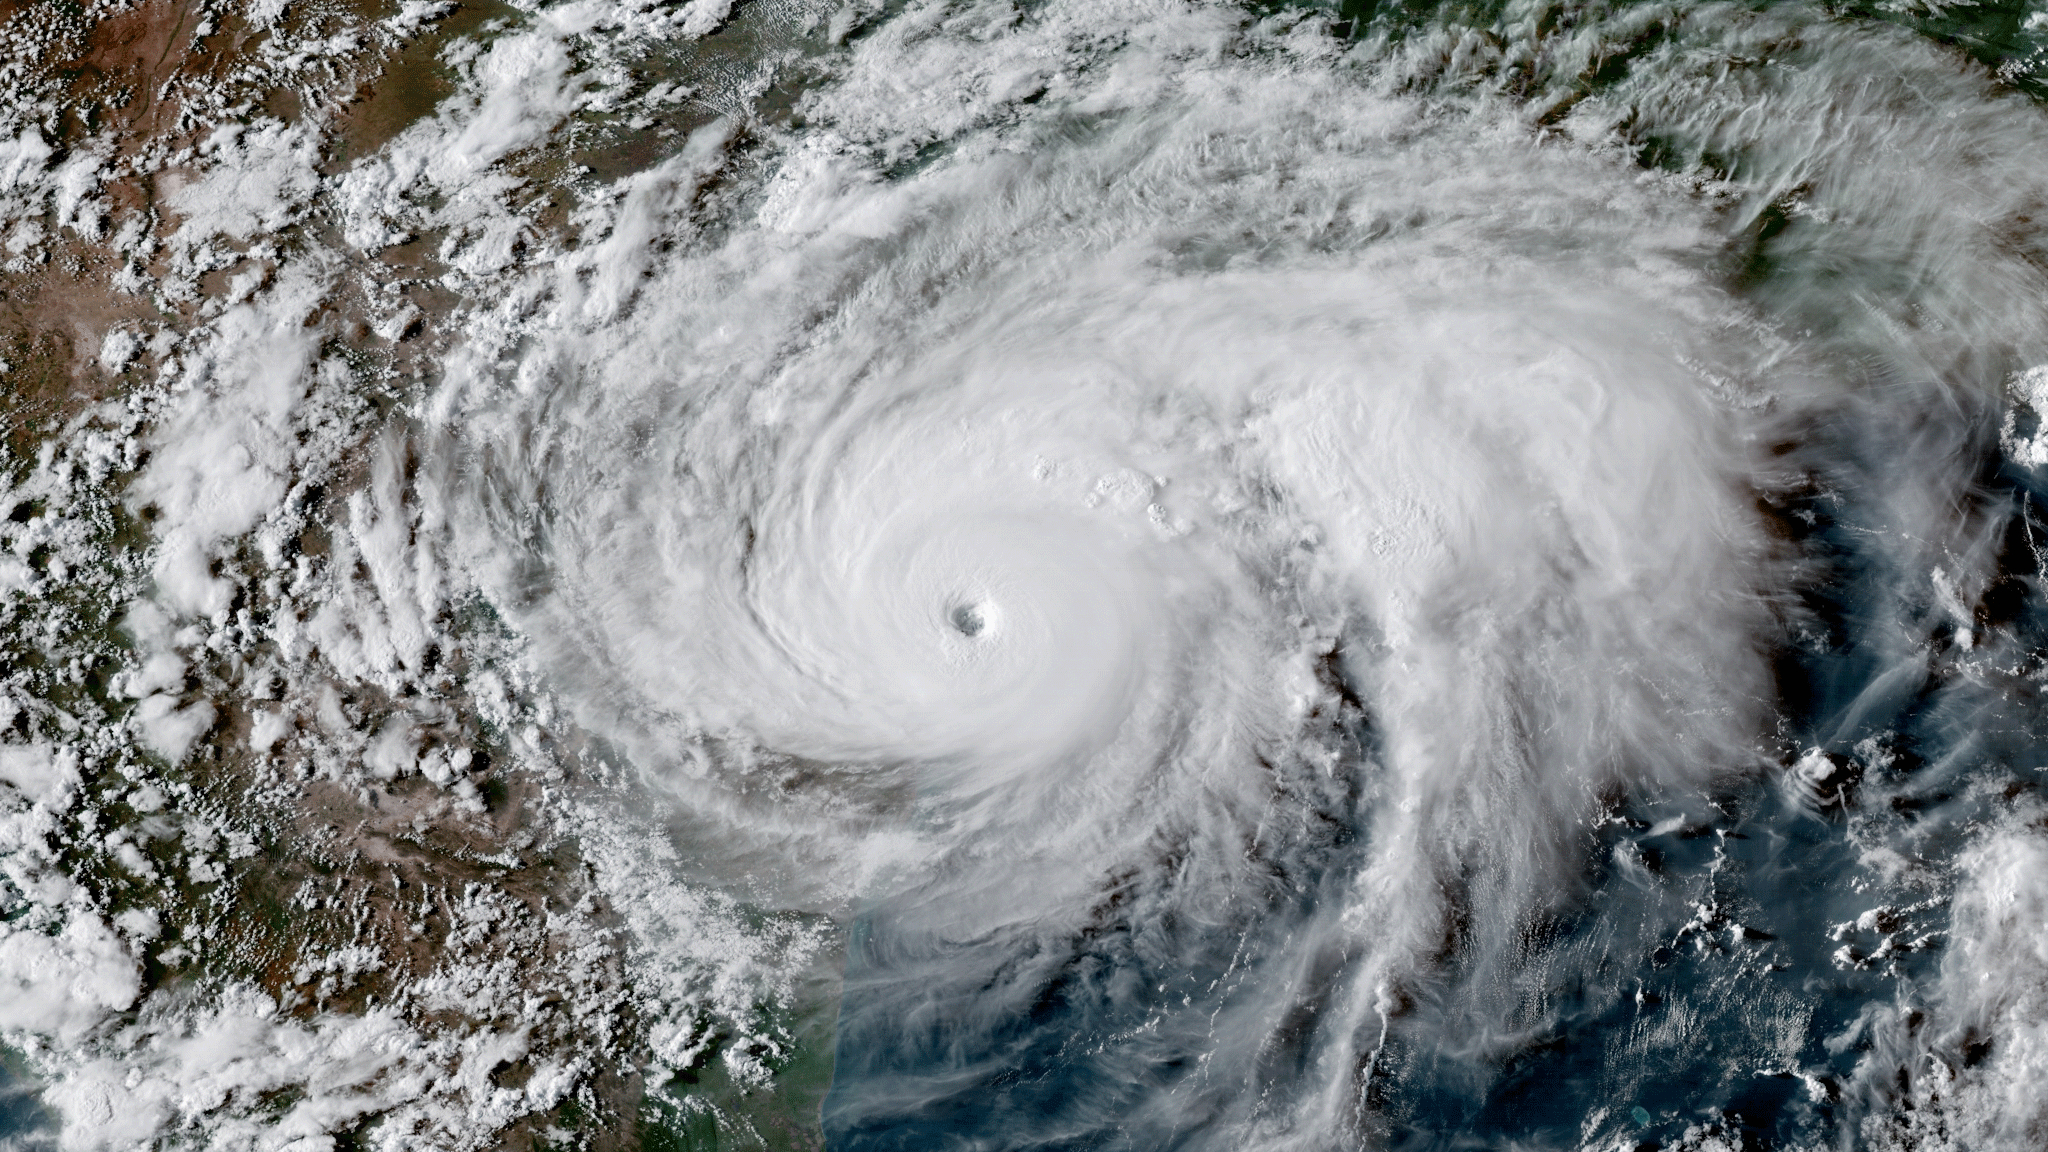
GOES-16 imagery of Hurricane Harvey making landfall in Texas on August 25, 2017. (NOAA) Like GOES-16, which provided groundbreaking new data and imagery during the severe 2017 Atlantic hurricane season, GOES-S will bring this same new technology to the Pacific Ocean.
This means forecasters will have new high-resolution imagery of atmospheric rivers, as well as Pacific hurricanes that track toward Hawaii or Mexico during the summer and autumn.
The current GOES-East satellite launched in 2016, and it has provided views of developing weather in unprecedented detail.
NOAA used GOES-East to track hurricanes Harvey, Irma, Maria and more, as well as January's bomb cyclone and other extreme weather events, including wildfires developing in northern Texas.
The new GOES-S will be at a vantage point to help analyze California's wildfires in more detail, as well.
The satellite will scan the skies five times faster than the GOES-West satellite it will replace, will have four times the spatial resolution and use three times as many spectral bands.
Besides fire, lightning and tropical storms, the satellite can also track the influx of charged particles and radiation from the sun called space weather.
The satellite will be able to scan each spot below it every 5 minutes, or every 1 minute to 30 seconds on special focus areas — in the latter case, for developing weather events.
Together, GOES-S (which will be renamed GOES-West) and GOES-East will be able to focus on four locations to refresh views every minute, or two locations to refresh views every 30 seconds.
"Those of us in the severe weather community are really excited about the data we're seeing from GOES-16 [GOES-East]," Kristin Calhoun, a research scientist with NOAA's National Severe Storms Laboratory, said during the conference.
"And we're also eagerly anticipating the increased coverage from GOES-S across the United States."
"For the first time, space-based observations from geostationary satellites and ground-based observations such as Doppler weather radars are in cadence with each other, providing the ability to create a top-to-bottom, linked profile of a severe thunderstorm through direct observation," Calhoun added.
"This has a direct impact on severe thunderstorm research, diagnosis and hazardous weather forecasting."
You don’t have to live on the West Coast to know that coastal fog is a hallmark weather event in places like San Francisco and parts of the Pacific Northwest.
Not only will GOES-S provide high-resolution, real-time imagery of fog conditions, but the satellite’s rapid scanning capabilities will also help forecasters predict when fog will clear.
A visceral view
At the news conference and at another one held earlier on Feb. 27, NOAA and NASA researchers shared stories of how GOES-East's remarkably clear views have aided in search-and-rescue operations as well as in forecasting.
During Hurricane Harvey, for instance, data from the satellite allowed first responders to know when it was safe to go out as the storm's eye passed overhead, rescuing more than 200 people — and when to take shelter just before the back of the eyewall swept back over.
During wildfire season in California, people using GOES data were able to warn local authorities about fires before they'd even been spotted on the ground.
And just viewing weather events in so much detail makes it easier to learn how they work.
"The impact of the visualization, the actual videos, the movies coming out is really visceral," Steve Volz, NOAA's director for satellite and information services, said in the earlier conference.
"It allows the researchers to see the dynamics in a way that just looking at numbers just doesn't reveal — the visual impact is remarkable."
Special mention: A major upgrade for AlaskaCurrent geostationary satellite coverage of Alaska, such as this recent GOES-15 visible imagery, will be replaced by high-resolution imagery in 16 different channels. GOES-S will boost weather prediction all across the western U.S., but the new satellite will be especially valuable to Alaska.
That’s because NOAA’s current geostationary satellites lack sufficient resolution in regions near the Arctic.
GOES-S, however, will provide a significantly clearer view of the Last Frontier - all the way to Alaska’s North Slope, and allow for applications such as tracking sea ice.
The satellite was deployed a little after 8:30 p.m. EST today (1:30 a.m. GMT on March 2).
It will now spend about three weeks making its way into geostationary orbit.
After about six months at that latitude preparing its instruments and running checks, it will move to its final vantage point over the eastern Pacific Ocean, taking on the official name GOES-West.
GOES-S will complement other geostationary satellites, like GOES-East, as well as polar-orbiting satellites like JPSS-1, which launched last November.
Several other nations share weather satellite data with each other and NOAA to provide more complete coverage.
"Every forecast, whether it's one day, two days, three days, out to seven days in advance, depends on sophisticated numerical models, the world's fastest computers and a global observing system," Uccellini said.
"And NOAA's satellite data provides the backbone for the global observing system, and is the critical element for weather forecasting in the extended ranges.
The geostationary satellite, the GOES series, is a crucial component of today's global observing system."
The four-satellite GOES-R program has a total budget of $10.8 billion through its entire life cycle.
Development began in 2005, and the program will extend through 2036.
The next satellite, GOES-T, is scheduled for launch in 2020.
Winter temperatures are soaring in the Arctic for the fourth winter in a row.
The heat, accompanied by moist air, is entering the Arctic not only through the sector of the North Atlantic Ocean that lies between Greenland and Europe, as it has done in previous years, but is also coming from the North Pacific through the Bering Strait.
“We have seen winter warming events before, but they’re becoming more frequent and more intense,” said Alek Petty, a sea ice researcher at NASA’s Goddard Space Flight Center in Greenbelt, Maryland.
Scientists are waiting to see how much this heat wave will impact the wintertime sea ice maximum extent, which has been shrinking in the past decades and has hit record lows each of the past three years.
The sea ice levels are already at record lows or near-record lows in several areas of the Arctic.
Another exceptional event this winter is the opening up of the sea ice cover north of Greenland, releasing heat from the ocean to the atmosphere and making the sea ice more vulnerable to further melting.
“This is a region where we have the thickest multi-year sea ice and expect it to not be mobile, to be resilient,” Petty said.
“But now this ice is moving pretty quickly, pushed by strong southerly winds and probably affected by the warm temperatures, too.”
An alarming heatwave in the sunless winter Arctic is causing blizzards in Europe and forcing scientists to reconsider even their most pessimistic forecasts of climate change.
Although it could yet prove to be a freak event, the primary concern is that global warming is eroding the polar vortex, the powerful winds that once insulated the frozen north.
Daily 2 m surface air temperature for the Arctic averaged above 80°N.
Individual years from 1958-2017 are shown by the sequential blue/purple to yellow lines.
2018 is indicated by the red line.
ERA40 has been applied for the 1958-2002 climatology (white line), while the operational ECMWF is used for the current year.
The north pole gets no sunlight until March, but an influx of warm air has pushed temperatures in Siberia up by as much as 35C above historical averages this month.
Greenland has already experienced 61 hours above freezing in 2018 - more than three times as many hours as in any previous year.
Seasoned observers have described what is happening as “crazy,” “weird,” and “simply shocking”.
“This is an anomaly among anomalies.
It is far enough outside the historical range that it is worrying – it is a suggestion that there are further surprises in store as we continue to poke the angry beast that is our climate,” said Michael Mann, director of the Earth System Science Center at Pennsylvania State University.
“The Arctic has always been regarded as a bellwether because of the vicious circle that amplify human-caused warming in that particular region.
And it is sending out a clear warning.”
Although most of the media headlines in recent days have focused on Europe’s unusually cold weather in a jolly tone, the concern is that this is not so much a reassuring return to winters as normal, but rather a displacement of what ought to be happening farther north.
Annual average 2-m temperature anomalies in the Arctic (67°N+) for various reanalysis data sets.
Anomalies are calculated from a 1981-2010 baseline. courtesy of Zachary Labe
At the world’s most northerly land weather station - Cape Morris Jesup at the northern tip of Greenland – recent temperatures have been, at times, warmer than London and Zurich, which are thousands of miles to the south.
Although the recent peak of 6.1C on Sunday was not quite a record, but on the previous two occasions (2011 and 2017) the highs lasted just a few hours before returning closer to the historical average.
Last week there were 10 days above freezing for at least part of the day at this weather station, just 440 miles from the north pole.
“Spikes in temperature are part of the normal weather patterns – what has been unusual about this event is that it has persisted for so long and that it has been so warm,” said Ruth Mottram of the Danish Meteorological Institute.
“Going back to the late 1950s at least we have never seen such high temperatures in the high Arctic.”
NASA satellite imagery shows a strong storm near Greenland on Feb. 23 that drew a major pulse of warm air into the Arctic.
The cause and significance of this sharp uptick are now under scrutiny.
Temperatures often fluctuate in the Arctic due to the strength or weakness of the polar vortex, the circle of winds – including the jetstream – that help to deflect warmer air masses and keep the region cool.
As this natural force field fluctuates, there have been many previous temperature spikes, which make historical charts of Arctic winter weather resemble an electrocardiogram.
But the heat peaks are becoming more frequent and lasting longer – never more so than this year.
“In 50 years of Arctic reconstructions, the current warming event is both the most intense and one of the longest-lived warming events ever observed during winter,” said Robert Rohde, lead scientist of Berkeley Earth, a non-profit organisation dedicated to climate science.
The question now is whether this signals a weakening or collapse of the polar vortex, the circle of strong winds that keep the Arctic cold by deflecting other air masses.
The vortex depends on the temperature difference between the Arctic and mid-latitudes, but that gap is shrinking because the pole is warming faster than anywhere on Earth.
While average temperatures have increased by about 1C, the warming at the pole – closer to 3C – is melting the ice mass.
According to Nasa, Arctic sea ice is now declining at a rate of 13.2% per decade, leaving more open water and higher temperatures.
GFS model analysis of temperature difference from normal (in Celsius) on Sunday over the Arctic.
The temperature is above freezing at the North Pole.
(University of Maine Climate Re-analyzer)
GFS model analysis of temperatures (in Celsius) on Sunday over the Arctic.
(University of Maine Climate Re-analyzer)
Some scientists speak of a hypothesis known as “warm Arctic, cold continents” as the polar vortex becomes less stable - sucking in more warm air and expelling more cold fronts, such as those currently being experienced in the UK and northern Europe.
Rohde notes that this theory remains controversial and is not evident in all climate models, but this year’s temperature patterns have been consistent with that forecast.
Longer term, Rohde expects more variation.
“As we rapidly warm the Arctic, we can expect that future years will bring us even more examples of unprecedented weather.”
Jesper Theilgaard, a meteorologist with 40 years’ experience and founder of website Climate Dissemination, said the recent trends are outside previous warming events.
“No doubt these warming events bring trouble to the people and the nature.
Shifting rain and snow – melt and frost make the surface icy and therefore difficult for animals to find anything to eat.
Living conditions in such shifting weather types are very difficult.”
Others caution that it is premature to see this as a major shift away from forecasts.
“The current excursions of 20C or more above average experienced in the Arctic are almost certainly mostly due to natural variability,” said Zeke Hausfather of Berkeley Earth.
“While they have been boosted by the underlying warming trend, we don’t have any strong evidence that the factors driving short-term Arctic variability will increase in a warming world.
If anything, climate models suggest the opposite is true, that high-latitude winters will be slightly less variable as the world warms.”
Although it is too soon to know whether overall projections for Arctic warming should be changed, the recent temperatures add to uncertainty and raises the possibility of knock-on effects accelerating climate change.
“This is too short-term an excursion to say whether or not it changes the overall projections for Arctic warming,” says Mann.
“But it suggests that we may be underestimating the tendency for short-term extreme warming events in the Arctic.
And those initial warming events can trigger even greater warming because of the ‘feedback loops’ associated with the melting of ice and the potential release of methane (a very strong greenhouse gas).”
In 1939, Coast Survey published its first chart with a new focus on depth contours. The new depth curves helped navigators of that era locate the position of their vessels by comparing a line of echo soundings with the charted depth contours. Publisher: US C&GS Coast & Geodetic Survey (1939) Image: 5101a-03-1939 / Scale: 1:232702
In 1844, the United States Coast Survey published its first official nautical chart.
It was the result of an immense amount of manual topographic and hydrographic surveying, manual drafting, manual engraving on copper printing plates, and manual intaglio printing (using black ink from copper plates).
In 1939, the United States Coast and Geodetic Survey (C&GS) published its first nautical chart that included isobaths as the primary representation of the seafloor rather than individual depth soundings.
Data for the isobaths were collected by a recording echo sounder, while topographic revision was performed from aerial photographs.
The production process included manual and mechanical scribing on wet-plate glass negatives; additional chart compilation using photography to merge in standard elements; photographic transfer to aluminum lithographic printing plates; and printing in multiple colors on a powered rotary offset press.
A major innovation for the C&GS came in March 1939 with the publication of a new edition of Chart 5101, designated 5101A (U.S. Department of Commerce et al. 1940, 99; Shalowitz 1964).
It marked the beginning of a new role for bathymetric contours.
It was the first chart designed for ships that have their own echo-sounders on board.
Recording echo sounders allowed the survey to collect orders of magnitude more information about landforms at the bottom of water bodies.
Continuing to place primary responsibility for representing this information with the point data that soundings represent did not do justice to the richness of the data now available.
Instead of playing a subsidiary role to the soundings on the chart, contours could now play the same role as topographic contours, that of being the primary representation of the land surface.
This change in role can be seen in such chart editions as MH400 1938, 1942, and 1951, and E1200 1927, 1938, and 1948.
As these series progress, contours gain significant detail, while soundings either remain as they were or, as in E1200 1948, are dramatically reduced.
NOAA 18740 (click on the link to see the interactive map) current nautical chart with the GeoGarage platform overlaid on Google Maps imagery and bathymetry
The beginning of the full transition away from the last of the original techniques began in 1939 when the first chart was published that fully incorporated the possibilities for different symbology offered by the vast quantities of data created by recording echo sounders.
Charts continued to evolve after 1939, entering a new phase around 1980 based on internationally approved symbology, but the greatest changes are evident by 1939.
A new theory suggests that Homo erectus was able to create seagoing vessels – and must have used language to sail successfully
Language was necessary for the spread of toolmaking technology, as well as for boat-building and sailing, researchers suggest.
Illustration: Alamy Stock Photo
They had bodies similar to modern humans, could make tools, and were possibly the first to cook.
Now one expert is arguing that Homo erectus might have been a mariner – complete with sailing lingo.
Homo erectus first appeared in Africa more than 1.8m years ago and is thought to be the first archaic human to leave the continent.
H. erectus fossils have turned up not only in Southern Europe, but as far afield as China and Indonesia.
Some argue that the mysterious hominid Homo floresiensis, discovered on the island of Flores, could be descended from H.erectus– although others disagree.
“Oceans were never a barrier to the travels of Erectus.
He travelled all over the world, travelled to the island of Flores, across one of the greatest ocean currents in the world,” said Daniel Everett, professor of global studies at Bentley University, and author of How Language Began.
“They sailed to the island of Crete and various other islands.
It was intentional: they needed craft and they needed to take groups of twenty or so at least to get to those places.”
While Everett is not the first to raise the controversial possibility that H. erectus might have fashioned some sort of seagoing vessel, he believes that such capabilities mean that H.erectus must also have had another skill: language.
“Erectus needed language when they were sailing to the island of Flores.
They couldn’t have simply caught a ride on a floating log because then they would have been washed out to sea when they hit the current,” said Everett, presenting his thesis at the meeting of the American Association for the Advancement of Science in Austin.
“They needed to be able to paddle. And if they paddled they needed to be able to say ‘paddle there’ or ‘don’t paddle.’ You need communication with symbols not just grunts.”
A 540 thousand year-old art object shows that prehistoric upright walkers may have had quite a bit more going on upstairs that people give them credit for.
The engraving is at least 430000 years old, meaning it was done by the long-extinct Homo erectus, said the study.
The oldest man-made markings previously .
It is unknown when language emerged among hominids; some argue that it is a feature only of our own species, Homo sapiens, which suggests a timing of no earlier than 200,000 years ago.
But Everett believes it goes back further than that.
Everett says that H. erectus would have been unable to make the same range of sounds as we do, not least because they lacked the version of a gene necessary for speech and language to develop – known as FOXP2 – found in modern humans and Neanderthals, although it is not clear whether Neanderthals had language.
But he argues that as few as two sounds are needed for a language, and that it is likely H.erectus could make more than that.
“They had what it took to invent language – and language is not as hard as many linguists have led us to believe.
If you have symbols in a linear order then you have a grammar,” said Everett.
“Homo erectus spoke and invented the Model T Ford of language.
We speak the Tesla form, but their Model T form was not a proto-language it was a real language.”
“Everybody talks about Homo erectus as a stupid ape-like creature, which of course describes us just as well, and yet what I want to emphasise is that Erectus was the smartest creature that had ever walked the Earth,” he said.
The theory received mixed reactions from others.
Kevin Laland, professor of behavioural and evolutionary biology at the University of St Andrews, said he agreed with Everett.
“The important thing to recognise is that language did not appear in modern form all at once, but gradually evolved from a protoculture comprising just a handful of words with little grammatical structure.
Certainly, it is highly plausible that Homo erectus had a protolinguistic capability,” he said, adding that work by his own team hinted it was possible.
“Our experiment suggests that it would have been very difficult for knowledge of how to manufacture Homo erectus’s Acheulian stone tools to spread without a simple form of language.
The study also demonstrates that stone toolmaking would had created a selection pressure favouring increased linguistic capabilities,” he said.
But others say that there is little evidence that H.
erectus was a sophisticated seafarer, let alone had a language.
“I don’t accept that, for example, [Homo] erectus must have had boats to get to Flores,” said Chris Stringer, head of human origins at the Natural History Museum in London.
“Tsunamis could have moved early humans on rafts of vegetation.”
That said, Stringer notes that Homo heidelbergensis, another extinct relative of ours that lived between 700,000 and 300,000 years ago, might have been capable of some sort of chat.
“I think [Homo] heidelbergensis had a complex enough life to require speech, though not at the level of modern human language.
With [Homo] erectus, I’m not so sure,” said Stringer, adding that the ability of H. erectus to make and use tools is not, as some have argued, convincing evidence.
“Chimps and crows make and use tools without a human kind of language,” he said.
Tech giant Google (Nasdaq: GOOG) is partnering with the Marine Industries Association of South Florida to create a water version of its popular Google Street View maps that would cover the region’s major waterways.
Not only will this create a detailed visual map covering 143 nautical miles along the Intracoastal Waterway and Biscayne Bay from the Palm Beach County line in Jupiter through Ocean Reef in Key Largo, it will provide the opportunity for nearby businesses to reach customers on their boats.
"This is an incredible opportunity to add another tool to the toolkit of the marine industry in South Florida, which employs 136,000 people and produces an annual economic impact of $11.5 billion,” said Phil Purcell, CEO and president of MIASF.
“Just as Google Street View is a valuable instrument and a trusted way for businesses to connect with customers, Waterway View has the potential to be the most exciting new resource for the boating lifestyle, connecting boaters with restaurants, marinas, fuel docks, service and sales centers, and all the other resources they may need.”
The Google Waterway View should launch as a mobile app by June when the mapping is completed. A web browser version will be available sooner.
Businesses will be able to buy a listing to be promoted on the map, or provide a 360-degree view inside their business.
MIASF will work with local businesses that want to utilize the new maps with Google.
Drivers on the roads can now use mapping programs to find gas stations or restaurants, so this service would provide the same aid to boaters.
That’s especially helpful because the waterways don’t have as many signs advertising the locations of businesses as roads do.
“Florida leads the country in boat registrations and its waterways are used by locals and tourists every day of the year,” said Google Virtual Reality partner, Jim Hilker.
"This will be a very useful platform for experienced boaters, newcomers, and tourists looking to access the many locations available to them by water.”
MarineMax and Boat Owners Warehouse are providing the boats that will transport the Google cameras through South Florida’s waterways.
In addition to the Intracoastal Waterway and Biscayne Bay, the map will cover some adjoining rivers, inlets and commercial canals.
“The goal of this initiative is to increase awareness on the waterways, said Chuck Cashman, chief revenue officer for MarineMax.
“Boaters can plan a day out on the water in advance through a visual familiarization of local boating hotspots and boating-friendly businesses.”
World’s ultra-rich are buying subs for up to £30m to indulge in deep ocean exploring
Anew toy has surfaced on the must-have list of leisure options for the world’s billionaire class: private submersibles they can use to explore the oceans – or even use as James Bond-style means of escape if their superyacht should come under attack.
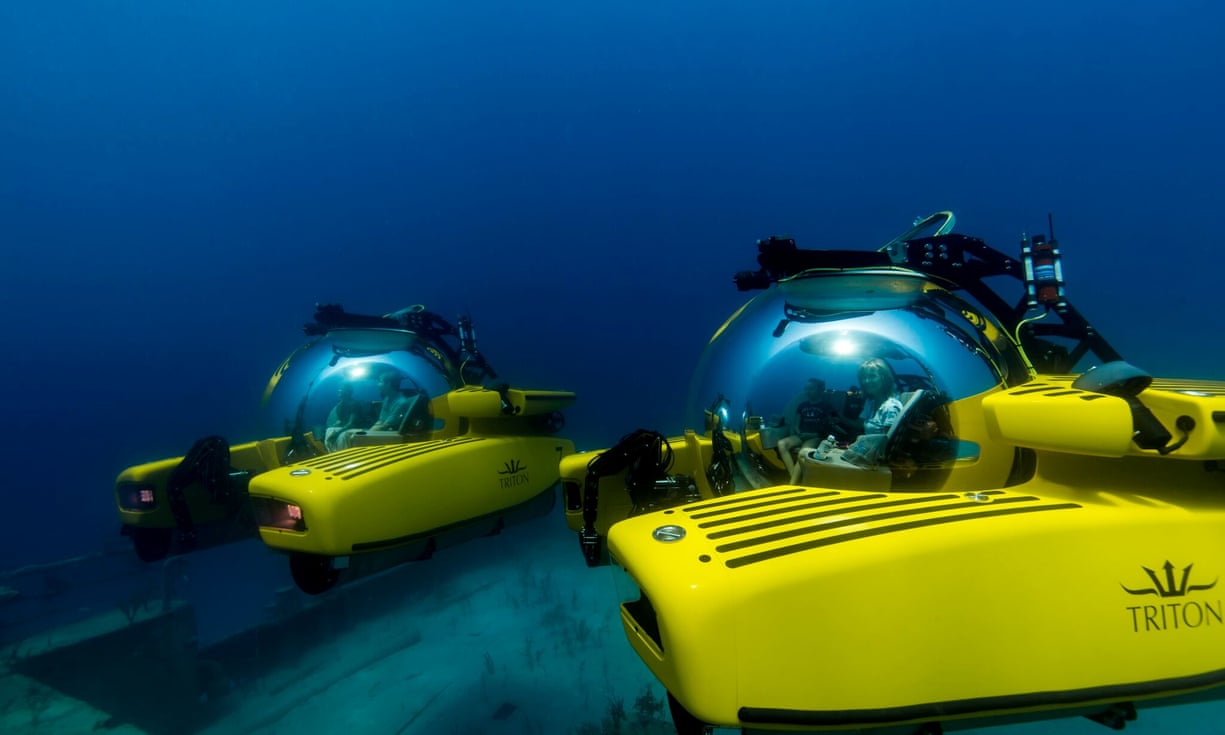
Doing a David Attenborough – Triton submersibles in deep waters off Lyford Cay, Bahamas. Photograph: Nick Verola
The global super-rich last year bought about 30 submersibles – with price tags of up to £30m – according to manufacturer Triton.
These private submarines are known as submersibles because they are not independently powered, instead relying on batteries that have to be recharged by a support vessel.
Louise Harrison, Triton’s European sales director, said in recent months the BBC’s Blue Planet series, narrated by Sir David Attenborough, had led to a “huge spike” in demand from wealthy buyers wanting to explore the deep and get up close to coral reefs, stingrays and whales.
There is a growing number of super-rich, she said, who want more than to merely luxuriate in their good fortune.
“The super-rich aren’t happy to sit on the back of their yachts with a G&T anymore.
The modern ones and the young ones want to go to Antarctica and the Galápagos Islands,” she said.
“They want to see what’s beneath the surface as well as what’s on top.
They have seen Blue Planet, and they want to get down there and see it for themselves.”
Harrison told hundreds of delegates attending the Superyacht Investor conference in London this week that submersible manufacturers had their best year in 2017, as there has been “definitive change in direction among owners to use their superyachts for new experiences”.
“The industry sold 25-30 submersibles last year,” she said.
“It may not sound like a lot but they are priced at a minimum of £1m and up to £30m.
It is a lot of money.”
The Chelsea Football Club owner Roman Abramovich, Virgin’s Sir Richard Branson, the Microsoft co-founder Paul Allen and the US hedge fund manger Ray Dalio are among billionaires who have already splashed out on underwater vessels.
Indeed, one may not be enough: Dalio said he was so “wild about ocean exploration” that he bought two submersibles, which were used in the filming of the second series of Blue Planet.
“The underwater world is much larger than the above-water world, has more unidentified species than the above-water world, is essential to our wellbeing, is incredibly interesting and valuable, and is mostly unexplored,” said Dalio, the world’s 90th richest person with a $14.6bn (£10.3bn) fortune.
“For those reasons, and for the thrill of it, I am wild about ocean exploration.
I explore the ocean personally while tagging along with great ocean scientists and explorers, and I financially support ocean exploration that goes on way beyond me – including sharing these thrills with the public through various media outlets and museum exhibits.”
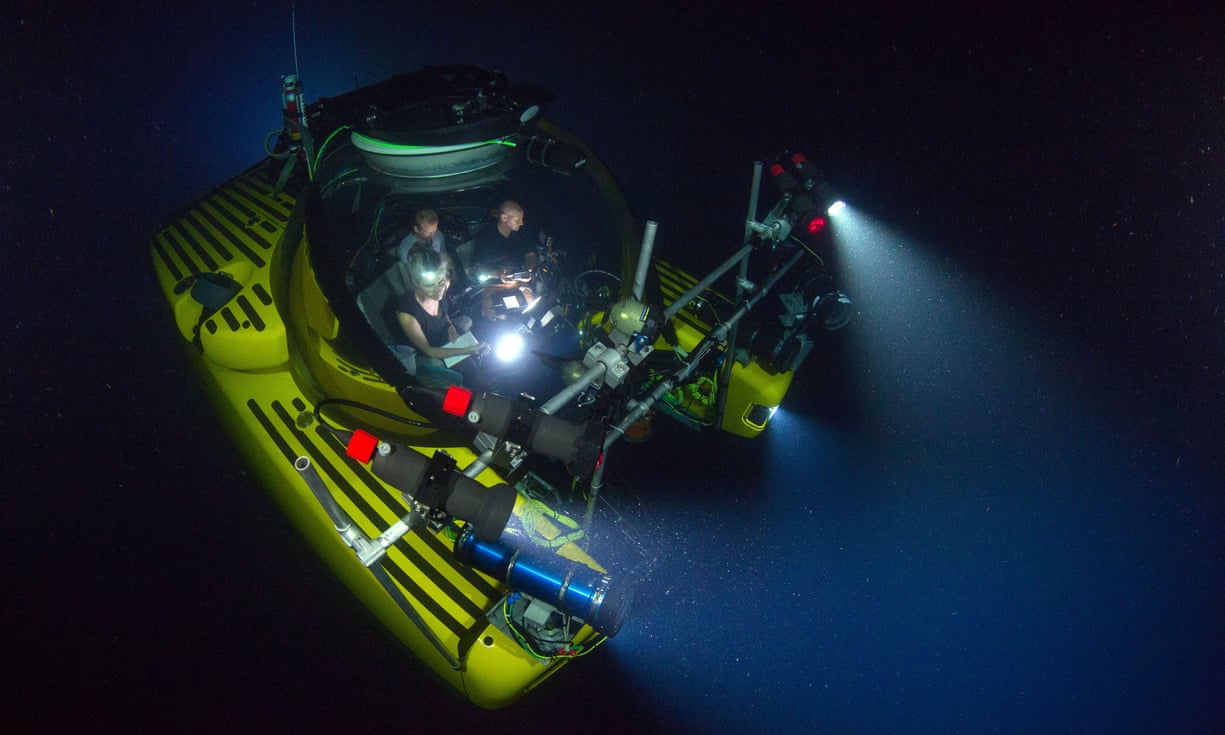
The submersible ‘Nadir’ used by Blue Planet II team to film the Deep episode.
It was one of many subs used to film the series.
Photograph: Luis Lamar
The Nadir is a Triton 3300/3 model capable of diving to a depth of 1,000 metres with a pilot and two passengers on board and sells for about $3m depending on fixtures and fittings.
“Yes, it’s a lot of money,” Harrison said.
“But do you want to go diving in a cheap submersible?”
Harrison said the growth in submersibles had been driven by a rapid improvement in acrylic technology, which means they can be fitted with large clear bubble domes, giving a 360-degree views of the ocean.
“When you’re underwater the acrylic sort of disappears and you feel like you are actually in the ocean.
It’s a bit dreamlike when you’re down there,” she said.
“The acrylic is the expensive bit, as the technology has only recently got so advanced that you can go that deep.
It is very, very expensive stuff – you don’t want to scratch it.”
Harrison said most customers say they are interested in buying submersibles for exploration, but some have also inquired about using them as “panic rooms or escape vessels”.
M/Y Legend has recently completed a submarine expedition in Antarctica, during which the C-Explorer 3 private submarine was extensivley used to explore the deep waters of the South Pole.
Triton’s biggest competitor, Holland’s U-Boat Worx, has designed an ultra-lightweight submersible model specifically for superyachts.
Its Super Yacht Sub Three is piloted from the rear so the passengers can get the best view of the ocean from the front of the bubble dome.
The company said: “This submarine is aimed at the yacht market ...
[it] delivers both performance and luxury.”
Luxury carmaker Aston Martin has joined forces with Triton Submarines to make a stylish submersible.
Triton, which is based in Florida, has partnered with British luxury car group Aston Martin to work on a new $4m three-man submersible codenamed Project Neptune.
The subs, which are expected to hit the market later this year, will dive to 1,650ft and have a top speed of 3.5 miles an hour.
Marek Reichman, Aston Martin’s chief creative officer, said the company had decided to expand into submersibles following interest expressed by its richest customers.
“Those superyacht people, what they want to experience is changing,” he said.
“It’s no longer about just having a launch or having your tender.
It’s about having some other way of entertaining your guests.” Links :
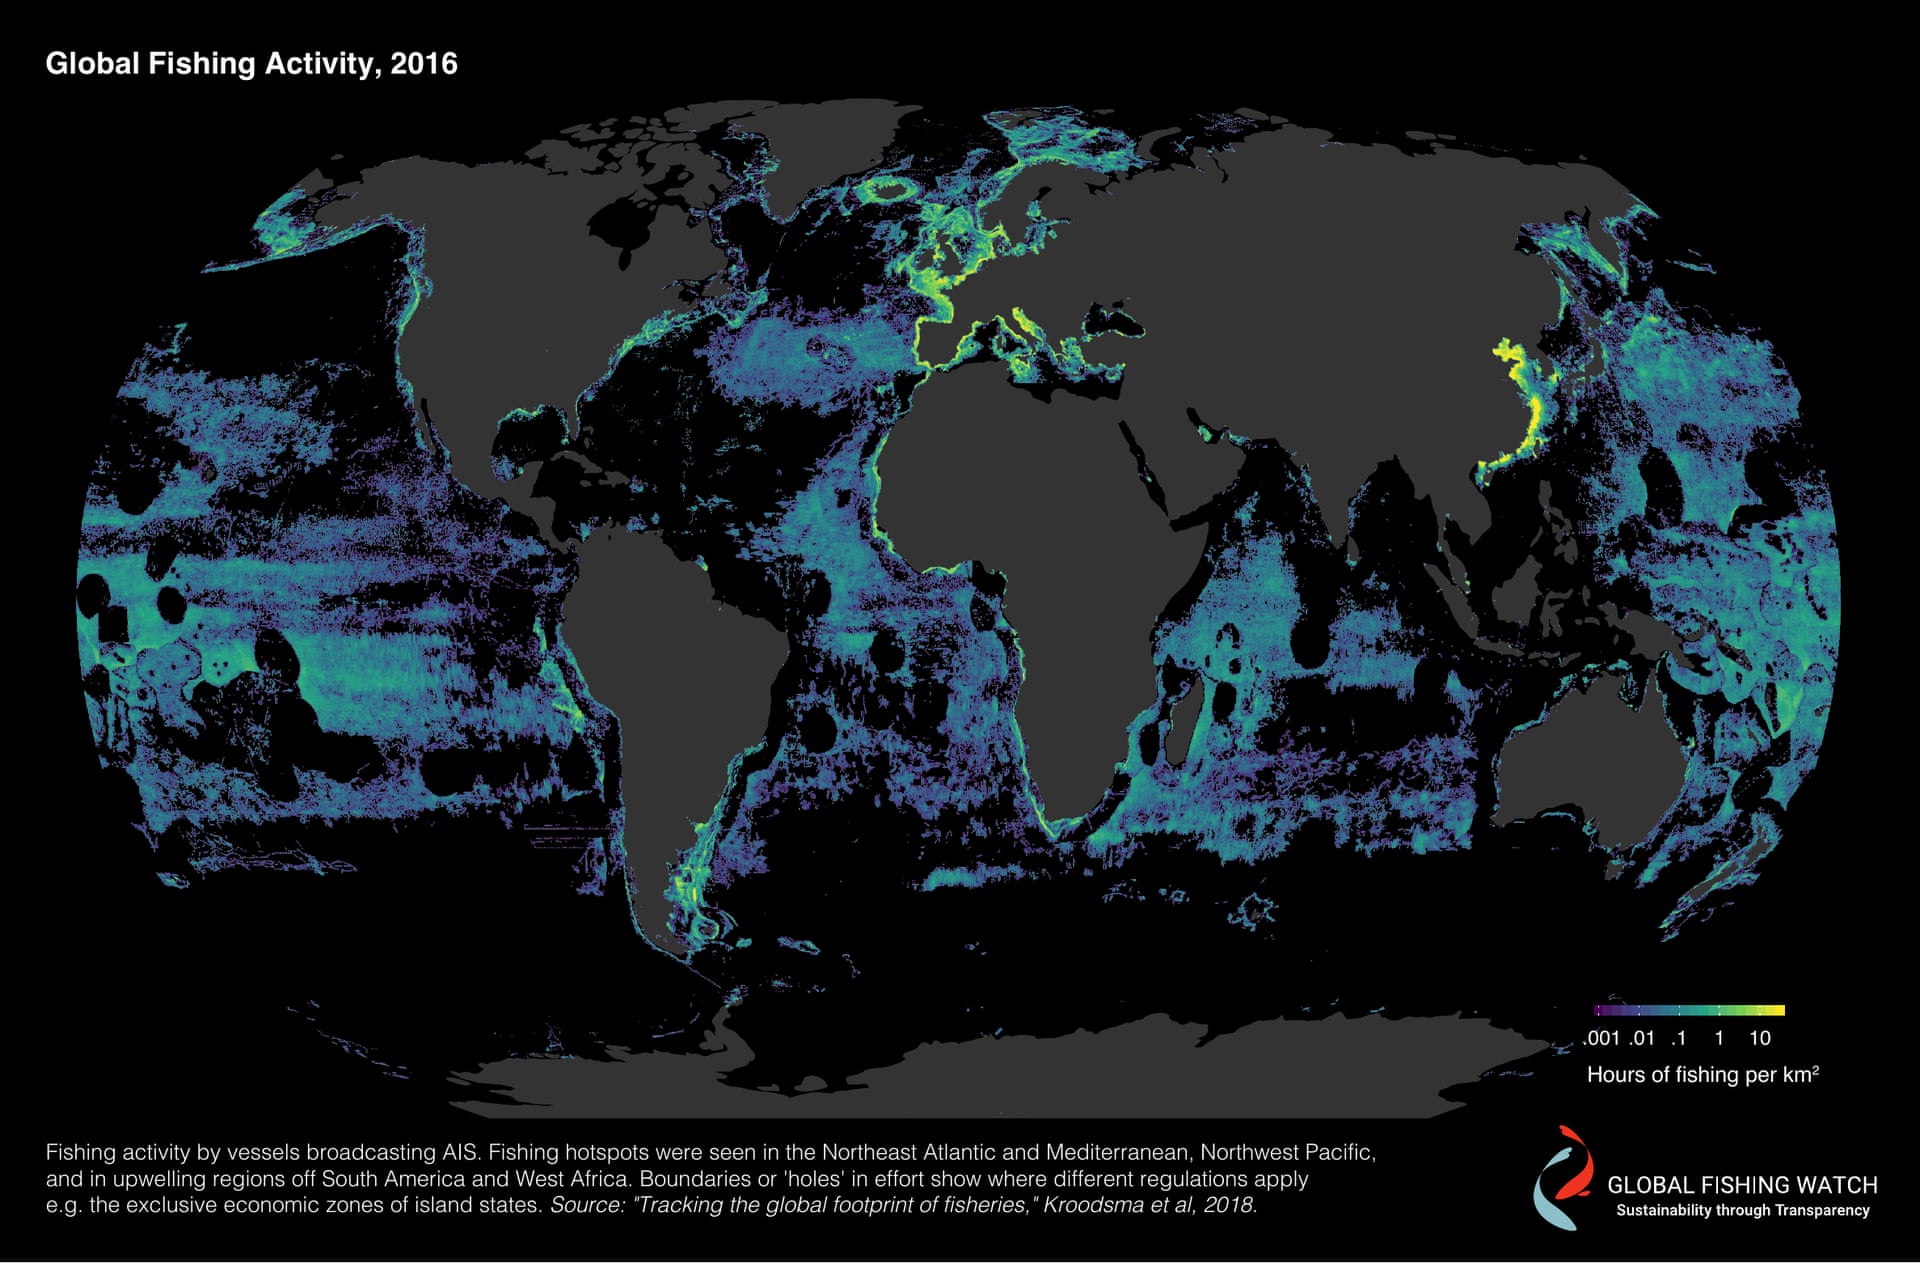
Humans are now fishing at least 55 percent of the world’s oceans — an area four times larger than the area occupied by humanity’s onshore agriculture.
That startling statistic is among the findings of a unique, high-tech collaboration that is providing a massive amount of new data about global fishing operations.
The results, published Thursday in the journal Science, offer a powerful glimpse of the problem of overfishing on the hard-to-regulate high seas. According to the Food and Agriculture Organization of the United Nations, 31.4 percent of global fish stocks were overfished or fished unsustainably, as of 2013, while another 58.1 percent were “fully fished.”
Thursday’s findings relied on data from Global Fishing Watch, a collaboration encompassing Oceana, SkyTruth and Google.
Researchers compiled billions of data points from tracking systems that the International Maritime Organization requires for about 70,000 fishing vessels.
The result was a picture of fishing that the study, led by David Kroodsma of Global Fishing Watch, says “has never been directly quantified.”
Because of data limitations, the percentage of the oceans fished could be as high as 73 percent, the study said.
The Dynamics of the Global Fiching Fleet - interactive-
“Fishing is happening almost everywhere and all the time,” said Jackie Savitz, chief policy officer for the advocacy group Oceana.
“I think people don’t really have a sense of how heavily fished our oceans are and how intensely they are fished.”
She said the intensity of global fishing documented by Thursday’s study is far greater than researchers have been able to track in the past.
“That means we’re putting more pressure on fish populations,” Savitz said, noting that increased fishing also means more inadvertent catching of other species, such as sea turtles.
“That means there’s more pressure on our oceans than we thought.”
There was particularly intense fishing off the southeastern coast of South America, the eastern coast of China, western Africa, and all around Europe and the Mediterranean, the research found.
The North Atlantic, far northeastern Pacific, Indian Ocean and Southern Ocean were far more devoid of fishing.
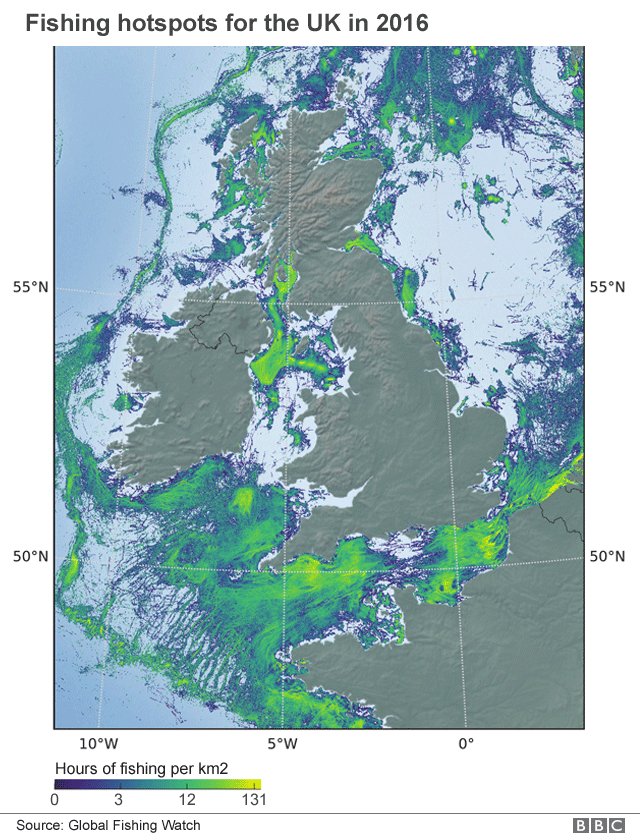
Here’s one image of the fishing pattern off the coasts of the northeastern United States/Canada and UK/France :
While Thursday’s study itself doesn’t delve into what areas are being overfished around the world, Savitz said experts have long documented overfishing in many places.
But she said the latest data helps illustrate that “the tragedy of the commons is very much at place in the oceans,” and that it underscores the need for a more thoughtful global approach to regulating fisheries.
“What we need to do is, both within countries and internationally, put in place sustainable fishery management policies,” Savitz said.
“Unless we get policies in place to protect fishery sustainability, what we’re essentially doing is undermining our food security.”
The study found that ships from just five nations accounted for more than 85 percent of global fishing — Spain, Taiwan, Japan, South Korea and China.
China’s fishing footprint was by far the largest, however, based on data for the year 2016.
(The study used data from 2012 through 2016.)
This graph shows the number of fishing hours by flag state in 2016.
(Global Fishing Watch)
One leading fisheries scientist said that while the study’s methodology is novel, overall it reaffirms an existing picture of how much the oceans are being fished.
“The results are remarkably consistent with the catch data that have been traditionally employed to measure fishing effort,” said Jeremy Jackson, a marine sciences expert at the Scripps Institution of Oceanography, by email.
“Ditto the fact that China, Spain, Taiwan, Japan and South Korea take 85 percent of it all on the high seas. Still, it’s good to see the strong confirmation, and of course it’s unsustainable without massive restrictions in effort.”
Daniel Pauly, a prominent expert on global fisheries and a professor at the University of British Columbia, added that Thursday’s study “adds a new dimension to the scientists’ and fisheries manager’s tool kit, a very effective one.”
“It can be seen as one of the first instances of high-tech being turned against illegal fishing (until now, it was the pirates who used it),” he wrote in an email from Hong Kong.
“What is new is that the [Global Fishing Watch] enables civil society to use satellites to monitor the activity of fishing vessels, and thus to fight against illegal fishing and to increase transparency.”
Global Fishing Watch uses data broadcast from ships at sea to map more than 60,000 industrial-sized fishing vessels.
In 2017, nano-satellite data from Spire increased resolution by nearly doubling the data in the platform.
In addition, Pauly said, the data help make a case that all fishing vessels — not only the large commercial ones operating far offshore — should be satellite-monitored.
“The next thing is thus to pressure the International Maritime Organization to close the loophole they have for smaller, coastal fishing vessels, which do not need to have [electronic tracking systems].”
The technology used by Global Fishing Watch to conduct the study relies on public broadcast data from the Automatic Identification System (AIS), which uses satellite and land-based receivers to track the movement of ships over time.
Not all fishing vessels willingly broadcast their location, of course — particularly those intent on breaking the law — and vessels can switch off their trackers, potentially hindering the usefulness of the technology.
But the United States and other countries already require vessels of a certain size to use the locator system, partly as a safety measure to avoid collisions at sea.
Global Fishing Watch allows users to access that information to track specific vessels over time.
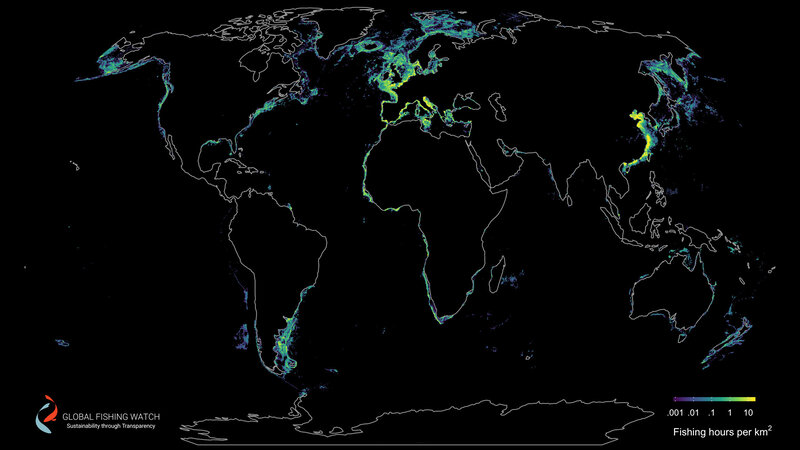
This map shows fishing by trawlers, which drag fishing nets behind them.
They dominate fishing in coastal areas, such as fisheries near Europe and China
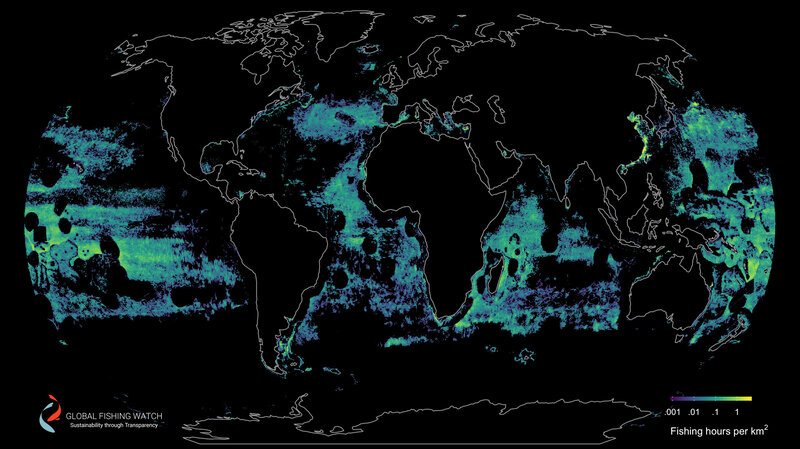
This map shows activity of fishing vessels that use drifting longlines.
They roamed the high seas, especially in tropical latitudes
The new satellite technologies are one part of a broader, ongoing international push to reduce overfishing in the oceans and cut back on illegal fishing.
One 2014 study found that between 20 and 32 percent of fish imported to the United States were caught illegally.
“The problem is just gigantic,” then-Secretary of State John F. Kerry told The Washington Post in an interview in 2016.
“A third of the world’s fisheries are overfished, and the ones that aren’t overfished are at max, with more and more demand. …
It’s an ecosystem that requires sustainability to survive, and we’re not treating it in a sustainable fashion.”
Despite the huge scale of the effort, the fishing captured in the study represented only 1.2 percent of all the calories produced for humans to eat, the study found.
However, as the Food and Agriculture Organization notes, these are particularly beneficial calories, because fish provide amino acids, fats, vitamins and other key nutrients and help prevent cardiovascular illnesses.
Thursday’s study also shed light on the sheer scale of global fishing, noting that in 2016 alone, the ships that were tracked spent 40 million hours at sea and traveled 460 million kilometers — “equivalent to traveling to the Moon and back 600 times.”


:gifv():no_upscale()/cdn.vox-cdn.com/uploads/chorus_asset/file/10314755/GOES_satellites.gif)