
ECMWF model 9-km

ECMWF model EPS 14-km
As a meteorologist, I've seen my share of forecast models depicting extreme scenarios.
These models can go from forecasting heavy snow to forecasting nothing in as little as 12 hours.
How does this happen?
Before we get too far, let's describe a forecast model.
Simply put, a model is a set of complex mathematical equations solved by a computer to produce a forecast.
To begin the forecast process, data representing the current state of the atmosphere is ingested into the model.
Using this data, the equations that comprise the model produce a forecast at a set interval (this interval could be one hour, three hours, six hours, etc.) for multiple days.
The better the data going into the model, the better the resulting forecast may be.
Take a look at these maps.
They are two forecasts for Friday at 12pm CST.
The only difference is that the image on the left is from a model 12 hours before the image on the right.
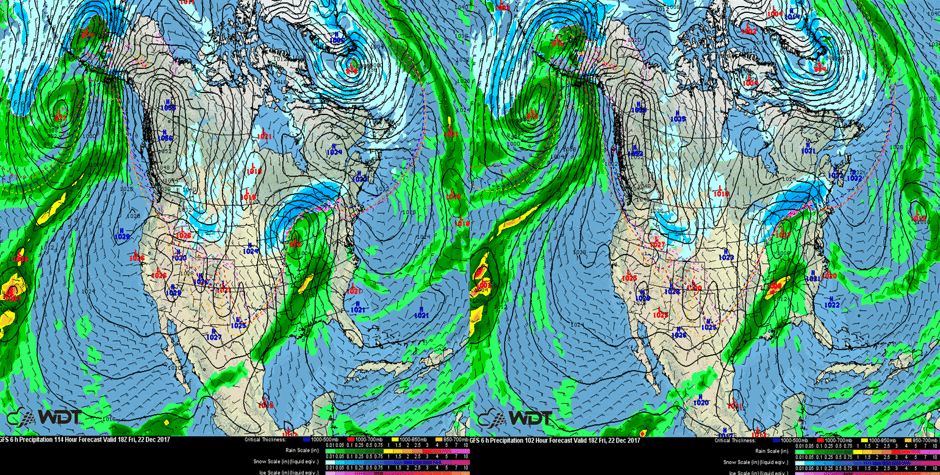
GFS Model Comparison Friday, December 22, 2017 12pm CST
with 22 km resolution grid
with 22 km resolution grid
You can see a few differences in the two images.
The earlier forecast has the snow associated with the area of low pressure in the Great Lakes extending further westward into Iowa and Minnesota.
Another difference is in the placement of this low.
While the differences are relatively small, they could have various implications (a major metro area getting snow versus not getting snow, for example).
There are a couple things that can impact the model forecast.
Current observations play a vital role in model forecasts; if there are errors in the observations (as a result of instrument malfunction, for instance), the model's forecast will be impacted.
In addition, when observations are scarce, such as over oceans or in mountainous areas, model forecasts will also be impacted.
In these areas, the lack of observations affects the forecast because the current state of the atmosphere is not fully represented.
In addition, errors in model forecasts tend to increase further into the future; small errors early in the forecast can increase with time.
As a result, forecasts at these later times may not make sense.
Beyond about 7 days, the accuracy of a forecast decreases significantly.
Here's is an illustration of how a model works and why forecasts at long ranges aren't reliable:
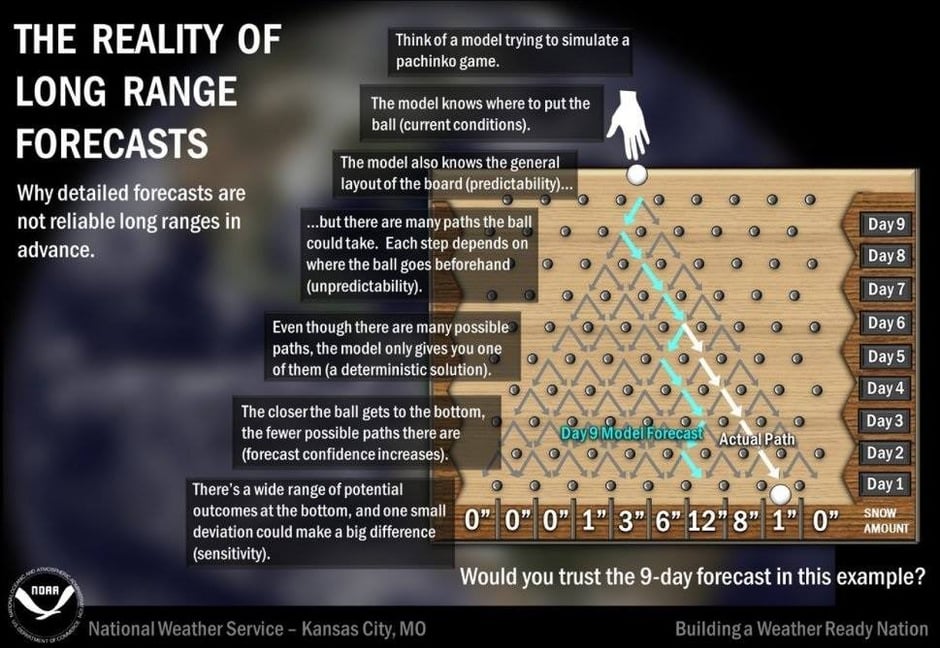
Forecast Model scenario
The images above were from a model run two days ago.
Now let's compare those two images with a look at the most recent run (at the time of this writing).
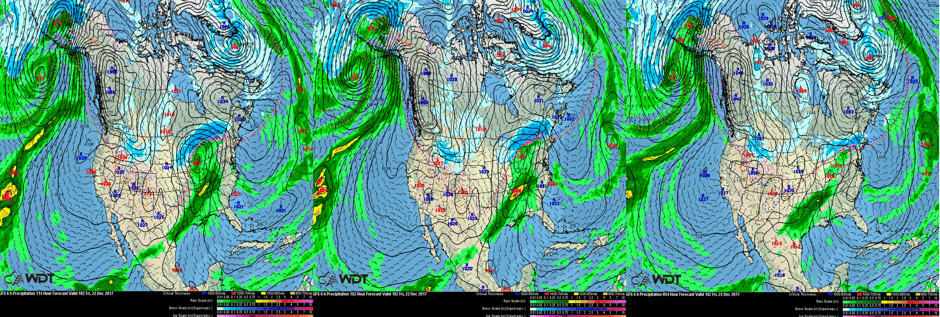
GFS Model Comparison for Friday, December 22, 2017 1pm CST
You can see differences in each image, with the latest model image on the far right, now showing only light snow for North Dakota into northwestern Minnesota.
In many cases, the model forecast typically begins to become more consistent within 48-72 hours from an event.
Looking at the national forecast for Friday, there is a potential for snow across the Northeast; accumulations of 3-6 inches with locally higher amounts in excess of 8 inches are currently forecast. In the graphics above, you notice all three images suggest the potential for rainfall across the Tennessee Valley.
This still appears to be a possibility with models suggesting rainfall amounts of 2-4 inches and some locally higher amounts.
In addition, there will be the potential for some flooding.
courtesy of Windy
While these model images can be fun to look at, especially when they indicate the potential for a significant event, the points outlined above should be kept in mind when looking at them.
Also, knowing your source is important to determine whether or not the information is trustworthy.
Links :
- GeoGarage blog : Comparing forecast models for Irma / With iPhones and computer models, do we still need weather / The weather master / NOAA WeatherView / ...
- Washington Post : Weather forecasting faces a new world of challenges ahead
- Phys : NOAA's GOES-16 ready to improve forecasts even more
- Massive : Tiny computers are transforming weather data collection
- Nature : Five priorities for weather and climate research
- NYTimes : How Global Warming Fueled Five Extreme Weather Events
- Geospatial World : Check out wind speed, cloud density, pollution, ozone layer, weather on this interactive map
No comments:
Post a Comment