Saturday, January 2, 2016

The longest night

Páll Pálsson has been a man of the sea for 36 years.
With a life of fishing, comes a life of little sleep. Research shows that nearly half of Icelandic fishermen suffer from sleep-related disorders such as chronic fatigue and apnea.

Friday, January 1, 2016

15 huge ocean conservation victories of 2015

Goodbye 2015. Welcome 2016.

From EcoWatch by

Overfishing, climate change, habitat destruction and pollution remain major threats to the world’s ocean.
But amidst all that there is some seriously good ocean conservation news worth celebrating.
So, to continue the tradition started last year with listing 14 Ocean Conservation Wins of 2014, here’s a rundown for 2015 that will hopefully fill you with #OceanOptimism.
These wins represent the diligent efforts of organizations and individuals too numerous to list, so let’s just start with a blanket shoutout to all of #TeamOcean for a great year.

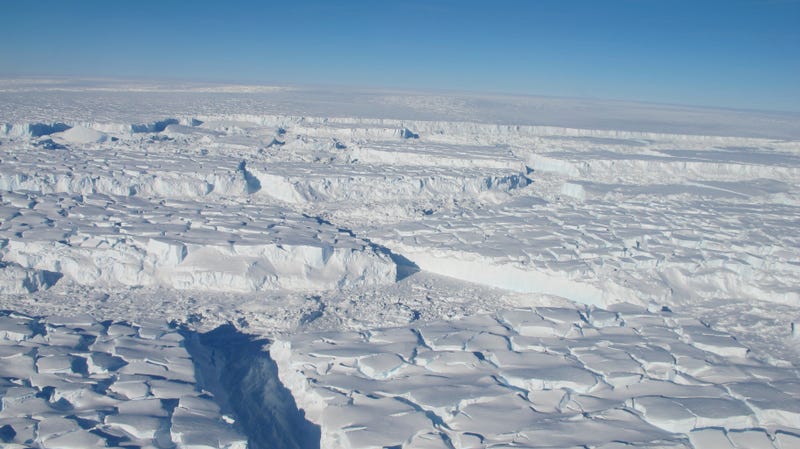
1. More than 2 million square kilometers of ocean was protected in big new marine reserves. Marine reserves are areas completely closed to fishing, and 2015 saw more ocean protected in a single year than ever before.
Chile created Desventuradas Marine Park (297,000 square kilometers) and Easter Island Marine Park (631,000 square kilometers).
New Zealand created Kermadec Ocean Sanctuary (620,000 square kilometers), Palau created Palau National Marine Sanctuary (500,000 square kilometers), the UK announced the Pitcairn Island Reserve (833,000 square kilometers), and protected areas are in the works for Patagonia.
However, there is a broad consensus that 30 percent of the ocean should be fully protected in reserves, and these new designations only get us up to 1 percent—but we’ll take it!

2. New technology is being developed to combat illegal fishing.
Designating all these new reserves means little without enforcement, and we can’t enforce unless we know what’s happening out on the water.
One big tech effort launched this year is Global Fishing Watch, a partnership between Skytruth, Google and Oceana to track fishing vessels and identify illegal fishing.
Another similar program is the Pew Charitable Trust’s Virtual Watch Room.
These technologies are in prototype phase and need significant improvement before they live up to expectations, but it’s a promising and exciting development.

3. Illegal fishing boats are being chased down and caught!
Sea Shepherd chased a pirate fishing boat on Interpol’s most wanted list for 10,000 miles, until the boat sank (potentially on purpose to drown the evidence of illegal fishing).
Another boat was chased for four days, caught, and fined $2 million for illegally fishing in the Phoenix Islands Protected Area.
The Black Fish and Environmental Justice Foundation have also been stepping up to make sure enforcement happens, but hopefully we can soon rely on law enforcement organizations, not environmental groups, to do this work.

4. Ocean conservation is one of the UN’s new sustainable development goals.
These goals set the UN’s agenda for the next 15 years, and it wasn’t clear the ocean would make the cut, but (voila!) Goal 14 is to “Conserve and sustainably use the oceans, seas and marine resources.”
Specific targets include, by 2020, conserving 10 percent of the ocean (but see #1 above for how far we have to go and whether 10 percent is even enough), halting overfishing and illegal fishing, and ending the subsidies that encourage them.
Addressing marine pollution and ocean acidification, and supporting small island states and small-scale artisanal fisheries are also priorities.

5. The Port State Measures Agreement is close to being ratified.
Another one from the UN, this is an agreement aiming to “to prevent, deter and eliminate illegal, unreported and unregulated (IUU) fishing through the implementation of robust port State measures.”
In other words, boats have to come into port eventually, so it’s important to have international cooperation in place to prosecute the bad guys when they come ashore.
IUU fishing is a major issue, representing ~$20 billion annually, and this measure will greatly increase enforcement capacity.
The agreement will enter into force after 25 countries ratify it—nine more ratifications to go, all expected in 2016.

6. The ocean is getting some good ink and screen time.
Racing Extinction premiered in theaters, bringing the issues of trade in endangered species, overfishing and ocean acidification to the big screen.
The Discovery Channel promised to stop with all the fear-mongering and straight up fake documentaries during Shark Week.
Richard Branson’s philanthropy launched Ocean Unite, to pull together and support the ocean conservation community on communications. And see #6 below.

7. Sustainable fishing became understood as a human rights issue.
Reporter Ian Urbina produced a slew of impressive investigative articles exposing the widespread human trafficking, slave labor and other horrors associated with major fisheries.
Upworthy produced a series of pieces to get this info to a broader audience.
Greenpeace has been fighting for fishers’ rights, teaming up with five of the largest labor unions.
The “Statement of Solidarity With Greenpeace Campaign to Reform the Tuna Industry” begins: “We know that environmental and social justice issues are absolutely intertwined and increasingly solutions that protect workers are the same solutions that safeguard the environment and natural resources.”
Hear, hear! And if you eat shrimp, unless you’re paying like $20 a pound, it’s totally unsustainable and slaves probably peeled it for you, so please find something else to dip in cocktail sauce.

8. Small island states are leading the way and getting support on ocean management.
Not only did small island states come together as a powerful voice at COP 21 in Paris, this year also saw the launch of Blue Guardians at the Clinton Global Initiative.
This new partnership that includes a broad collaboration of organizations (SIDS DOCK, Digital Globe, The Nature Conservancy, World Bank, Clinton Climate Initiative, Waitt Institute and others), and is focused on simultaneously protecting oceans and supporting coastal economies in the context of a changing climate.

9. A nonpartisan coalition is bringing ocean issues into the 2016 U.S. elections.
The Sea Party Coalition was launched by Blue Frontier, with tea party and liberal Congressmen, environmental NGOs, an evangelical minister, climate activists, ocean scientists and philanthropists participating.
The hope is to use the crosscutting sentiments for ocean conservation and against offshore drilling to get some traction for ocean issues in the 2016 elections.

 NASA releases new high-resolution image :
just  an unbelievable new image of the Earth rising over the Moon

10. Anonymous is hacking for ocean conservation.
The hacking collective claims credit for shutting down government websites of Japan and Iceland in retribution for their whaling.
Both countries continue to kill whales via a loophole in the International Whaling Commission agreement that allows whaling for “scientific research.”

11. Oil companies may be giving up on drilling in the Arctic.
 Greenpeace activists suspended themselves from a Portland bridge for two days attempting to block a Royal Dutch Shell icebreaker from heading to the Arctic.
This year also saw the rise of “kayaktivists” forming barriers to oil drilling equipment leaving port in Portland and Seattle.
Shell has at least temporarily ceased oil exploration in Alaska, and, though the fight isn’t over, the Obama administration has put a two-year ban on drilling there.
Greenpeace has shared the inside story of the #ShellNo protests in “People vs. Shell.”

12. Ocean zoning continues to gain traction as a key policy approach.
The Waitt Institute’s zoning-focused Blue Halo Initiative has been scaled up from the pilot project in Barbuda to launch two new partnerships, with the governments of Montserrat and Curaçao.
Perhaps more importantly, at least a dozen other island nations are interested in developing similar comprehensive, science-based, community-driven sustainable ocean management plans for their waters.

13. Plastic microbeads are getting banned.
New research shows that there are at least 15 trillion pieces of plastic in the ocean, at least three times more than previously thought.
Plastic microbeads, the sneakiest tiny bits of plastic, are in all sorts of toiletries (like face scrubs and toothpaste).
They end up in the ocean in droves, then in creatures’ bellies and gills, and cause all sorts of problems.
The good news is the U.S. Senate and House of Representatives have passed bills that will ban the use of microbeads.
Fear not!—there are plenty of non-plastic, non-toxic ways to exfoliate.

14. An end to subsidies for unsustainable fishing is gaining steam.
Much of the world’s overfishing and illegal fishing is financed by government subsidies.
But now, in a WTO Ministerial Statement, 27 countries have committed to ending subsidies “that negatively affect overfished fish stocks” or that support IUU fishing. This is also a target of the UN’s new ocean goal (see #2 above).

15. The COP 21 climate agreement mentioned the ocean.
 Given that the ocean is the majority of the planet and a lynchpin of the climate system and carbon cycle, it’s a bit nutty that just getting the ocean mentioned was something we needed to fight for.
However, the ocean was not originally included in the agreement’s text, and it is due to strong collective presence of the ocean community at COP 21 that the ocean got mentions in the final document.
Yet, note this analysis of how the agreement is not nearly as lovely, equitable, and transformative as most reporting would have you believe, and that it’s certainly insufficient for saving coral reefs.

Other good oceany things happened this year too.
The U.S. and Cuba agreed to collaborate on management of marine protected areas.
XPrize launched a $7 million ocean exploration prize competition.
Adidas and Parley teamed up to launch 3-D printed shoes made of plastic ocean trash.
World leaders gathered at the Our Ocean conference, which is becoming a key annual diplomatic event.
Citizen science is on the rise.
And Atlantic salmon just spawned in Connecticut for the first time since the 1700s.
There are invariably other wins I’ve missed—please shout them out in the comments!


If this trend of ocean wins from last year and this year continues, we may well avoid the most dire predictions of ocean ecosystem collapse.
To maintain this positive inertia, we must keep coming together and collaborating, and draw others into the fold to ensure (as we say at the Waitt Institute) sustainable, profitable and enjoyable use of the ocean for this and future generations.
Hopefully 2016 will be the year of really coming to grips with how to use the ocean without using it up.
Happy new year!

Links :

Thursday, December 31, 2015

Seafloor features are revealed by the gravity field


From NASA

It has been said that we have more complete maps of the surface of Mars or the Moon than we do of Earth.
Close to 70 percent of our planet is covered by water, and that water refracts, absorbs, and reflects light so well that it can only penetrate a few tens to hundreds of meters.
To humans and most satellite eyes, the deep ocean is opaque

But there are ways to visualize what the planet looks like beneath that watery shroud.
Sonar-based (sounding) instruments mounted on ships can distinguish the shape (bathymetry) of the seafloor.
But such maps can only be made for places where ships and sonar pass frequently.
The majority of such measurements have been made along the major shipping routes of the world, interspersed with results from scientific expeditions over the past two centuries.
About 5 to 15 percent of the global ocean floor has been mapped in this way, depending on how you define “mapped.”

There is another way to see the depths of the ocean: by measuring the shape and gravity field of Earth, a discipline known as geodesy.
David Sandwell of the Scripps Institution of Oceanography and Walter Smith of the National Oceanic and Atmospheric Administration have spent much of the past 25 years negotiating with military agencies and satellite operators to allow them acquire or gain access to measurements of the Earth’s gravity field and sea surface heights.
The result of their collaborative efforts is a global data set that tells where the ridges and valleys are by showing where the planet’s gravity field varies.
The map above shows a global view of gravity anomalies, as measured and assembled by Sandwell, Smith, and colleagues.
Shades of orange and red represent areas where seafloor gravity is stronger (in milligals) than the global average, a phenomenon that mostly coincides with the location of underwater ridges, seamounts, and the edges of Earth’s tectonic plates.
Shades of blue represent areas of lower gravity, corresponding largely with the deepest troughs in the ocean.
The second map shows a tighter view of that data along the Mid-Atlantic Ridge between Africa and South America.


The maps were created through computer analysis and modeling of new satellite altimetry data from the European Space Agency’s CryoSat-2 and from the NASA-CNES Jason-1, as well as older data from missions flown in the 1980s and 90s.
CryoSat-2 was designed to collect data over Earth’s polar regions, but it also collected measurements over the oceans.
Jason-1 was specifically designed to measure the height of the oceans, but it had to be adjusted to a slightly different orbit in order to acquire the data needed to see gravity anomalies.
But how does the height of the sea surface (which is what the altimeters measured) tell us something about gravity and the seafloor?
Mountains and other seafloor features have a lot of mass, so they exert a gravitational pull on the water above and around them; essentially, seamounts pull more water toward their center of mass. This causes water to pile up in small but measurable bumps on the sea surface.
(If you are wondering why a greater mass would not pull the water down, it is because water is incompressible; that is, it will not shrink into a smaller volume.)
The new measurements of these tiny bumps on the sea surface were compared and combined with previous gravity measurements to make a map that is two-to four times more detailed than before. Through their work, Sandwell, Smith, and the team have charted thousands of previously uncharted mountains and abyssal hills.
The new map gives an accurate picture of seafloor topography at a scale of 5 kilometers per pixel.


From these seafloor maps, scientists can further refine their understand of the evolution and motion of Earth’s tectonic plates and the continents they carry.
They can also improve estimates of the depth of the seafloor in various regions and target new sonar surveys to further refine the details, especially in areas where there is thick sediment.
This third map shows the gravity data as a cartographer would represent the seafloor, with darker blues representing deeper areas.

Links :

Wednesday, December 30, 2015

Why are sea levels dropping in places closest to the melting glaciers?

Global rebound rates as the world adjusts from the last ice age.

From io9 by Mika McKinnon

Our dynamic planet has an apparent paradox: the more ice melts from landlocked glaciers, the lower the sea level gets in nearby areas.
How does this happen?
Through the physics of isostatic rebound, when the surface of the planet acts as an elastic sheet dimpling and rebounding under changing loads.


Perito Moreno Glacier in Argentina is one of the few terrestrial glaciers advancing in modern times. Image credit: Frank Kehren

Rocks seem so very solid from our puny human perspective.
Things are rock hard, rock solid, and are reliable as the rock itself.
But from a geological perspective, rock is an elastic sheet that encompasses our planet in a thin, flexible membrane that responds to every disturbance.

Nowhere is this more evident than with isostatic rebound, a process of geological buoyancy by which the earth's crust, having sunk beneath the weight of glaciers from a preceding ice age, bounces up as ice sheets melt and the water runs back into the sea.
While this melting ice is filling the oceans, the land can rebound so quickly that it rises even faster than the climbing sea level.
The result is an apparent paradox: where continental glaciers are melting and exposing the land, the local sea levels are dropping.

The Thwaites ice shelf in Antartica as surveyed in October 2013 by Operation IceBridge. 
Image credit: James Yungel/NASA

During each ice age, massive glaciers crawl across the land.
These vast ice sheets contain an enormous quantity of water.
And water is very, very heavy.

The crust and mantle deform under the weight of ice sheets.
Image modified from NASA

During the last ice age 15,000 to 20,000 years ago, Canada and the United States were groaning under the weight of the Laurentide and Cordilleran ice sheets while Scandinavia struggled under the Fennoscandian ice sheet.
The Earth's lithosphere, the rigid crust and uppermost mantle, buckled under the weight of up to 3 kilometers of ice.
Like an iceberg floating in water with a vast root hidden under the waves, the crust sank into the mantle until hitting a buoyant balance between the weight of ice and rock over hot mantle.
Kept under load for thousands of years, the lithosphere flowed and deformed to reach equilibrium under the new normal.

When the world shook off the ice age, the ice sheets melted quickly.
The land was bare in a geologic heartbeat, lifting the weight far, far faster than it built up millennia before.
The elastic crust rebounded nearly instantaneously, bouncing back like a balloon's surface freed from an aggressive squeeze.
But the more viscous mantle was slower to reach equilibrium in the new isostatic regime, driving slow uplift as the mantle flowed under the dented land.
The rebound is ongoing today, with the land recovering at centimetres per year.
With the rebound rates akin to the speed at which fingernails grow, it will take another 10,000 years before the land recovers from the last ice age.

The same story is happening everywhere that was covered in ice: the lithosphere buckled under the massive weight of ice sheets, and has been slowly recovering in the millennia since they were exposed.
From the Antarctic still shedding weight to Canada's Hudson Bay racing upwards at nearly 2 centimeters per year, the surface of our planet is literally reshaping beneath our feet.
For people in the far north and south of our planet, every time they trim their nails they can reflect on how much higher their home has bounced since the last manicure.

As the lithosphere rebounds, it carries the entire landscape with it.
Sea cliffs and rivers are stranded far above their formation location, and strandlines of past beaches are laid out in beautiful, delicate features tracing sea levels long gone.
Even the tilt of the land changes: drainage patterns struggling to adjust to keep water flowing downhill.


A stranded river cuts a new waterfall as the land rebounds above the sea in Alaska
Image credit: Jim & Laura Massie

The arrival and release of weight impacts the stress of the entire region, potentially triggering earthquakes and volcanoes.
Before fracking and injection wells made a mess of the continental interior, the biggest causes of intraplate earthquakes far from plate tectonic boundaries were attributed to the shifting stresses of isostatic rebound.
These impacts can be far-reaching in both space and time: despite being ice-free, the infamous 1811 New Madrid earthquake in the American south may have been induced by intraplate stresses induced from the last ice age.

The same thing is happening for volcanoes.
A key trigger of eruptions is changing in the subsurface pressure and stress adjustments in the magma chamber.
As the lithosphere flexes and recovers, this redistribution can be enough to fuel a surge in volcanic activity.
Right now, the released pressure in Iceland could be fuelling a surge in volcanism, magma chambers long kept confined expanding and pushing out into surface eruptions from the flight-disrupting Eyjafjallajökull to the ongoing slow, steady trickle of Bárðarbunga.

The Bárðarbunga eruption in Iceland is spilling across the country's terrestrial glaciers.
Image credit: NASA

But most fascinatingly of all, isostatic rebound is the secret process behind how locations can have sea levels changing at odds with the rest of the planet.
While we all know about global sea levels rising and falling, geologists also track local sea levels, the relative change in sea level at particular locations.

During an ice age, water once free to flood the oceans is tied up in continental ice sheets.
This drops global sea levels, exposing seafloor as the new coastline.
Yet the land with these new ice sheets is under load, dropping down relative to its former height.
Relatively speaking, despite the global sea levels falling, the local sea level can actually rise.

Right now, we're distinctly not in an ice age.
The land-bound glaciers are melting, and sea levels are rising from both the influx of released water and thermal expansion.
And yet, for the places suddenly relieved of their frozen load, the land itself is rebounding higher above the waves, maybe even faster than the grasping clutch of the sea.
Determining just how quickly each process is occurring is a jumbled mess of scrambling to monitor rapidly changing data to calibrate our models, but for now, parts of Iceland, Greenland, and Canada are climbing faster than their sea levels.
From the perspective of beach-side homes, the relative sea level is staying stagnant or even dropping while the rest of the world contends with higher storm surges and floods.

Strandlines mark the relative sea level change from isostatic rebound in Bathurst Inlet, Nunavut.
Image credit: Mike Beauregard

Isostatic rebound is just one example of how the surface of our planet is a dynamic, changeable place where the materials behave far differently in aggregate than we perceive them from our daily perspective.

Links :

Tuesday, December 29, 2015

GeoGarage accessible on iPhone/iPad with Weather 4D 2.0


Links :

This Old Map: Benjamin Franklin's Gulf Stream, 1786

The  map 'Chart of the Gulf Stream' in an occasional series
depicts a turning point in transatlantic navigation.
Franklin, always an advocate of science and invention,
published this early map of the Gulf Stream in the Atlantic Ocean in 1786.
see Raremaps

From TheCityLab by Laura Bliss

Thanks to the jet stream, westbound flights across the Atlantic take longer than eastbound ones.
In the centuries before air travel, sailors dealt with a related time-sucking natural phenomenon, until a famous American intervened with “A Chart of the Gulf Stream.”

Who made this map?

Benjamin Franklin and his cousin, Timothy Folger, are credited with naming and mapping the Gulf Stream for the first time—the warm, strong ocean current that pushes northeast from the Gulf of Mexico, up the Atlantic coast, towards Europe.
Though there were many editions, the map pictured above was printed by the American Philosophical Society in 1786, and now belongs to the Library of Congress.

 Here is another chart from the pen of Benjamin Franklin.
It shows that he realized that the Gulf Stream is actually a loop.
Here is another chart from the pen of Benjamin Franklin. It shows that he realized that the Gulf Stream is actually a loop. - See more at: http://every-day-is-special.blogspot.fr/2011/05/may-2-2011-you-go-gulf-stream.html#sthash.cjsbbSuF.dpuf

What problem did it solve?

In 1768, Franklin was in London, working as deputy postmaster general for the American colonies.
A visit by Folger, who captained a merchant ship, prompted Franklin to inquire about something peeving him.
Why did it take British mail packet ships so much longer to reach America than it took regular merchant vessels?
It struck Folger that the British mail captains must not know about the Gulf Stream, with which he had become well-acquainted in his earlier years as a Nantucket whaler.

Franklin later quoted his cousin’s explanation like this:
We are well acquainted with that stream, says he, because in our pursuit of whales, which keep near the sides of it, but are not to be met with in it, we run down along the sides, and frequently cross it to change our side: and in crossing it have sometimes met and spoke with those packets, who were in the middle of it, and stemming it. We have informed them that stemming a current, that was against them to the value of three miles an hour; and advised them to cross it and get out of it; but they were too wise to be counselled by simple American fishermen.
In other words, westbound British packet ships were losing precious time by sailing into and against the warm, strong current.
Folger sketched out the rough location for Franklin, who soon made prints, along with his cousin’s directions for how to avoid what he dubbed the “Gulph Stream.”
Who used it?

Franklin passed out copies to those hapless British packet mariners, but again, they didn’t think much of the American’s sailing pointers, and apparently ignored them.
With the start of the American Revolution a few years later, Franklin’s allegiances shifted.
He stopped distributing the Gulf Stream map to the British, and instead gave copies to the French, who used it to ship weapons and supplies to their American allies.
After that, knowledge of the stream became “hugely important for transatlantic travel,” says Alex Clausen, a maps specialist at Swann Auction Galleries, where a copy of the map recently sold for about $8,000.

 Computer Model of the Gulf Stream Surface Temperature, 2005.
The Gulf Stream is not really a “river in the ocean” as Franklin thought.
But the waters that make up the Gulf Stream are “channeled” into a certain direction and speed by many factors-including prevailing winds, the rotation of the planet, and colder currents around and below the Gulf Stream.

Is it accurate?

Compare Franklin and Folger’s 18th-century chart to modern computer-generated models of the Gulf Stream, and they match up remarkably well.
While Franklin himself made observations of the stream on ocean voyages—“I find that it is always warmer than the sea on each side of it, and that it does not sparkle in the night”—the accuracy of the chart is really due to Folger and his inherited whaling knowledge.
Also, Spanish mariners had known about the Gulf Stream since the 1500s.
But Franklin was the one with the good instincts to map it, and that, combined with his general eminence, has landed him with most of the credit.

In 1854, Coast Survey showed the positions and comparisons of observations of temperature in the Gulf Stream 1845 through 1848, 1853 and 1854
(courtesy of NOAA historical)

More than two centuries after this chart was first published, Grumman Aerospace Corporation launched a landmark undersea expedition off the coast of Florida to study the depths of the Gulf Stream.
The submersible’s name? What else: the Ben Franklin.

Links :


Monday, December 28, 2015

Ocean solutions


From Le Monde Diplomatique by Torsten Thiele

In June 2015 the UN General Assembly approved a resolution to negotiate a new legally binding instrument to implement the UN Convention on the Law of the Sea.
We may hope this will pave the way for the creation of areas where marine biodiversity is rigorously protected by law, as well as more equitable access to the high seas and fairer sharing of their benefits, within a framework of shared governance.

This is just the start of what promises to be a lengthy process, but it represents a major shift in the international community’s attitude to the protection of the oceans.
It also signals the start of an era of real hope for a swift and effective end to the exploitation and degradation of the ocean that has characterized the last hundred years.
It is encouraging that private organizations are driving a vision for bigger ideas, new thinking and broader partnerships.

Private philanthropic initiatives can provide decisive support in the design and implementation of marine protected areas.
They offer a management framework that, by engaging local communities as well as scientists in the process should make it easier to overcome challenges and stay on course in the longer term.

Large, remote high seas ecosystems such as the Sargasso Sea are now recognised as key areas for protection, but by virtue of their size will require new forms of monitoring such as satellites, drones and unmanned marine vehicles.
These will deliver scientific research benefits as well as operational efficiencies.

Studies have shown the value of large no-take marine protected areas as carbon sinks (helping to prevent global warming) but also as breeding grounds for whales and dolphins.
The preservation of marine mammals is vital for the fishing and whale-watching sectors, and for global biodiversity.

It’s clear we need to think differently.
The ecological, scientific and legal arguments for ocean conservation are numerous and irrefutable, but they are not enough.
To be effective, they must be combined with new ideas, technologies and sources of finance suited to the task.

The creation of an “ocean bank for sustainability and development”, funded through a one-time equity investment by governments and private partners, could offer viable financing options for initiatives to promote the survival and regeneration of the oceans.

We also need to broaden our partnerships.
The Paris climate conference (COP 21) this month offers an opportunity to form alliances between professionals from different sectors united by their awareness of the importance of protecting marine biodiversity.
It’s high time we recognized that the oceans are not just a source of food and minerals for exploitation, but are also vital for the future of our planet and the survival of humanity.

Links :

Sunday, December 27, 2015