Saturday, August 3, 2019

Rolex Fastnet Race 2019

2019 marks the 48th edition of biennial Rolex Fastnet Race.
Organised by the Royal Ocean Racing Club since 1925 and partnered by Rolex since 2001, the 605nm race is a classic examination of strategy and skill.
Attracting a mix of passionate Corinthians and professionals, this is offshore racing at its very best, with complex weather patterns and testing tidal currents to be negotiated.
For Rolex, this type of sailing challenge lies at the heart of its enduring six-decade-long support for the sport.

On Saturday, 3 August an intrepid fleet of 400 yachts will set sail from Cowes, on the south coast of the United Kingdom, bound for the Fastnet Rock off southern Ireland and the return. leg to the finish in Plymouth.
photo : Carlo Borlenghi

"Sea Fever: For Those in Peril" - Fastnet Race Disaster, 1979 from Hidden Picture Productions
This is a short extract from the 60' programme "For Those in Peril" that Jonathan directed for BBC4. First transmitted as part of the BBC's "Sea Fever" season, the film tells the story of the evolution of coastal rescue in the UK from the start of the 20th century.

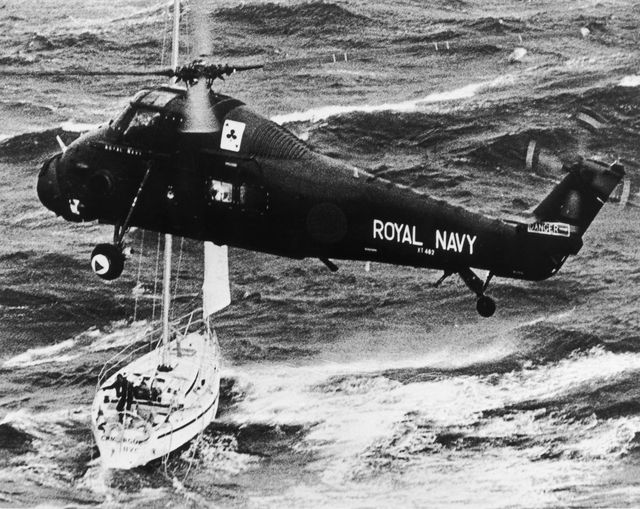
 Royal Navy Honors 40th Anniversary of the Fastnet Race Rescue :
This extract tells the story of the Fastnet race disaster of 1979 (so 40 years ago) that launched the biggest maritime rescue operation since Dunkirk.
A freakish storm turned the Celtic Sea into a terrifying washing machine that tossed the 303 entrants about and killed 15 sailors.
This documentary is a tribute to the Royal Navy rescue crews and has a focus on Nick Ward's experience on the Holland Half Tonner Grimalken, and which is recounted in his book "Left for Dead".
The documentary includes some footage from the start of the infamous race, and look out for a shot of the top boat of the Admiral's Cup that year (of which the Fastnet Race was the series finale), the Peterson 39 Eclipse, just to windward of the star performer from the 1977 series, Imp.
You can also see the Irish yacht Golden Apple of the Sun being towed into Plymouth after she had lost her rudder in the storm.
Her crew were airlifted off the boat and she was recovered by the Royal Navy 20 hours after the storm's height.

Links :

Friday, August 2, 2019

Greenland is melting away before our eyes

Temperatures in the 49th state are rising twice as fast as the rest of the world, causing water levels to rise and endangering places of natural beauty.

From RollingStone by Eric Holthaus

“I have my fingers crossed for it not being washed away”

Amid an ongoing heat wave, new data show the Greenland ice sheet is in the middle of its biggest melt season in recorded history.
It’s the latest worrying signal climate change is accelerating far beyond the worst fears of even climate scientists.

 The heatwave that smashed high temperature records in five European countries a week back is now over Greenland, accelerating the melting of the island's ice sheet and causing massive ice loss in the Arctic.

The record-setting heat wave that sweltered northern Europe last week has moved north over the critically vulnerable Greenland ice sheet, triggering temperatures this week that are as much as 25 to 30 degrees Fahrenheit warmer than normal.
Weather models indicate Tuesday’s temperature may have surpassed 75 degrees Fahrenheit in some regions of Greenland, and a weather balloon launched near the capital Nuuk measured all-time record warmth just above the surface.
That heat wave is still intensifying, and is expected to peak on Thursday with the biggest single-day melt ever recorded in Greenland.
On August 1 alone, more than 12 billion tons of water will permanently melt away from the ice sheet and find its way down to the ocean, irreversibly raising sea levels globally.

A tweet from the Danish Meteorological Institute, the official weather service of Greenland, said “almost all the ice sheet, including Summit” measurably melted on Tuesday.
According to a preliminary estimate, that melt covered 87 percent of the ice sheet’s surface, which would be the second-biggest melt day in Greenland’s recorded history.
Separate weather monitoring equipment at Summit Camp at the top of the 10,000-foot-thick Greenland ice sheet confirmed the temperature briefly reached the melting point.

 This river is in West Greenland, close to the capital Nuuk.

Localization with the GeoGarage platform (DGA nautical chart)

Downhill, meltwater was seen dramatically streaming off the edge of the ice sheet in massive waterfalls.
Climate scientist Irina Overeem, who placed a meltwater monitoring station in western Greenland eight years ago, recorded a dramatic video of a rushing torrent of water.
In a comment posted on Twitter, she said “I have my fingers crossed for it not being washed away.” In an email to Rolling Stone, Overeem described the nature of life in Greenland these days: After recording that video, she spotted a warning of the major glacial water runoff on the announcement board of the main supermarket in the capital city.
A similar glacial flood in 2012 was so intense it washed away bridge.

Flying over Greenland last week, impressive huge rivers on the west coast.

Ice core records show melt days like these have happened only a handful of times in the past 1,000 years.
But, with the advent of human-caused climate change, the chances of these full-scale melt events happening are sharply increasing.

Even just a few decades ago, an event like this would have been unthinkable.
Now, island-wide meltdown days like this are becoming increasingly routine.
The ongoing melt event is the second time in seven years that virtually the entire ice sheet simultaneously experienced at least some melt.
The last was in July 2012, where 97 percent of the ice sheet simultaneously melted.

In the 1980s, wintertime snows in Greenland roughly balanced summertime melt from the ice sheet, and the conventional wisdom among scientists was that it might take thousands of years for the ice to completely melt under pressure from global warming.

 A satellite image shows melt ponds on the surface of the northeastern Greenland ice sheet on July 30.
(ESA/Sentinel-2)

That’s all changed now.

With a decade or two of hindsight, scientists now believe Greenland passed an important tipping point around 2003, and since then its melt rate has more than quadrupled.
This week alone, Greenland will lose about 50 billion tons of ice, enough for a permanent rise in global sea levels by about 0.1mm.
So far in July, the Greenland ice sheet has lost 160 billion tons of ice — enough to cover Florida in about six feet of water.
According to IPCC estimates, that’s roughly the level of melt a typical summer will have in 2050 under the worst-case warming scenario if we don’t take meaningful action to address climate change.
Under that same scenario, this week’s brutal, deadly heat wave would be normal weather in the 2070s.


This animated gif shows the mass Greenland's Jakobshavn Glacier has gained from 2016-17, 2017-18 and 2018-19.
Areas with the most growth — about 33 yards (30 meters) — are shown in dark blue.
Red areas represent thinning.
The images were produced using GLISTIN-A radar data as part of NASA's Ocean's Melting Greenland (OMG) mission.
More information on OMG can be found here: https://omg.jpl.nasa.gov/portal/.
Credit: NASA/JPL-Caltech / NASA Earth Observatory
 Greenland's Jakobshavn Glacier

Xavier Fettweis, a polar scientist at the University of Liège in Belgium who tracks meltwater on the Greenland ice sheet, told Rolling Stone in an email that the recent acceleration of these melt events means the IPCC scenarios “clearly underestimate what we currently observe over the Greenland ice sheet” and should revisit their projections for the future.

“This melt event is a good alarm signal that we urgently need change our way of living,” said Fettweis.
“It is more and more likely that the IPCC projections are too optimistic in the Arctic.”
Altogether, the Greenland ice sheet contains enough ice to raise global sea levels by about 24 feet.

 Melt ponds in Western Greenland, active 2019 wildfire and 2017 wildfire burn scar (August 1, 2019)
Cpernicus sentinel-3
 courtesy of @Pierre_Markuse

Unusual wildfires across Siberia, Scandinavia, Alaska, and Greenland have been raging all summer, and by one estimate released about 50 million tons of carbon dioxide in the month of June alone — equivalent to the annual emissions of Sweden.
In Switzerland, some glaciers melted so rapidly during last week’s heatwave that they sent swirling mudflows racing downhill.
In the Arctic Ocean, sea ice is at a record-low extent as the melt season continues to lengthen.
In Alaska, ecosystems are rapidly changing, especially in the Bering Sea region where this year’s ice-free season began in February.

About 200 million tons of sediment enter the Sermilik Fjord in southwestern Greenland every year. Mining just some of it could make Greenland a major exporter of sand to the world.

As daunting as this is, the latest science on Greenland also points to a window of hope: Greenland’s meltdown is not yet irreversible.
That self-sustaining process of melt-begetting-more-melt would kick in at around 1.5 or 2 degrees Celsius of global warming.
That means whether or not Greenland’s ice sheet melts completely is almost entirely in human control: A full-scale mobilization ­— including rapidly transforming the basis of the global economy toward a future where fossil fuels are no longer used — would probably be enough to keep most of the remaining ice frozen, where it belongs.

Links :

Thursday, August 1, 2019

New Zealand (Linz) update in the GeoGarage platform

21 nautical raster charts updated & 1 new chart added

Alaskan glaciers melting 100 times faster than previously thought

Tidewater glaciers, like this one in Alaska, experience underwater melting 100 times faster than scientists previously estimated from theoretical models.
Photograph by Jim Mone / AP

From National Geographic by Jenny Howard

Putting an old technology to novel use, scientists looked at how tidewater glaciers melt underwater.

Their results were startling.

A new way of measuring how some glaciers melt below the surface of the water has uncovered a surprising realization: Some glaciers are melting a hundred times faster than scientists thought they were.

In a new study published today in Science, a team of oceanographers and glaciologists unpeeled a new layer of understanding of tidewater glaciers—glaciers that end in the ocean—and their dynamic processes.

“They’ve really discovered that the melt that’s happening is fairly dramatically different from some of the assumptions we’ve had,” says Twila Moon, a glaciologist at the National Snow and Ice Data Center at the University of Colorado-Boulder who was uninvolved with the study.

Some of this calving and glacial melt is a normal process that glaciers undergo during seasonal transitions from winter to summer, and even through the summer.
But a warming climate accelerates glacier melting across the globe, potentially through melting across the surface of the glacier, but also through underwater melting.

Glaciers can extend hundreds of feet below the surface, explained Ellyn Enderlin, a glaciologist at Boise State University who was not involved with the study.
Finding higher rates of submarine melting tells us that “glaciers are a lot more sensitive to ocean change than we’ve even thought.” Understanding the melting processes and calculating the amount of melt accurately is essential for planning for sea level rise.

Watch an Alaskan glacier melt
In Seward, Alaska, Exit Glacier is melting at an astonishing rate.
This stunning short film examines the glacier’s dramatic impact through the voice of local guide Rick Brown.

“We are just super jazzed that we can even do this,” says lead author David Sutherland, an oceanographer at the University of Oregon.
“We weren’t 100 percent sure it was going to work.”

Monitoring specific glaciers for a long period of time can give researchers—and high school students—an idea of climate change-induced melting.
Students at Petersburg High School near LeConte Bay started collecting data about the position of the glacier’s terminus in 1983.
Their noting of the glacier’s retreat several years ago alerted scientists at the University of Alaska Southeast, piquing interest in better understanding melting at the glacier.

Glaciologist Elizabeth Case, of Lamont Earth, takes Scientific American
out near Juneau to study and live on the shifting ice.

Measuring melting masses of ice


LeConte was an ideal glacier to study because it is really accessible for a tidewater glacier, Sutherland said.
A complex environment, the project required so many lines of data that teams of oceanographers and glaciologists collected data simultaneously at the glacier.

Calculating how fast a glacier melts requires more finesse than measuring a melting ice cube in a glass of water.
With a glacier, you have to know how fast the ice moves into the fjord, as well as what proportion is melting and what proportion is breaking off, or calving.

It was “pretty simple in my head, and sounded good on paper,” laughs Sutherland.
But navigating a boat into the fjord, where the LeConte Glacier slips into the sea, is tricky on a good day.
Scientists spent weeks aboard the boat working 24 hours a day, with each scientist taking 12-hour shifts.

Mountain goats scrambled on ridges above and whales frequented the fjord, with seabirds dipping into the water.
“When you aren’t wishing for better weather…it was a pretty awesome place to be,” says Sutherland.

From the 80-foot MV Stellar, oceanographers performed sonar surveys underwater, like the ones used to measure ocean depths.
Instead of directing the sonar toward the ocean floor, though, they angled the sonar to collect the 3D underwater portion of the glacier face.

Oceanographers then had to know how quickly the sonar traveled through the fjord water to make accurate calculations.
Further “basic” measurements of water properties, like salinity and temperature, were necessary, Sutherland explained.
Dangling super-expensive instruments over the side of the boat could sometimes be tense.

Scientists repeated their observations during two summers, obtaining multiple scans each trip.
“To be able to scan an entire glacier face repeatedly over the summer is not easy,” says Eric Rignot, a glaciologist at the University of California, Irvine who was not involved with the study.

Too much ice in front of the glacier means “the boat can’t push through the ice,” says Rignot.
Sometimes that meant the boat suddenly had to retreat from the face of the glacier, while scientists crossed their fingers that the equipment wasn’t sheared off into the water.

Simultaneously, a team of glaciologists camped on a ridge overlooking the glacier.
They “babysat” a delicate radar instrument to measure the natural movement of the glacier.
Time-lapse cameras were used to measure glacier flow so that they knew how fast the ice moves toward the ocean, says Jason Amundson, a glaciologist and co-author of the study at University of Alaska Southeast.

Glacial ice accelerates as the ice approaches the front of the glacier, where it drops into the ocean, said Moon.
She compares the ice movement to squeezing a tube of toothpaste: Once your toothpaste gets to the very end, it doesn’t have any other toothpaste blocking its progress, so it moves more quickly.
Ice near the glacier face can move almost 75 feet per day and knowing this speed is essential to calculate melting.

From the datasets, researchers were able to calculate a total melting rate for the underwater portion of the glacier: two orders of magnitude higher than they expected.
Rignot said one of the theoretical models, used for 20-30 years, was known to be a simplified version that didn’t work perfectly.

Several processes of melting happen at a tidewater glacier, which is why scientists tackled the melting mystery from multiple angles.
If a big block of ice is sitting in a bathtub and nothing else is going on, it would just be melting at a background rate.

When a plume of freshwater from surface melt enters the fjord, it hits the fjord close to the glacier face.
The more buoyant freshwater rises to the surface and then undercuts, or erodes the glacier face.

And then you have this submarine melting that occurs wherever the ocean touches the surface of the glacier.
The really cool part of the new method, said Sutherland, is that you can pinpoint the exact location where higher melt occurs.

“A considerable amount of ice that gets pushed out into the ocean melts right there where it’s in contact with the ocean…so that glacier is actually losing a lot of mass due to that melting,” says Enderlin.
“A pretty large percentage of the ice that flows into the ocean is melted away by the warm ocean water,” says Amundson.

They calculated that the glacier melted underwater at a rate of almost 5 feet per day in May and up to 16 feet per day in August.
Later in the season, the warmer water increased the underwater melting.
Usually less than 6 degrees Celsius, water in LeConte Bay is warm relative to the ice, and even other fjords around the world.

Underwater melting of tidewater glaciers is occurring much faster than previously thought, according to a new study of the LeConte Glacier in Alaska.
Photo: NOAA

What about other glaciers?

The success of the new method “opens the door for researchers to do this all over the world,” says Sutherland.
Specifically, insight from the research at LeConte Glacier in Alaska could be used to study glaciers in Greenland and Antarctica.
“Submarine melting may matter everywhere,” says Enderlin.

Only 50 of approximately 100,000 glaciers in Alaska are tidewater glaciers, and they’re some of the biggest.
These “glaciers can change much more quickly than valley glaciers because of the processes that are happening right where the glacier flows into the ocean,” says Amundson.

Primarily a massive ice sheet, Greenland has about 200 outlet glaciers, but the water there is much colder compared to the temperature in LeConte Bay.


Alaskan glaciers primarily experience surface melt, since so few end in the ocean, said Rignot.
Greenland experiences surface melt as well as melting by tidewater glaciers.
But in Antarctica this submarine melting is the only type of ice melt, so understanding the processes outside Alaska are important.

If you turn the knob of climate up, like with climate change, says Sutherland, you increase the temperature of water and air and you will certainly get more melting.
That can be difficult to disentangle from natural melting, though.

“These observations pretty clearly show us that there are things that we’ve been missing,” says Moon.
“It’s a real call to action,” to better understand how these systems work.

Fortunately, scientists have some time to figure it out.
“These glaciers aren’t getting lost that fast…they’ll be around for decades to come,” says Sutherland.

Links :

Wednesday, July 31, 2019

Iran: what the law of the sea says about detaining foreign ships in transit

Seized: the Stena Impero in the Iranian port of Bandar Abbas.
Hasan Shirvania/EPA

From The Conversation by Andrew Serdy


With the British ship the Stena Impero now detained in an Iranian port, under investigation for its alleged transgression against navigation regulations in the Strait of Hormuz, there are several legally curious aspects to this affair.

So far, the Iranian authorities have given only scant detail of what the unlawful actions of the UK-flagged ship were that caused them to detain it.
The information seems contradictory.
Some reports say the ship collided with a fishing vessel, others that the change of course ordered by Iran’s Revolutionary Guard vessel was for security reasons.

Both explanations are wanting as pretexts for interfering with merchant shipping in straits used for international navigation during peacetime.


Keeping transit flowing

The legal regime for such straits, in Part III of the UN Convention on the Law of the Sea(UNCLOS), is designed precisely in order to keep open such vital chokepoints for seaborne trade.

Under Article 44, states bordering straits may not hamper transit thought them, nor suspend passage for any reason.
Article 39 obliges ships exercising the right of transit to proceed without delay through the strait, refraining from any threat or use of force against states bordering the strait.

In addition, Article 41 requires ships in transit to respect applicable sea lanes and traffic separation schemes.
Such a scheme does exist in the Strait of Hormuz, adopted by the International Maritime Organization, which directs westbound traffic within the strait through Iranian territorial waters.
It’s not clear where in relation to the outer limit of Iran’s territorial sea the Stena Impero was when the Iranian action took place, but Iran is not alleging the ship had no right to be where it was.

Ships in transit must also comply with generally accepted international regulations, procedures and practices for safety at sea, including the 1972 International Regulations for Preventing Collisions at Sea, and for preventing pollution.

Iran signed UNCLOS, but unlike the UK, never went on to ratify it.
This raises questions as to whether Iran is even bound by anything in the treaty.
If the matter were ever to go before an international court or tribunal – though that is unlikely as it would depend on Iranian consent to being sued – it would be in the UK’s interests to argue that the Part III regime, negotiated nearly 40 years ago, has also come to represent the customary international law on passage through such straits, applicable to all states.
This argument would stand a reasonable chance of succeeding.

The claim by the owners of the Stena Impero that the ship was in international waters needs to be approached with scepticism.
In the narrowest parts of the strait no such waters exist: all of it is within the territorial sea of either Iran or the other coastal state, Oman.
Still, there is nothing in Part III that allows a coastal state to intervene and order a vessel into port – the purpose of the legal regime is to keep traffic moving, and to deal afterwards with the legal consequences of any navigational incidents.

The 1982 UN Law of the Sea Convention means Hormuz is an international strait,
so all ships enjoy the right of safe passage through it :
Iran has not ratified the UN Convention on the Law of the Sea, as the US did not.

An act of retaliation

Iran threatened to retaliate against the UK for the detention in Gibraltar in early July of the Grace I, a tanker with a cargo of Iranian oil allegedly bound for a Syrian port contrary to EU sanctions.
It’s conceivable that Iran regards its act against the Stena Impero as authorised by the legal doctrine of countermeasures – but this is a rather long bow to draw.

Unlike domestic legal systems that normally frown on those who take the law into their own hands, in international law there is no police force, and to fill that gap the doctrine of countermeasures permits a limited degree of direct enforcement of obligations owed by one state to another, under a number of conditions.
The most straightforward of these is proportionality: detention of one ship in response to that of another.
But any defence based on countermeasures is always risky: the state advancing it is effectively admitting that its actions would otherwise be unlawful, and it depends on the accusation of prior breach by the other state being legally correct.

Yet it’s less than obvious that the UK’s detention of the Grace I did infringe Iran’s rights.
It may not even be an Iranian ship: it was removed by Panama from its shipping register in late May, alongside several others, on suspicion of breaching sanctions.
Unless Iran has since taken the Grace I onto its own register – of which there is no evidence to date – its only clear link with the Grace I is property in the cargo of petroleum, limiting Iran’s ability to argue its retaliation in taking the Stena Impero was a countermeasure.
And it certainly isn’t, as Iran has claimed, an act of piracy.

Piracy by the definition in Article 101 of UNCLOS can be committed only beyond the territorial sea, and the Strait of Gibraltar, like the Strait of Hormuz, is narrow enough to be completely overlapped by the territorial seas of the states on either side of it.
It can also only be committed for private ends by the crew or the passengers of a private ship or aircraft.
So the only way piracy can be committed by a warship or state-operated helicopter is if the crew has mutinied and is engaged in plunder for profit – clearly not the case with either of the detained ships.
“State piracy”, the UK’s equally overheated countercharge, doesn’t exist either.

All of the above is predicated on the law applicable in peacetime.
The picture would be very different if an armed conflict were to break out between Iran and the UK, and would justify many of the acts that appear legally dubious on the analysis above.
That may still happen if the escalating tension gets out hand, but we are not there yet.

Links :

Tuesday, July 30, 2019

China’s hidden Navy

Even China’s two-decade-old policy of subsidizing fishing as an assertion of sovereignty can’t explain the behavior of most Chinese vessels in the Spratlys in recent years.
China's maritime militia is playing an increasingly visible role in asserting Chinese maritime claims. AMTI director lays out the facts on the largest fleet in the South China Sea and how it raises the risk of armed conflict:

From Foreign Policy by Gregory Poling

The evidence shows that supposed fishing boats around contested islands are part of an extensive maritime militia.

The Spratly Islands, occupied by five different claimants, are the most hotly contested part of the South China Sea.
Thanks to the harbors and supporting infrastructure Beijing constructed on its outposts there over the last five years, most vessels operating around the Spratlys are Chinese.
And most of those are at least part-time members of China’s official maritime militia, an organization whose role Beijing frequently downplays but that is playing an increasingly visible role in its assertion of maritime claims.

A small cohort of analysts continue to cast doubt on the existence and activities of the maritime militia.
The best-intentioned offer alternative explanations for the curious behaviors of the Chinese fishing fleets, though those don’t stand up to scrutiny.
Other writers, especially those affiliated with Chinese institutions and state media, seek to present an alternate version of reality by artfully cropping satellite imagery, cherry-picking data, or simply ignoring the facts and attacking the motives of those presenting evidence of militia activities.


The South China Sea is the most contested piece of geography on the planet.
CSIS's Greg Poling explains how China uses maritime militias to intimidate its neighbors and assert its claim over the South China Sea.

This is unsurprising—the purpose of employing a maritime militia is to keep aggression below the level of military force and complicate the responses of other parties, in this case chiefly the other claimants (Vietnam, the Philippines, Malaysia, and Taiwan) as well as the United States, by hiding behind a civilian facade.
Without deniability, the militia loses much of its value.
That gives China a strong incentive to dissemble and deny evidence of its actions.
But that evidence speaks for itself.

The People’s Armed Forces Maritime Militia is not a secret.
Article 36 of the China Military Service Law of 1984, revised in 1998, calls for the militia “to undertake the duties related to preparations against war, defend the frontiers and maintain public order; and be always ready to join the armed forces to take part in war, resist aggression and defend the motherland.” China’s 2013 defense white paper enhanced the maritime militia’s role in asserting sovereignty and backing up military operations.
This is the naval analogue to China’s larger and better-known land-based militia forces, which operate in all Chinese theater commands, supporting and under the command of the People’s Liberation Army (PLA).

In 2013, Chinese President Xi Jinping visited the maritime militia in Tanmen township on Hainan, China’s southernmost province, and labeled it a model for others to follow.
Andrew Erickson, Conor Kennedy, and Ryan Martinson at the China Maritime Studies Institute at the U.S.
Naval War College have spent years documenting the activities of the maritime militia, including extensive acknowledgment by Chinese authorities and many instances in which militia members have publicly discussed their activities.


A review of available remote sensing data by the Center for Strategic and International Studies and Vulcan Inc.’s Skylight Maritime Initiative, including infrared imaging, synthetic aperture radar, and high-resolution satellite imagery, shows that the largest number of vessels operating in the Spratly Islands belongs to the Chinese fishing fleet, which frequently numbers between 200 and 300 boats at Subi and Mischief Reefs alone.
This is not by itself peculiar: China maintains the world’s largest fishing fleet, and its distant water vessels operate around the globe due to overfishing and pollution of Chinese coastal waters.
But the vessels operating in the Spratlys are not part of that distant water fleet—those boats are larger and head farther afield in the hunt for high-value migratory species.
And at 800 nautical miles (about 920 miles) from the mainland, the Spratlys are too far for small and medium-sized Chinese fishing vessels to operate productively without being heavily subsidized.

But even China’s two-decade-old policy of subsidizing fishing as an assertion of sovereignty can’t explain the behavior of most Chinese vessels in the Spratlys in recent years.

AIS signals detected in the South China Sea in June 2018.
CSIS

Chinese fishing boats in the islands average more than 500 tons, well over the size legally required for boats undertaking international voyages to use Automatic Identification System (AIS) transceivers, which broadcast identifying information, headings, and other data about oceangoing vessels.
But fewer than 5 percent of them actually broadcast AIS signals at any given time.
This suggests a fleet intent on hiding its numbers and actions.

These large, modern vessels represent a stunning level of sunk capital costs but do not engage in much commercial activity.
Frequent satellite imagery shows that the vessels spend nearly all of their time anchored, often in large clusters.
This is true whether they are inside the lagoons at Subi and Mischief Reefs or loitering elsewhere in the Spratlys.
Operating in such close quarters is highly unusual and certainly not the way commercial fishing vessels usually operate.

Light falling net vessels, which account for the largest number of Chinese fishing boats in satellite imagery of the Spratlys, very rarely have their fishing gear deployed.
China’s trawlers, meanwhile, almost never actually trawl; instead, satellite imagery and the AIS signals of those few trawlers regularly broadcasting both show that they spend most of their time at anchor.
These unusual, and highly unprofitable, behaviors suggest that most of these supposed fishing boats are not making a living from fish.

 Chinese fishing vessels at Subi Reef on August 12, 2018.
© DigitalGlobe, Inc. and © Vulcan Technologies LLC. All Rights Reserved

When Chinese fishing vessels are not at Subi or Mischief Reefs, they are most often seen in satellite imagery anchored near Philippine- and Vietnamese-held outposts in the Spratlys.
This is corroborated by the small number of AIS signals detected from Chinese ships.
The most spectacular example of this behavior was the swarm of vessels from Subi Reef that dropped anchor between 2 and 5 nautical miles from Philippines-held Thitu Island as soon as Manila began modest upgrade work on that feature in December 2018.
The number of vessels seen in satellite imagery peaked at 95 on Dec. 20, 2018, before dropping to 42 by Jan. 26.
That presence continued into early June, when reports suggested that China had begun to pull back the vessels.
The exact number of ships fluctuated from day to day, but almost none broadcast AIS or deployed fishing gear, and they operated in much closer quarters than any commercial fishing vessels would.

 Using a combination of technologies -AIS, SAR, VIIRS, and optical imagery- to track the South China Sea's dark fishing fleets in our new report as part of the CSIS Stephenson Ocean Security project.

The Armed Forces of the Philippines confirmed that it had monitored 275 individual Chinese vessels swarming near Thitu between January and March, and Manila filed protests with Beijing over their presence.
Meanwhile satellite imagery from March to April showed another cluster of Chinese vessels displaying the same puzzling behavior around two other Philippine-held features: Loaita Cay and Loaita Island.
In that case, some dropped anchor just half a nautical mile from the isolated Philippine facility on Loaita Cay.

Links :

Monday, July 29, 2019

The travel guide that charted our world

Theatre of the World features a small drawing of Ferdinand Magellan’s ship, Victoria
(Credit: Rossi Thomson, by permission of the Biblioteca Civica Bertoliana – Vicenza)

From BBC by Rossi Thomson

Essentially travel guides, these old books and maps were used by sailors, academics and travellers in the 15th and the 16th Centuries to navigate and explore the world.

Checking a navigation mobile app to quickly establish how to get from point A to point B has become second nature to us.
Measured in megabytes, the world now fits in our pockets.
It is quite astonishing, then, to see first-hand that only a few centuries ago geographical knowledge was yet to be fully charted, and how religious beliefs and fear of the unknown co-existed with burgeoning scientific know-how.

“Look here,” said Mattea Gazzola as her gloved hand pointed to the 570-year-old planisfero (a planisphere, or spherical world map) in front of us.
“To the east is the Biblical Paradise depicted as a walled town dotted with towers.
To the south is an unbearably hot impassable desert, and to the north lies another desert uninhabited due to extreme cold. In the centre of the world is Jerusalem.”

Giovanni Leardo’s planisphere is based on Ptolemy’s geocentric model
(Credit: Rossi Thomson, by permission of the Biblioteca Civica Bertoliana – Vicenza)

This world map, which dates to 1448 and was authored on parchment by Venetian cartographer Giovanni Leardo, is both beautiful and intriguing.
Combining Ptolemy’s geocentric model (the idea that the Earth is at the centre of the Solar System), Christian beliefs, pagan symbols, Arabic geographical theories and scientific formulas, it represents the continents as they were then-known by Europeans, surrounded by a big ocean.
Six concentric circles drawn around the world and filled in with tiny, neat numbers and letters allow the user to calculate when Easter takes place, the months of the year and the phases of the moon.

The Italian word ‘planisfero’ comes from the Latin planus (flat) and sphaera (sphere), and there are only three known of these world maps hand drawn and signed by Leardo.
The oldest one (1442) is held at the Biblioteca Comunale in Verona; the newest (1452) is kept by the American Geographical Society Library; and the middle one (1448) takes pride of place in the collection of the Biblioteca Civica Bertoliana in Vicenza, a smaller Italian city sandwiched between Venice and Verona.

Housed in a former Somascan monastery, the archive of Biblioteca Civica Bertoliana contains thousands of rare books and manuscripts.
If placed in a line, they would stretch more than 19km.
Over the centuries, these tomes were donated to the library by the rich noble families of Vicenza, a city known for its architectural heritage, historical silk and jewellery trades, as well as its allegiance to the Republic of Venice during its maritime heyday.

Now, some of the most precious and intriguing of these books and manuscripts lay on a wide, old-fashioned desk in front of me in the dusky room of the library's archive.
Essentially travel guides, these books and maps were used by sailors, academics and travellers in the 15th and the 16th Centuries to navigate and explore the world.

Leafing through them, Gazzola – the library's archivist – told a story.

A new era of mapping the world

Between the invention of the printing press in c. 1440 and the Age of Exploration reaching one of its pinnacles in the late 15th and early 16th Centuries, a revolution took place in the art of mapping and describing the world.
First-hand knowledge gained through seafaring, commerce, geographical discoveries, complex mathematical calculations and even religious pilgrimages to the Holy Land came flooding in and changing the outlines of the maps of the times.

Within 150 years, the geographical model of Leardo's planisfero was left behind, and the world more or less as we know it today emerged.

An important step along the way was the publication (in 1475 in Vicenza) of the first printed edition of Ptolemy's Geography in Latin.
Claudius Ptolemy, a 2nd-Century Greco-Roman mathematician, astronomer and geographer, had described the world known to the Roman Empire at the time and assigned geographical coordinates to all places.
As such, Earth was a strip of flat land about 70 degrees wide with Cadiz to the west and India or Cathay (China) to the east.


Maps based on Ptolemy’s Geography facilitated the exploratory travels during the 15th Century
(Credit: Rossi Thomson, by permission of the Biblioteca Civica Bertoliana – Vicenza)

Ptolemy's work was re-discovered by Byzantine scholar Maximus Planudes in the 13th Century, and for hundreds of years Ptolemy was held as the supreme authority on all things cartographic and geographical.
Unfortunately, his original maps had been lost, and Planudes recreated them on the basis of the written text and coordinates.

After Ptolemy's Geography had been translated from Greek into Latin in 1406 by hand, more maps were drawn by many different cartographers based on Ptolemy’s text, coordinates and mathematical calculations.
These maps facilitated the exploratory travels during the 15th Century and led to a renaissance in cartography.

The 1475 Vicenza edition of Ptolemy's Geography didn't include the maps (only his original text and coordinates).
Instead, Gazzola showed me a later edition of the seminal work published in Rome on 4 November 1490.The large and heavy tome is interspersed with 31 detailed printed maps which had been coloured by hand in yellow and ochre tones for the lands and blue shades for the seas.

Typically for an incunabulum (the term used to designate the earliest printed books, especially ones before 1501), the book doesn't have a frontispiece.
Just like a manuscript, this early edition of Ptolemy's Geography starts directly with the text without any preface.

“Frontispieces giving the name of the author, the work and the printing date only really started being used after 1500,” Gazzola explained.
This is when the Venetian humanist scholar and publisher Aldus Manutius revolutionised the printing world.
“The modern book starts with him.” In the era of the Venetian dominance over the Adriatic and the Mediterranean seas, Manutius established the printing office Aldine Press (in Venice), was the first to introduce italics fonts, and published more than 130 books in Greek and Latin.

A harbinger of modern-day travel guides

The next travel book Gazzola showed me had a detailed, beautifully printed frontispiece.
And a very long title: Quae intus continentur Syria, Palestina, Arabia, Aegyptus, Schondia, Holmiae, Regionum Superiorum Singuale Tabulae Geographicae.

Jacobus Ziegler’s work includes descriptions aimed to help travellers to the Biblical lands
(Credit: Rossi Thomson, by permission of the Biblioteca Civica Bertoliana – Vicenza)

Written by the Bavarian humanist and theologian Jacobus Ziegler and published in 1532 in Strasbourg, this is a harbinger of modern-day travel guides.
The book includes a detailed description of the Biblical lands and aims to help pilgrims on their travels through them.
It contains information about the different cities there and the local traditions, thus setting the tone for the millions of travel guides to be published around the world from then onwards.

Gazzola picked up a small leather-bound book that she described as ‘molto geniale’, or ‘very clever’ in English.
This is Cosmographia (also known as Cosmographicus Liber) by the German humanist and print-shop owner Petrus Apianus.

Known for his works in the fields of mathematics, cartography and astronomy, Apianus published Cosmographia in 1524.
It was one of the first works to base geography on mathematics and measurements.
Such was its success that it was reprinted 30 times in 14 languages.
The one I was looking at was a first edition in Latin printed in 1540 in Antwerp (one of the three leading centres of early European printing, along with Venice and Paris).

Exploring astronomy and navigation, Cosmographia is notable for its use of volvelles, wheel charts with rotating parts.
Made by layering several pieces of printed paper, the volvelle forms a complicated instrument – an early example of a calculator or an analogue computer – that allows the user to determine the position of the stars, lunar phases and the zodiacal signs, as well as other important factors for sea travel.

“Preparing the wooden plates to print the different parts of the intricate volvelles would take weeks,” Gazzola said while gently flipping the top layer of one of these devices to show me that the paper used for its construction was printed with music notes on the reverse.
Print shops at the time would recycle even the smallest scraps due to the high price of paper.

Apart from four volvelles, Cosmographia is also famous for containing a world map, which is one of the earliest to show in detail the entire east coast of North America.

Geographic knowledge was constantly expanding at the time.
One of the contributing factors for this was the technical travel literature – a body of abacus books, port tariffs, multilingual glossaries, maps and pilot books – helping the Italian Maritime Republics explore and control the merchant and military naval routes in the Mediterranean.

Hand-drawn parchment maps called ‘portolanos’ were created by ships’ cartographers
(Credit: Rossi Thomson, by permission of the Biblioteca Civica Bertoliana – Vicenza)

Cartographers working on ships produced detailed nautical charts.
Gazzola picked up a portolano, a hand-drawn parchment map outlining all known Mediterranean ports, coastal cities, naval routes, docking areas and compass roses.

Little icons indicated the character of each place.
For example, there were drawings of a camel, a lion and an ostrich on the African coast.
Colourful flags flapped above turreted city icons, and countless place names neatly traced the coastlines.

The portolano dates to the second half of the 16th Century.
As it was a work tool, it was not signed by its author and changes could be freely made to it in accordance with the navigational needs of the ship on which it was used.

The first coffee table book?

Unlike the portolano, the next book Gazzola showed me was devised as a splendid forerunner of coffee table books.
Called Theatre of the World (in Latin, Theatrum Orbis Terrarum), it is the first true modern atlas.
Written by the Flemish scholar and geographer Abraham Ortelius, it was originally printed in 1570 in Antwerp.
For the first time, one book contained the whole of Western European geographic knowledge in both text and maps.
The maps, based on the work of the best cartographers, were uniformly scaled and printed using copper plates and then hand-coloured with paints that still look incredibly bright and fresh.

Such was the Renaissance hunger for geographic and scientific knowledge of the rich middle classes – who valued books as a symbol of knowledge – that the atlas was repeatedly reprinted in Latin, French, German and Dutch among other languages.

Abraham Ortelius’ Theatre of the World is considered the zenith of 16th-Century cartography
(Credit: Rossi Thomson, by permission of the Biblioteca Civica Bertoliana – Vicenza)

At the time of its many publications between 1570 and 1612, Theatre of the World was a highly valued and rather expensive book that the rich merchants and noblemen of Europe liked to add to their prized collections.
Nowadays, it is considered the zenith of 16th-Century cartography.

Many of the maps contained in it are based on sources that no longer exist or are extremely rare.
The names of the geographers and cartographers both used as sources by and known to Ortelius were provided in an extensive list called Catalogus auctorum tabularum geographicarum (Catalogue of the Authors of the Geographical Maps) in the Theatre of the World.

In 1570, the list in the first edition included 87 names; in just over three decades it had grown to 183 names.
Among them, for example, is the naturalist Charles de l'Écluse (better known by his Latin name Carolus Clusius) who published one of the earliest books on Spanish flora and whose work inspired the map of Spain in Ortelius’ Theatre of the World.

The atlas is astonishing to look at.
Apart from depicting strictly geographical features, each map is also adorned with detailed drawings of local customs as well as phantasmagorical creatures.
The edition kept at the Biblioteca Civica Bertoliana is from 1592 and it contains 108 maps.
It represents the world much as we know it today.

Curiously enough, a map of South America features a small drawing of Victoria, one of Portuguese explorer Ferdinand Magellan's five ships and the first to successfully circumnavigate the world.
Coincidentally, a notable passenger on Victoria was one Antonio Pigafetta, Magellan's diarist and one of only 18 people to return from the daring expedition.
Born in Vicenza, Pigafetta's name is still very much known and respected in the city.

The first voyage around the world

“Here it is,” Gazzola said and pulled out one last book.
“The First Voyage Round the World.”

This is Pigafetta's account of Magellan's circumnavigation.
Between 1524 and 1525, Pigafetta wrote his memoirs on the historic journey, drawn up from the meticulous diaries that he’d kept over the three years of travel.
The original diary of the first voyage around the world was given as a gift to Emperor Charles V, who ruled over the Spanish Empire and the Holy Roman Empire, and subsequently vanished, the Spanish court likely wanting to obliterate the merits of the Portuguese Magellan.

Antonio Pigafetta was an inconvenient witness to what happened during the expedition, and was hastily dismissed by the Spanish emperor.
However, on 5 August 1524, the Senate of the Republic of Venice granted Pigafetta the privilege of printing his diary.


Antonio Pigafetta details Magellan’s travels in The First Voyage Round the World
(Credit: Rossi Thomson, by permission of the Biblioteca Civica Bertoliana – Vicenza)

The Biblioteca Civica Bertoliana keeps a later 18th-Century edition of Pigafetta’s diary with colour illustrations.
Reading this extraordinary book gives us a first-hand understanding of Magellan’s achievement and the incredible hardship his crew suffered.
From Magellan discovering the Pacific Ocean for Europe and giving it a name in line with its mild and gentle character (pacifico means ‘peaceful’ in Spanish and Portuguese) to important observations made by Pigafetta about the flora, fauna and the anthropology of the new lands, the text is peppered with geographic facts that propelled Europe’s scientific knowledge forward.

Of course, the most important finding made was that Earth is indeed round, and Magellan’s crew (according to Pigafetta’s calculations) covered 14,460 leagues (43,400 miles) to prove this.

Centuries after these seminal travel books and maps were first drawn and printed, it is quite incredible to think about the jumps in human knowledge our world has experienced since then.
Like bright lights in a deep fog, they led the world’s navigators, explorers, travellers and scientists step by step forward, charting the world and allowing us to have it at our fingertips today.

Links :

Sunday, July 28, 2019

Chart (paper) navigation

The steps for using a chart to fix your position, 
determine the dead reckoning, finding set and drift, course made good, and speed made good.

How to determine Course To Steer after knowing the set, drift, and leeway from the wind.