Saturday, August 10, 2013

A breathing Earth

Click here to see the large version (1.4 MB).
Click here to see the bonkers version (3.7 MB).

From IDVsolutions

Here's a view looking at one year of seasonal transformations on Earth.
Made possible by the tremendous folks of the NASA Visible Earth team, I downloaded the twelve cloud-free satellite imagery mosaics of Earth ("Blue Marble Next Generation") at each month of the year. 
I wrapped them into some fun projections then stitched them together into a couple animated gifs...

Click here to see the large version (3 MB).
Click here to see the irrationally large version (8.9 MB).

I of course had some expectation of what I would see as a result of animating these frames.
But I didn't expect to be so mesmerized by them.
I can't look away.

Why?
Having spent much of my life living near the center of that mitten-shaped peninsula in North America, I have had a consistent seasonal metronome through which I track the years of my life.
When I stitch together what can be an impersonal snapshot of an entire planet, all of the sudden I see a thing with a heartbeat.
I can track one location throughout a year to compare the annual push and pull of snow and plant life there, while in my periphery I see the oscillating wave of life advancing and retreating, advancing and retreating.
And I'm reassured by it.

Of course there are the global characteristics of climate and the nature of land to heat and cool more rapidly than water.
The effects of warm currents feeding a surprisingly mild climate in the British Isles.
The snowy head start of winter in high elevations like the Himalayas, Rockies, and Caucuses, that spread downward to join the later snowiness of lower elevations.
The continental wave of growing grasses in African plains.

But, overall, to me it looks like breathing.
And my pixel is right at an interesting intersection of life and ice, where the longest night of the year feels like forever, and the longest day of the year is a like a battery strapped to my back.
My winter was especially dark. And my summer has been full of blessings -but I don't think either extreme would have been as memorable without the helpful (or painful) contrast of its opposite -all made possible by a 23.5° tilt.

Friday, August 9, 2013

Canada CHS update in the Marine GeoGarage


29 charts have been updated (July 26, 2013) :
    • 1316 PORT DE QUEBEC
    • 1551 CHATS FALLS TO CHENAUX
    • 2293 BYNG INLET AND APPROACHES
    • 3000 JUAN DE FUCA STRAIT TO DIXON ENTRANCE
    • 3001 VANCOUVER ISLAND ILE DE VANCOUVER JUAN DE FUCA STRAIT TO QUEEN CHARLOT
    • 3456 HALIBUT BANK TO BALLENAS CHANNEL
    • 3459 APPROACHES TO NANOOSE HARBOUR
    • 3512 STRAIT OF GEORGIA CENTRAL PORTION
    • 3548 QUEEN CHARLOTTE STRAIT (CENTRAL PORTION)
    • 3603 UCLUELET INLET TO NOOTKA SOUND
    • 3668 ALBERNI INLET
    • 3676 ESPERANZA INLET
    • 3807 ATLI INLET TO SELWYN INLET
    • 4013 HALIFAX TO SYDNEY
    • 4023 NORTHUMBERLAND STRAIT
    • 4124 LETETE PASSAGE LETANG HARBOUR AND BLACKS HARBOUR
    • 4302 STRAIT OF CANSO
    • 4328 LUNENBURG BAY
    • 4340 GRAND MANAN
    • 4342 GRAND HARBOUR
    • 4379 LIVERPOOL HARBOUR
    • 4403 EAST POINT TO CAPE BEAR
    • 4404 CAPE GEORGE TO PICTOU
    • 4420 MURRAY HARBOUR
    • 4437 PICTOU HARBOUR
    • 6021A LAKE MUSKOKA - 1
    • 6021B LAKE MUSKOKA - 2
    • 6022A LAKE ROSSEAU AND LAKE JOSEPH
    • 6022B LAKE ROSSEAU AND LAKE JOSEPH
    So 688 charts (1660 including sub-charts) are available in the Canada CHS layer. (see coverage)

    Note : don't forget to visit 'Notices to Mariners' published monthly and available from the Canadian Coast Guard both online or through a free hardcopy subscription service.
    This essential publication provides the latest information on changes to the aids to navigation system, as well as updates from CHS regarding CHS charts and publications.
    See also written Notices to Shipping and Navarea warnings : NOTSHIP

    Marine life spawns sooner as our oceans warm

     Are changes in marine life consistent with climate change?
    Elvira Poloczanksa

    From The Conversation (Anthony Richardson / Elvira Poloczansk)
     
    Warming oceans are affecting the breeding patterns and habitat of marine life, according to a three-year international study published today in Nature Climate Change.
    This is effectively re-arranging the broader marine landscape as species adjust to a changing climate.

    Scientific and public attention to the impacts of climate change has generally focused on how biodiversity and people are being affected on land.

    In the last Intergovernmental Panel on Climate Change (IPCC) report in 2007, less than 1% of the synthesis information on impacts of climate change on natural systems came from the ocean.

    Yet marine systems cover 71% of Earth’s surface, and we depend on marine life for food, recreation and half the oxygen we breathe.
    A key unanswered question is whether marine life is buffered from climate change because of the much more gradual warming in our surface oceans – about one-third as fast as on land.

     This eastern shovelnose stingaree was once unheard of in northern Tasmania.
    Now it is abundant.
    Peter Last

    What’s happening in our oceans?

    An international team of scientists from Australia, USA, Canada, UK, Europe and South Africa, and funded by the US National Center for Ecological Analysis and Synthesis, set out to answer this question.
    They conducted the first global analysis of climate change impacts on marine life, assembling a large database of 1,735 biological changes from peer-reviewed studies.

    ust as the medical profession pools information on the symptoms of individual patients from surgeries and hospitals to reveal patterns of disease outbreaks, we pooled information from many studies to show a global fingerprint of the impact of recent climate change on marine life.
    Changes were documented from studies conducted in every ocean, with an average timespan of 40 years.

    Although there is a perception in the general public that impacts of climate change are an issue for the future, the pervasive and already observable changes in our oceans are stunning.
    Climate change has already had a coherent and significant fingerprint across all ecosystems (coastal to open ocean), latitudes (polar to tropical) and trophic levels (plankton to sharks).

    These fingerprints show that warming is causing marine species to shift where they live and alter the timing of nature’s calendar.
    In total, 81% of all changes were consistent with the expected impacts of climate change.

     This Giant Rock Barnacle (Austromegabalanus nigrescens) is expanding down the east coast of Tasmania.
    Elvira Poloczanska

    Moving poleward, breeding earlier

    As temperatures warm, marine species are shifting their geographic distribution toward the poles. Most intriguingly, though, they are doing so much faster than their land-based counterparts.
    The leading edge or front-line of marine species distributions is moving toward the poles at an average of 72 km per decade — considerably faster than species on land that are moving poleward at an average of 6 km per decade.
    Plankton and bony fish, many of which are commercially important, showed the largest shifts.

    Warmer temperatures are also changing the timing of breeding, feeding, and migration events.
    For marine life, their spring events have advanced by more than four days, nearly twice the figure for land.
    The strength of response varied among species, but again, the research showed the greatest response — up to 11 days in advancement — was for plankton and larval bony fish.

    Currents clearly play a role in the large distribution movements seen in the ocean, but there is a more-subtle phenomenon is also at work.
    Temperature gradients are more gentle in the ocean than over much of the land, and this has important implications for species movement.

    Consider the complex topography on land.
    Many land plants and animals only need to move short distances up or down mountains to reach different temperature regimes.
    As the ocean surface is relatively flat, marine plants and animals must move greater distances to keep up with their preferred environments as oceans warm.

    Seasonal cycles are also dampened in the ocean, meaning that for a set amount of warming, marine species need to shift their timing much earlier than on land.

     The Tasman Sea is rapidly warming.
    Elvira Poloczanska

    Australian effect

    Although the study reported global impacts, there is strong evidence of change in the Australian marine environment.
    Australia’s south-east tropical and subtropical species of fish, molluscs and plankton are shifting much further south through the Tasman Sea.
    In the Indian Ocean, there is a southward distribution of sea birds as well as loss of cool-water seaweeds from regions north of Perth.

    Some of the favourite catches of recreational and commercial fishers are likely to decline, while other species, not previously in the area, could provide new fishing opportunities.
    Essentially, these findings indicate that changes in life events and distribution of species indicates we are seeing widespread reorganisation of marine ecosystems, with likely significant repercussions for the services these ecosystems provide to humans.

    Links :
    • ENS-Newswire :  Global scientists shocked by true scale of ocean warming

    Thursday, August 8, 2013

    Fukushima leaking radioactive water for ‘2 years, 300 tons flowing into Pacific daily’

    Japan's Fukushima nuclear plant is still leaking
    Ikonos Fukushima Daiichi : before / after

     >>> geolocalization with the Marine GeoGarage <<<

    From RT

    The rate at which contaminated water has been pouring into the Pacific Ocean from the disabled Fukushima nuclear plant is worse than thought before, an Industry Ministry official said as PM Shinzo Abe pledged to step up efforts to halt the crisis.
    "We think that the volume of water is about 300 tons a day," said Yushi Yoneyama, an official with the Minister of Economy, Trade and Industry, which regulates Tokyo Electric Power Co (TEPCO).

    Abe put the Minister of Economy, Trade and Industry in charge of the situation, while demanding that the plant's operator, TEPCO take the necessary steps to deal with the cleanup, which is anticipated to take more than 40 years at a cost of US$11 billion.

    On Wednesday TEPCO confirmed the leak but refused to confirm the quantity being emitted from the plant.
    "We are not currently able to say clearly how much groundwater is actually flowing into the ocean," Tokyo Electric Power spokesman Noriyuki Imaizumi told Reuters when asked for an estimate.

    Japanese authorities are working in crisis mode, attempting to assure the public both at home and abroad that the situation will not further deteriorate into a widespread environmental catastrophe.
    Yoneyama said the government plans to reduce the leakage amount to 60 tons per day by as early as December, but given the Japanese government’s progress in the cleanup to date that goal may be difficult to achieve.
    Removing 300 tonnes of groundwater, however, would not necessarily halt leakage into the sea, he said.

    The nuclear plant was severely damaged in an earthquake and subsequent tsunami in March 2011.
    About 90,000 people within a 20km radius of the plant were forced to evacuate their homes due to the possibility of a full-scale nuclear meltdown.

    Tanks of radioactive water tower over workers at the disabled Fukushima nuclear plant.
    Tokyo Electric Power admits contaminated water has long been leaking into the Pacific Ocean, defying containment efforts.
    Japan's government views the situation as "urgent."

    Nearing boiling point?

    Earlier, TEPCO said it detected 2.35 billion becquerels of cesium per liter in water that is now leaking into the groundwater through cracks in the plant’s drainage system.
    This radiation level is roughly the same as that measured in April 2011.

    The normal level is 150 becquerels of cesium per liter of water.

    For the past two years, TEPCO has claimed that it managed to siphon off the excess water into specially-constructed storage tanks.
    However, the company was forced to admit late last month that radioactive water was still escaping into the Pacific Ocean.
    These consistent failures are testing the patience of Japanese authorities.

    “You can't just leave it [disposing of radioactive waste at the plant] up to TEPCO," Shinji Kinjo, head of a Nuclear Regulatory Authority (NRA) told Reuters.
    "Right now, we have an emergency."

    Earlier this month, TEPCO was forced to go on the defensive after a scathing first-page article appeared in The Asahi Shimbun daily criticizing the company’s cleanup efforts.

    “TEPCO did nothing for more than two years despite having pledged to seal a leaking hole between a turbine building [the leakage source] and an underground pit [a trench] in April 2011 when water contaminated with radioactive materials…was found to have leaked into the ocean; and the company only began preparing for shielding tests this summer after contaminated water was found to be leaking into the sea this time,” the newspaper stated on August 1, 2013.

    TEPCO fired back with its own version of events, saying that despite “technical difficulties and a severe work environment” the company has been working to implement a plan “in order to further reduce the risk of having outflow of contaminated water beyond the trench."


    Although TEPCO engineers have constructed a barrier between the destroyed facility and the ocean, it only extends 1.8 meters below the ground, thus water continues to accumulate inside the plant vaults.
    "If you build a wall, of course the water is going to accumulate there. And there is no other way for the water to go but up or sideways and eventually lead to the ocean," Masashi Goto, a nuclear engineer who has worked at several TEPCO plants, told Reuters.
    "So now, the question is how long do we have?"

    TEPCO has pledged to begin pumping enough radioactive seepage to stop the water level from rising. But the company faces limitations, as its storage tanks are 85 percent full.
    “New measures are needed to stop the water from flowing into the sea," emphasized Kinjo, who accused TEPCO of failing to implement long-term solutions for a crisis that has been continuing for more than two years.

    Not only is TEPCO running up against technical problems associated with the cleanup efforts, it must also deal with the unpredictable force of nature, specifically in the form of earthquakes.
    On Sunday, a 6.0 magnitude earthquake struck off the coast of Miyagi prefecture, the same northeastern region of the island country that was devastated by the 9.0 magnitude earthquake and tsunami, which resulted in 15,000 people killed and more than 3,200 missing.
    No damage or injuries were reported in the latest earthquake, but some roads and railways were temporarily closed for safety inspections.

    Links :

    Wednesday, August 7, 2013

    Controversial 400-year-old Australian map exhibited

    Novae Guineae forma, & situs (Cornelis de Jode, 1593)
    source : NLA
    First printed map of Australia, one of the rarest and most highly sought after of all early maps of the region.
    The map appeared in the second edition of De Jode's rare Speculum Orbis Terrae, one of the rarest and most sought after of all late 16th Century Atlases and now virtually unobtainable on the market, especially in full orginal color.
    The map is one of two seminal maps covering the Pacific, the second showing the NW Coast of America.
    The map provides a relatively reasonable general depiction of the Queensland Coast.
    Recorded European maritime activity in this region in the 16th Century include Alvaro de Saavedra sent from Mexico by Fernand Cortez in 1527 who reputedly sailed 500 miles down the coast of Papuas during one of his attempts to return to Mexico.
    Another vessel under the command of the Spaniard Grijalva spent considerable time exploring the region in 1536.
    Due to a mutiny during the voyage, very few members of this expedition survived to give an account of what they found.
    Portuguese exploration along the east coast of Australia in the 1520s are symptomatic of other probable European maritime activity along this coast.
    These realities mixed with medieval creatures such as a gryphon, mermaids and other sea monsters indicate the antiquity from which this map was produced.

    From SpatialSource

    A controversial map that casts doubt on when Europeans discovered Australia will be displayed down under for the first time at an exclusive exhibition of the nation’s earliest chartings.

    Novae Guineae Forma and Situs – a 1593 map that depicts a giant, unnamed land mass believed by some experts to be Australia – pre-dates the earliest confirmed map of the continent by more than a decade.

    It is part of a collection of similarly unique, priceless maps – nearly all of which have never been displayed outside Europe – that will be exhibited by the National Library of Australia at Ozri 2013: A Spatial Odyssey, in Brisbane this September.


    The Ozri exhibit is being held ahead of the NLA’s highly anticipated exhibition, Mapping Our World: Terra Incognita to Australia, which will showcase some of the world’s most ancient maps sourced from the British Library, the Vatican and the Bibliotheque Nationale de France.

    National Library of Australia curator of maps, Dr Martin Woods, said Novae Guineae Forma and Situs was created by Dutch cartographer Cornelis de Jode and based on unverified Portuguese maps from that era.
    “It shows a southern continent below New Guinea complete with people, monsters and the Great Dividing Range,” Dr Woods said.
    “The map was created about 15 years before Australia was thought to be first mapped – and yet there it is below New Guinea, with people and ships already there.
    “It seems to contradict official thinking that Europeans were unaware that Australia existed prior to the 1606 Dutch landing on the west coast of Cape York Peninsula.
    “The map was donated to the National Library in 1911, where is has been stored since.”


    The exhibit also includes some of the very maps the Dutch made after their seventeenth century stopover.
    “We will feature two maps by the Dutch master cartographer Hessel Gerritsz that were the first to show Australia in relation to the Indian Ocean and Asia,” Dr Woods said.
    “These were produced in the 1620s – 150 years before Cook.”


    General chart of Terra Australis or Australia [1814] : showing the parts explored between 1798 and 1803
    by Matthew Flinders Commr. of H.M.S. Investigator.

    Also on display at the conference are maps that reveal Matthew Flinders’ – Australia’s most important cartographer – partly copied charts, made a century before his own.
    “With his ship sinking and supplies fast running out, Flinders decided to use 100 year-old Dutch maps to create the first ‘complete’ chart of Australia,” Dr Woods said.
    “So, in truth, the map was made without him visiting the west coast – and these maps by Flinders himself will also be on display at the Ozri conference.”

    Other maps in the exhibit include the first European atlas of China, created in 1655; an extremely rare sharkskin pocket globe from 1791; and the map that inspired the British to send Captain Cook down under.

    Ozri 2013 Technical Director Kellie Persson said although the early cartographers could not have known how high-tech their craft would become, they would still find something familiar in today’s technology.
    “These first maps of Australia were manually constructed with brushes and parchment, whereas modern map-makers use satellites and mobile tracking devices, and store their creations in the Cloud,” Ms Persson said.

    Tuesday, August 6, 2013

    US maritime limits based on UN sea law treaty

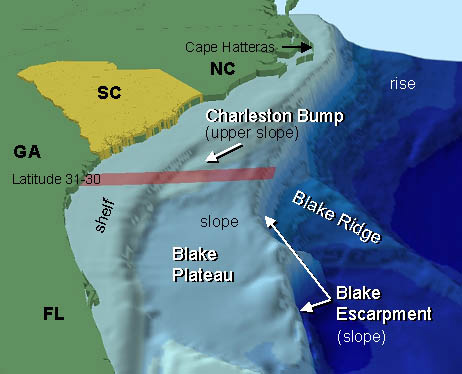
     The term "continental shelf" is used by geologists generally to mean that part of the continental margin which is between the shoreline and the shelf break or, where there is no noticeable slope, between the shoreline and the point where the depth of the superjacent water is approximately between 100 and 200 metres.
    However, this term is used in article 76 as a juridical term. 
    According to the Convention, the continental shelf of a coastal State comprises the submerged prolongation of the land territory of the coastal State - the seabed and subsoil of the submarine areas that extend beyond its territorial sea to the outer edge of the continental margin, or to a distance of 200 nautical miles where the outer edge of the continental margin does not extend up to that distance.
    The continental margin consists of the seabed and subsoil of the shelf, the slope and the rise.
    It does not include the deep ocean floor with its oceanic ridges or the subsoil thereof .

    From AmericanPress

    How much of the Gulf of Mexico is under United States control?
    When and how did this happen?

    The United States has a say in what happens in 700,000 or so square kilometers of the gulf — roughly the water north of a line drawn from the mouth of the Rio Grande to the Straits of Florida.
    The U.S. government has full sovereignty over its territorial waters, which extend 12 nautical miles from a baseline measurement, which is defined in the United Nations Convention on the Law of the Sea as “the low-water line along the coast as marked on large-scale charts officially recognized by the coastal State.”

     Southeastern United States continental shelf

    The official charts, maintained by the National Oceanic and Atmospheric Administration, identify the baseline as the “mean lower low-water line,” or MLLW.
    The baseline is set by the U.S. Baseline Committee, which is headed by the U.S. State Department.
    (see determination of the National Baseline)

     Continental shelf claims (2009)

    The sovereignty in territorial seas extends to the airspace above the water and to the seabed beneath it.
    In territorial waters, all nations’ vessels, including warships, have the right of “innocent passage” — i.e., presenting no threat to peace and security — but are subject to the sovereign nation’s laws.

    Additionally, the U.N. convention — a treaty the U.S. adheres to but hasn’t ratified — recognizes coastal nations’ right to exercise some control over a “contiguous zone,” which abuts the territorial waters and extends an additional 12 nautical miles seaward.

    In the contiguous zone, the U.S. may prevent and punish “infringement of its customs, fiscal, immigration or sanitary laws and regulations within its territory or territorial sea,” according to the treaty.

    The territorial seas claim, which includes the waters around Guam, Puerto Rico and the U.S. Virgin Islands, was made by presidential proclamation in 1988.
    The contiguous zone was established by presidential proclamation in 1999.

     EEZ & ECS (Extended Continental Shelf)

    The U.N. Law of the Sea Convention also grants coastal nations the right to set up an exclusive economic zone, which the United States established by presidential proclamation in 1983.
    The EEZ extends 188 nautical miles from the seaward boundary of the territorial waters — or 200 nautical miles from the baseline — and includes the contiguous zone.
    “Within the Exclusive Economic Zone,” the proclamation reads, “the United States has ... sovereign rights for the purpose of exploring, exploiting, conserving and managing natural resources, both living and non-living, of the seabed and subsoil and superjacent waters and with regard to other activities for the economic exploitation and exploration of the zone, such as production of energy from the water, currents and winds.”

    It also asserts the U.S. government’s “jurisdiction with regard to the establishment and use of artificial islands, and installations and structures having economic purposes, and the protection and preservation of the marine environment.”
    The U.N. treaty allows coastal nations to have jurisdiction over “marine scientific research” in an EEZ, but the presidential proclamation makes no claim to it. 

    Links :
    • UN : Commission on the Limits of the Continental Shelf (CLCS)
    • NOAA : US maritime limits & boundaries (view in Google Earth)
    • NOAA : digital maritime zones and national baseline (Meredith Westington presentation)

    Monday, August 5, 2013

    Mapping Roatan's spectacular deep reefs

    >>> geolocalization with the Marine GeoGarage <<<
    Credit: Scott Harris, College of Charleston

    From Schmidt Ocean

    The Falkor team has just completed the first-ever high-resolution map of deep reefs near the island of Roatan in Honduras.
    This new resource will not only aid future research in the area on the corals and other animals found there, it could also enable increased conservation of the reefs.

    When Dr. Peter Etnoyer, a marine ecologist at NOAA’s National Centers for Coastal Ocean Science, realized a few months ago that R/V Falkor would be headed for the Panama Canal after the Oases 2013 project, he saw a unique opportunity looming.

    Since 2010, Etnoyer and his colleagues, with support from Schmidt Ocean Institute, have been exploring small portions of the deeper slopes on the Meso-American Barrier Reef off Roatan’s coast. They’ve worked from the Idabel submersible that Karl Stanley built himself.

    Raw mapping data from a pass with Falkor's sonar.
    Credit: Schmidt Ocean Institute

    But that research was almost hit-or-miss at times because existing maps for these reefs were of such low resolution.
    Like many remote regions, the best available seafloor maps come from satellite data and have a resolution of at best 1km—that means you can’t even discern the rocky plateaus and outcroppings where corals are found, which are typically much smaller than a kilometer.
    But, Falkor’s sonar system creates maps with resolution in the 5 to 10-meter range, which reveals those critical features.

    After realizing how close Falkor would be to Roatan on it’s trip to the Pacific, Etnoyer and Matt Rittinghouse, a graduate student at the College of Charleston whom Etnoyer is advising, put together a quick proposal requesting that the team divert there to map a huge swath of the barrier reef’s deeper reaches.
    The project was quickly approved as a perfect fit for Schmidt Ocean’s mission to generate new ocean knowledge and make it publicly available.

     A garden of crinoids on a deep Roatan reef.
    Credit: Peter Etnoyer/Karl Stanley

    By the end of the day on July 10th, the ship’s crew had mapped a few hundred square kilometers of the continental slope in depths mainly from 300 to 1,000 meters, but as deep as 2,500 meters.
    The total area covered is in the range of 300 square kilometers.

    The maps will allow researchers to target the most interesting portions of the reefs for future explorations.
    By the end of the year Etnoyer’s team hopes to use the new map to identify and then explore new ridges and gullies no one even knew existed.
    And, if all goes well, the Ocean Exploration Trust, founded by Robert Ballard, also plan to use their impressive Hercules ROV to explore portions of these deep reefs as well, which would offer much more sample collection than possible with Idabel.

     A deep scene on the Meso-American Barrier Reef with brittle stars intertwined with sea fans.
    Credit: Peter Etnoyer/Karl Stanley

    The maps should also be a major step forward for deep reef conservation.
    Right now, a large chunk of Roatan’s portion of the barrier reef is set aside as the Sandy Bay West-End Marine Reserve, but that was designed to protect shallow corals and does not extend very far out to sea.
    That means the area’s spectacular deep reefs, which support countless fish and corals, are open to fishing.

    Etnoyer and Rittinghouse will combine the results of past research on where deep corals are found, and data from past Idabel video surveys, with the new mapping data to delineate key deep-sea coral habitats.
    Once this knowledge is available, local organizations, which strongly supported the permit application for the Falkor work, plan to push to extend the bounds of the protected areas so that the lesser-known but critically important deep reefs can also be protected.
    “Our role here is to provide as much useful information as we can to the local groups to help them make their own management decisions,” says Etnoyer.

    Raw data from the mapping will become available shortly at NOAA’s National Geophysical Data Center site.
    Over the next several months the researchers will be processing the data into maps that they’ll distribute to Roatan groups and officials, and add to Google Earth.

    Sunday, August 4, 2013

    William Trubridge, freedriver


    William Trubridge - Freediver from The Avant/Garde Diaries

    William Trubridge dives deep on a breathtaking journey into the big blue sea
    while by land breathing the zen of freediving. 

    When freediver William Trubridge prepares for another routine descent into the ocean riding only on a single breath – some nearly 400 feet down – his only immediate preparation is the cue to close his eyes and relax.
    Any errant thought robs the body of valuable energy, as does any unnecessary movement or visual stimuli.
    It’s no coincidence that this concentrated inner posture bears no small resemblance to the sensation of diving unencumbered and alone into the dark and mystical silence of the deep ocean.
    It’s an experience completely forgeign to those accustomed to scuba diving or snorkeling near the surface.
    Just off the Honduran island of Roatán, The Avant/Garde Diaries joined William Trubridge on one of his dives, capturing the serene beauty of an activity with roots in Korea nearly seven thousand years ago.
    Having himself only begun the activity ten years ago, Trubridge currently holds the world record for diving deepest, and he shows no sign of stopping.

    Links :
    GeoGarage blog : BreatheFree diver first to break 100m unassisted