Exploring hydrothermal vents, cold-seep habitats, and food-falls including whale-falls and the communities at shipwrecks.
Saturday, August 20, 2022
Friday, August 19, 2022
The Arctic is warming nearly four times faster than the rest of the world, new research finds
 Valleys cut by glaciers of the Greenland Ice Sheet along the mountains of Greenland on August 3, 2022. (Jim Urquhart / Reuters)
The findings suggest current climate models may not fully capture the feedback loops responsible for Arctic amplification.
The Earth is approximately 1.1 degrees Celsius warmer than it was at the start of the industrial revolution.
The Earth is approximately 1.1 degrees Celsius warmer than it was at the start of the industrial revolution.
That warming has not been uniform, with some regions warming at a far greater pace. One such region is the Arctic.
A new study shows that the Arctic has warmed nearly four times faster than the rest of the world over the past 43 years.
A new study shows that the Arctic has warmed nearly four times faster than the rest of the world over the past 43 years.
This means the Arctic is on average around 3 degrees C warmer than it was in 1980.
This is alarming, because the Arctic contains sensitive and delicately balanced climate components that, if pushed too hard, will respond with global consequences.
This is alarming, because the Arctic contains sensitive and delicately balanced climate components that, if pushed too hard, will respond with global consequences.
Why is the Arctic warming so much faster?
A large part of the explanation relates to sea ice.
This is a thin layer (typically one meter to five meters thick) of sea water that freezes in winter and partially melts in the summer.
The sea ice is covered in a bright layer of snow which reflects around 85 percent of incoming solar radiation back out to space.
The sea ice is covered in a bright layer of snow which reflects around 85 percent of incoming solar radiation back out to space.
The opposite occurs in the open ocean.
As the darkest natural surface on the planet, the ocean absorbs 90 percent of solar radiation.
When covered with sea ice, the Arctic Ocean acts like a large reflective blanket, reducing the absorption of solar radiation.
When covered with sea ice, the Arctic Ocean acts like a large reflective blanket, reducing the absorption of solar radiation.
As the sea ice melts, absorption rates increase, resulting in a positive feedback loop where the rapid pace of ocean warming further amplifies sea ice melt, contributing to even faster ocean warming.
This feedback loop is largely responsible for what is known as Arctic amplification, and is the explanation for why the Arctic is warming so much more than the rest of the planet.
 Icebergs are seen at the mouth of the Ilulissat Icefjord near Ilulissat, Greenland on September 16, 2021. (Hannibal Hanschke / Reuters File Photo)
Is Arctic amplification underestimated?
Numerical climate models have been used to quantify the magnitude of Arctic amplification.
They typically estimate the amplification ratio to be about 2.5, meaning the Arctic is warming 2.5 times faster than the global average.
Based on the observational record of surface temperatures over the last 43 years, the new study estimates the Arctic amplification rate to be about four.
Rarely do the climate models obtain values as high that.
Rarely do the climate models obtain values as high that.
This suggests the models may not fully capture the complete feedback loops responsible for Arctic amplification and may, as a consequence, underestimate future Arctic warming and the potential consequences that accompany that.
How concerned should we be?
Besides sea ice, the Arctic contains other climate components that are extremely sensitive to warming. If pushed too hard, they will also have global consequences.
One of those elements is permafrost, a (now not so) permanently frozen layer of the Earth’s surface. As temperatures rise across the Arctic, the active layer, the topmost layer of soil that thaws each summer, deepens.
This, in turn, increases biological activity in the active layer resulting in the release of carbon into the atmosphere.
Arctic permafrost contains enough carbon to raise global mean temperatures by more than 3 degrees C.
Arctic permafrost contains enough carbon to raise global mean temperatures by more than 3 degrees C.
Should permafrost thawing accelerate, there is the potential for a runaway positive feedback process, often referred to as the permafrost carbon time bomb.
The release of previously stored carbon dioxide and methane will contribute to further Arctic warming, subsequently accelerating future permafrost thaw.
A second Arctic component vulnerable to temperature rise is the Greenland ice sheet.
A second Arctic component vulnerable to temperature rise is the Greenland ice sheet.
As the largest ice mass in the northern hemisphere, it contains enough frozen ice to raise global sea levels by 7.4 meters if melted completely.

The Greenland ice sheet contains enough frozen ice to raise global sea levels by 7.4 meters if completely melted.
(MainlanderNZ / Shutterstock)
(MainlanderNZ / Shutterstock)
When the amount of melting at the surface of an ice cap exceeds the rate of winter snow accumulation, it will lose mass faster than it gains any.
When this threshold is exceeded, its surface lowers.
This will quicken the pace of melting, because temperatures are higher at lower elevations.
This feedback loop is often called the small ice cap instability.
This feedback loop is often called the small ice cap instability.
Prior research puts the required temperature rise around Greenland for this threshold to be be passed at around 4.5 degrees C above pre-industrial levels.
Given the exceptional pace of Arctic warming, passing this critical threshold is rapidly becoming likely.
Although there are some regional differences in the magnitude of Arctic amplification, the observed pace of Arctic warming is far higher than the models implied.
Although there are some regional differences in the magnitude of Arctic amplification, the observed pace of Arctic warming is far higher than the models implied.
This brings us perilously close to key climate thresholds that if passed will have global consequences. As anyone who works on these problems knows, what happens in the Arctic doesn’t stay in the Arctic.
Links :
- Scientific American : The Arctic Is Warming Four Times Faster Than the Rest of the Planet
- Wired : Why the Arctic Is Warming 4 Times as Fast as the Rest of Earth
- Euronews : Meet the scientists trying to find out why the Arctic is warming faster than the rest of the world
- SciencesDaily : Arctic temperatures are increasing four times faster than global warming
Thursday, August 18, 2022
The Gulf Stream continues to slow down, new data shows, with freshwater creating an imbalance in the current, pushing it closer to a Collapse point
The Gulf Stream has weakened substantially in the past decades, as revealed by the latest data and new studies.
Weather in the United States and Europe depends strongly on this ocean current, so it’s important we understand the ongoing changes and what they mean for our weather now and in the near future.
There is growing awareness that the Gulf Stream and the overall Atlantic circulation are nearing a critical point of collapse.
As you will see, there is an increased influx of freshwater from the melting sea ice, that can be linked to these changes.
We will look at the latest data on the Gulf Stream, where and how it flows, how it changes our weather, and why is it really collapsing so strongly in the last decades.
And we will show you what the movie “The Day After Tomorrow” actually got right when collapsing the Gulf Stream.

A buckle in the jet stream helps explain why parts of Western Europe are experiencing a respite from the summer heat right now.
The cooler air is able to move south and acts as a trigger for thunderstorms.
source : @ScottDuncanWX
WHAT IS THE GULF STREAM
First, what is actually the Gulf Stream, where can we find it, and what is all the big deal about it?
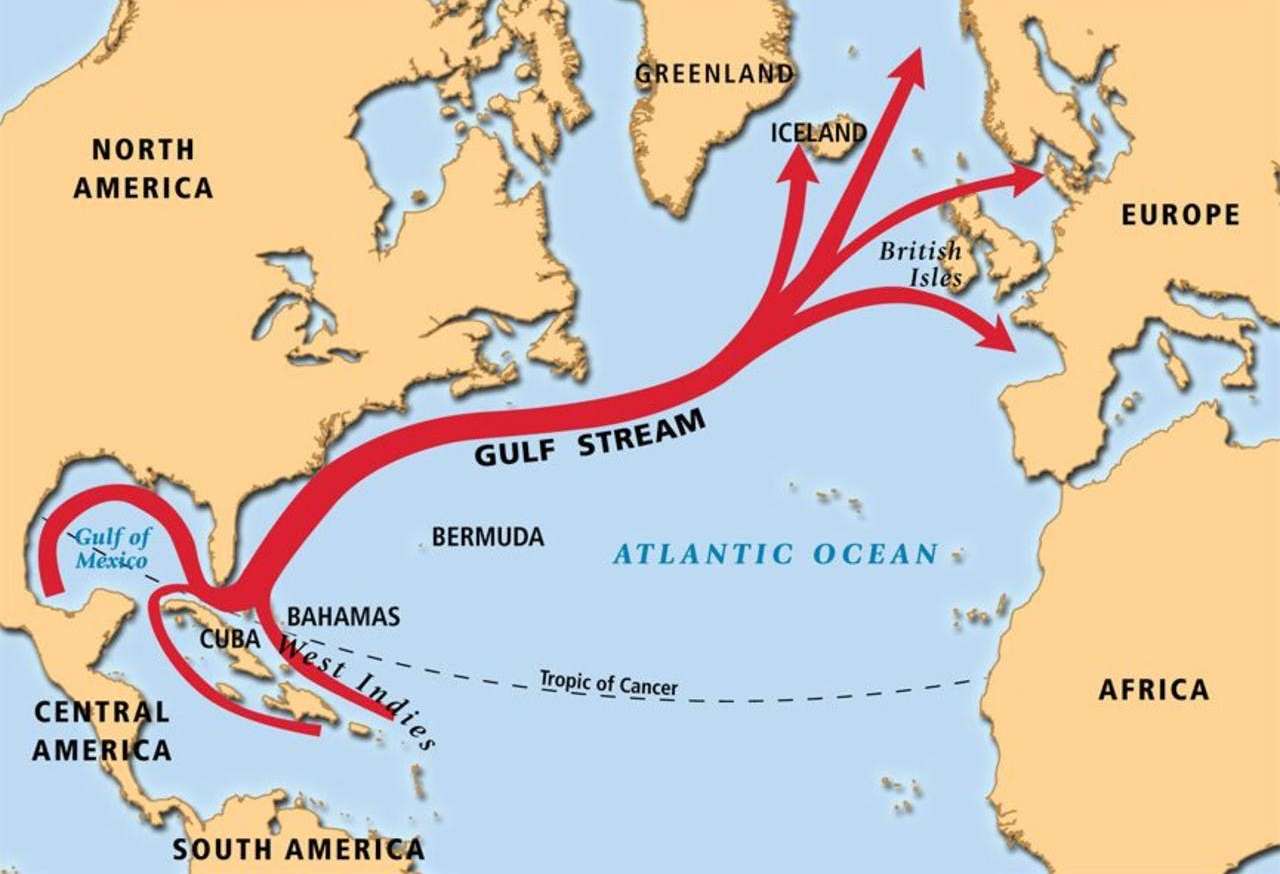
The Gulf Stream is a powerful ocean current that brings warmer waters up from the Gulf of Mexico into the North Atlantic Ocean.
It extends all the way up along the eastern coast of the United States, where it starts to turn towards northern Europe.
The image below shows a rough schematic of the Gulf stream and where it flows across the North Atlantic.
It does not actually flow in such a nice straight line, but as you will see, it is very complex and full of motion and dynamics.
This strong current of warm water directly influences the climate of Florida.
Compared to other southeastern states, it keeps temperatures in Florida warmer in the winter and cooler in the summer.
Since the Gulf Stream also extends towards Europe, it helps to warm the western European countries, having a major impact on the regional climate.
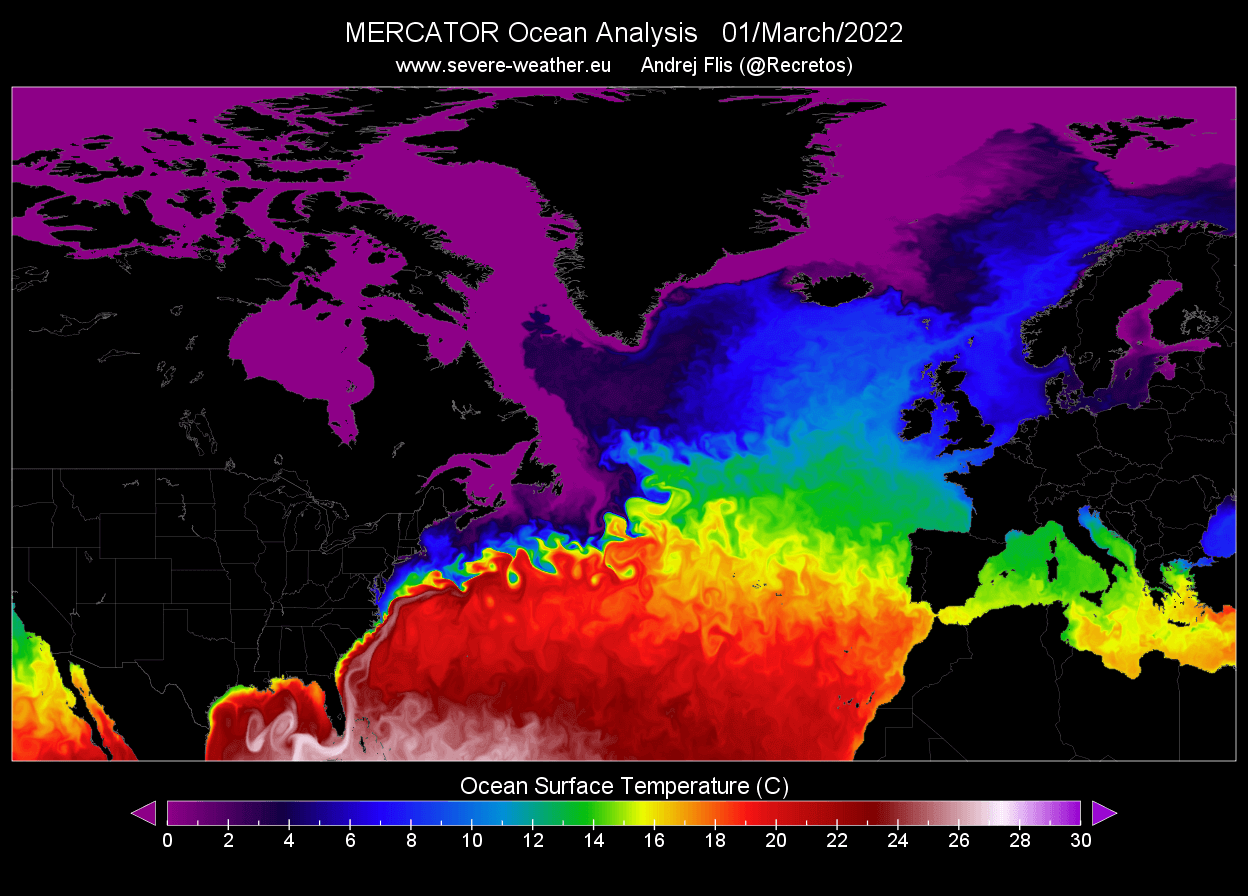
The stream itself can be best seen if we look at the ocean temperatures and the surface current speed.
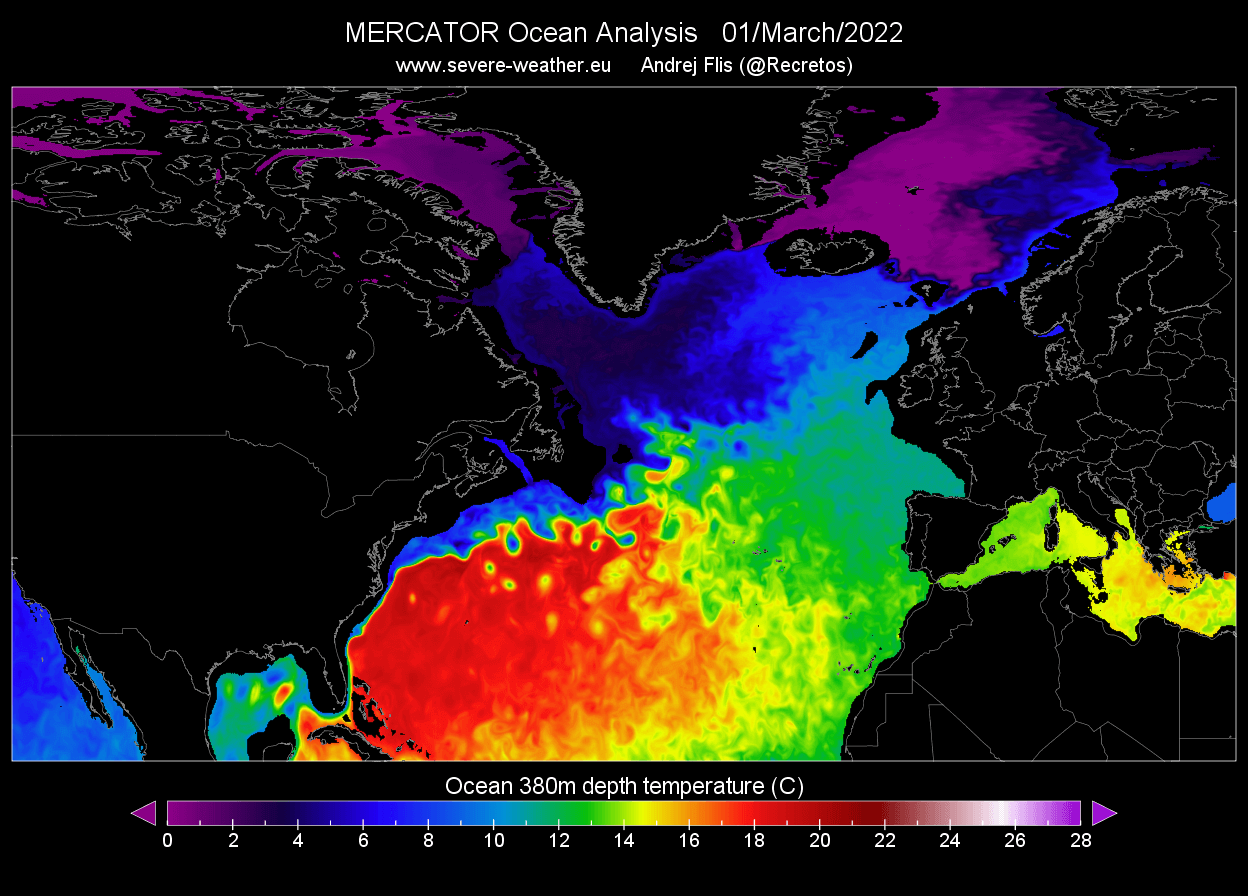
In the image below you can see the latest ocean surface temperature.
Notice the warm stream of water moving up along the eastern coast of the United States, extending far into the North Atlantic.
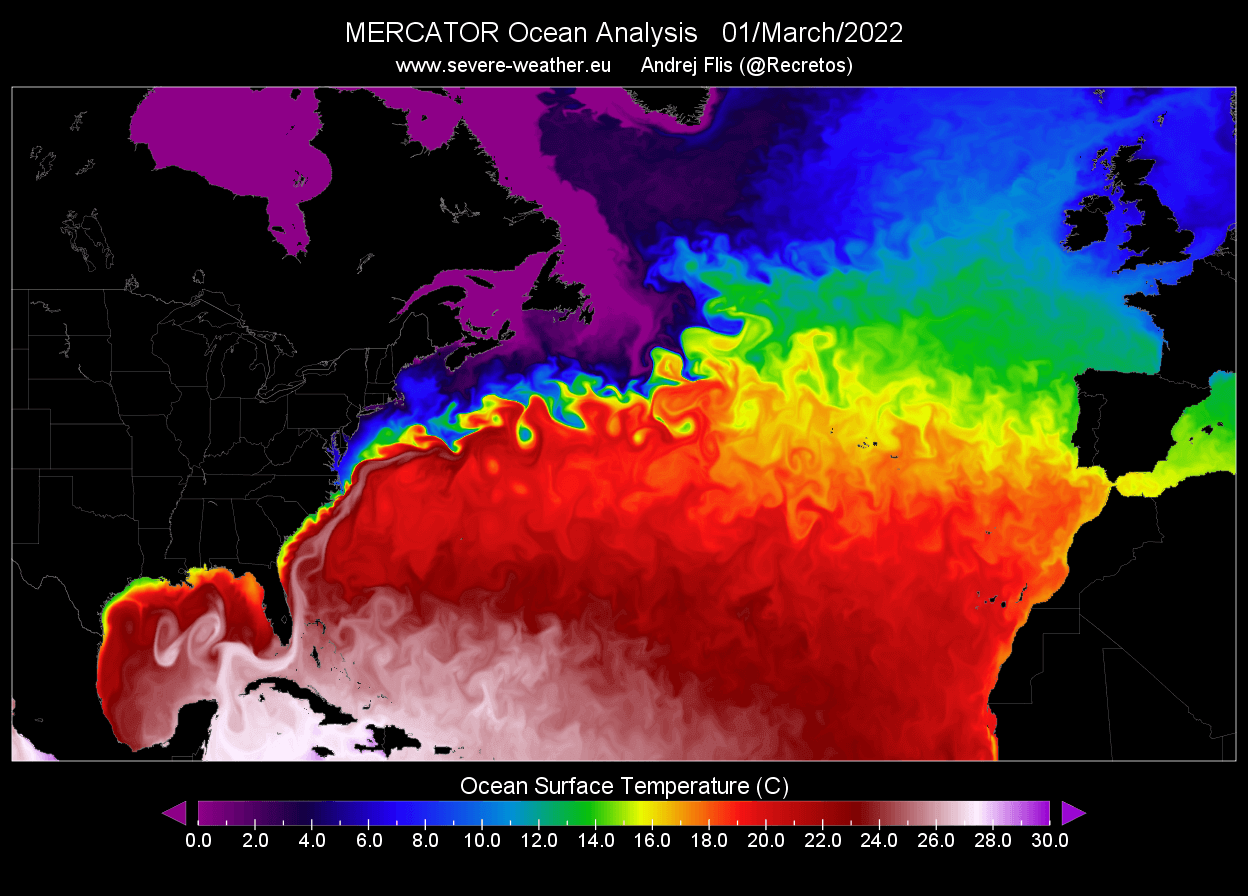
This is the Gulf Stream at its best, transporting essential warm waters further up towards the North.
In contrast, you can see the cold Labrador Current flowing down along the east Canadian coast.
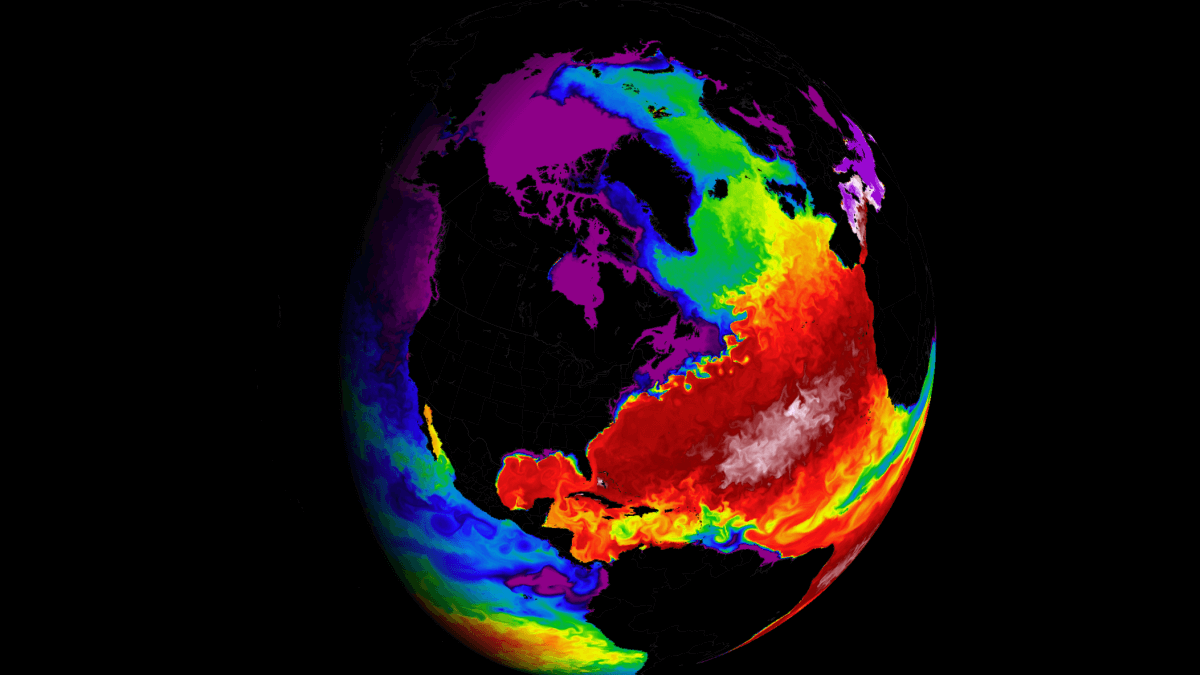
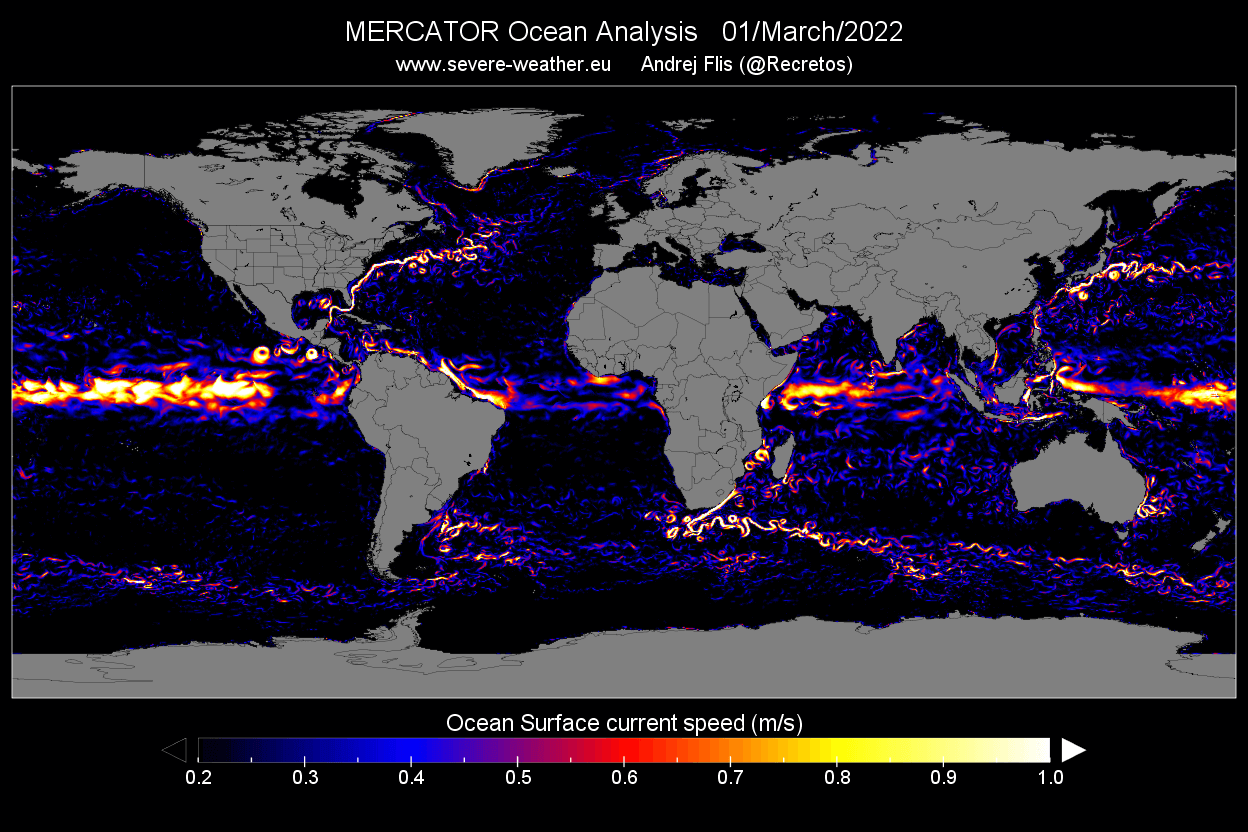
The Gulf Stream is perhaps seen even better if we look at the movement and speed of the ocean surface currents.
In the image below you can see the ocean surface current speed, where the Gulf Stream stands out and can be seen in its most raw shape and form.
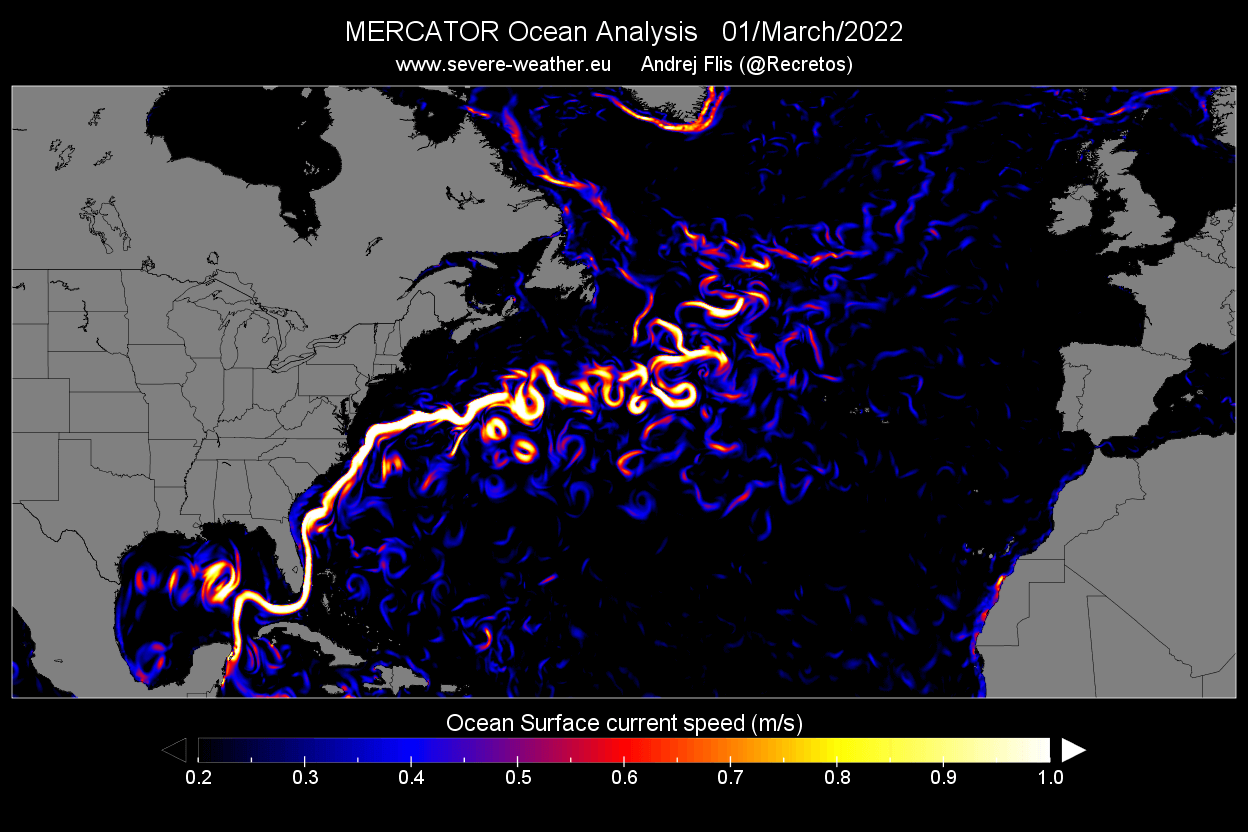
This ocean current does not flow in a straight line, as seen in many graphics.
It is actually very complex, with a lot of dynamics and swirling across the North Atlantic.
It has a lot of smaller swirls of water, both warm and cold.
This is very similar to the atmospheric jet stream.
Looking at the entire world, we can see that the Gulf Stream is not the only one of its kind.
There are many areas with persistent ocean circulation.
Most notable is perhaps the Japan Current (Kuroshio), which is very similar to the Gulf Stream in its activity.
In contrast, you can see the cold Labrador Current flowing down along the east Canadian coast.
The Gulf Stream is perhaps seen even better if we look at the movement and speed of the ocean surface currents.
In the image below you can see the ocean surface current speed, where the Gulf Stream stands out and can be seen in its most raw shape and form.
This ocean current does not flow in a straight line, as seen in many graphics.
It is actually very complex, with a lot of dynamics and swirling across the North Atlantic.
It has a lot of smaller swirls of water, both warm and cold.
This is very similar to the atmospheric jet stream.
Looking at the entire world, we can see that the Gulf Stream is not the only one of its kind.
There are many areas with persistent ocean circulation.
Most notable is perhaps the Japan Current (Kuroshio), which is very similar to the Gulf Stream in its activity.
NORTH ATLANTIC OCEAN CURRENTS
The larger circulation system that homes the Gulf Stream, is called the Atlantic Meridional Overturning Circulation (AMOC).
The AMOC is a large system of ocean currents in the Atlantic Ocean, driven by differences in temperature and salt content, which affects its density.
The Gulf stream is just is the surface part of the AMOC in the North Atlantic.
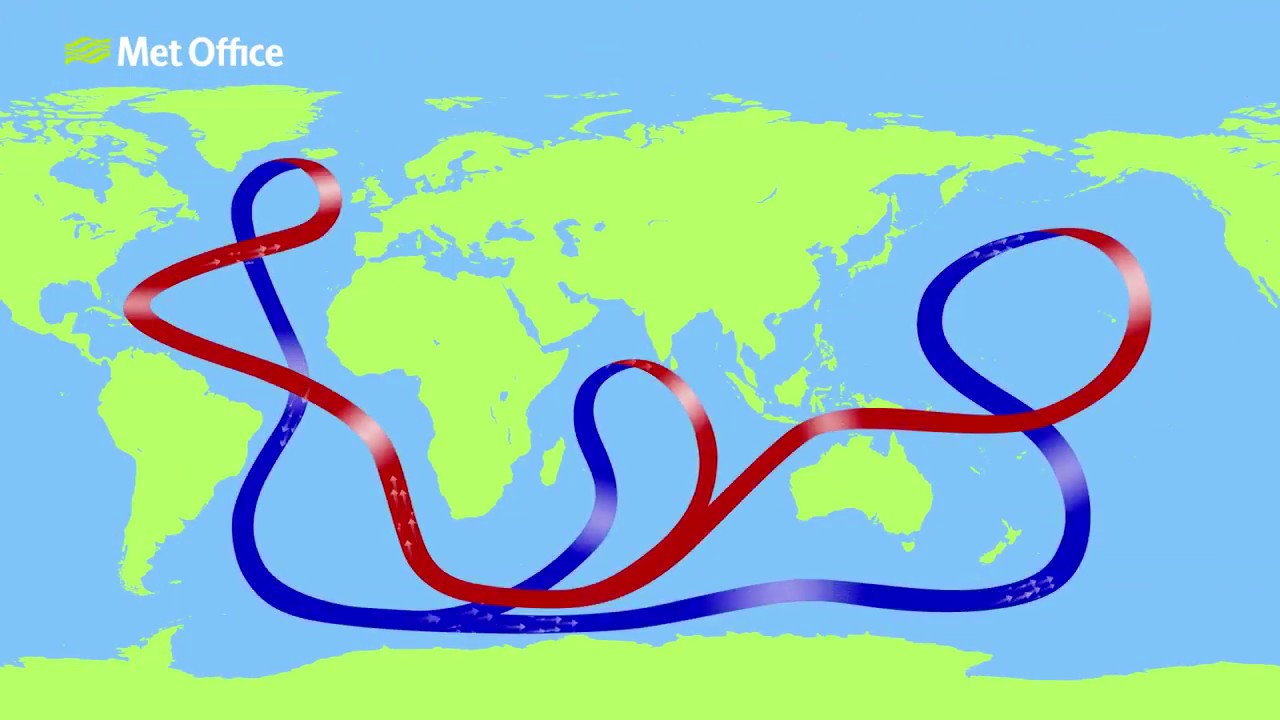
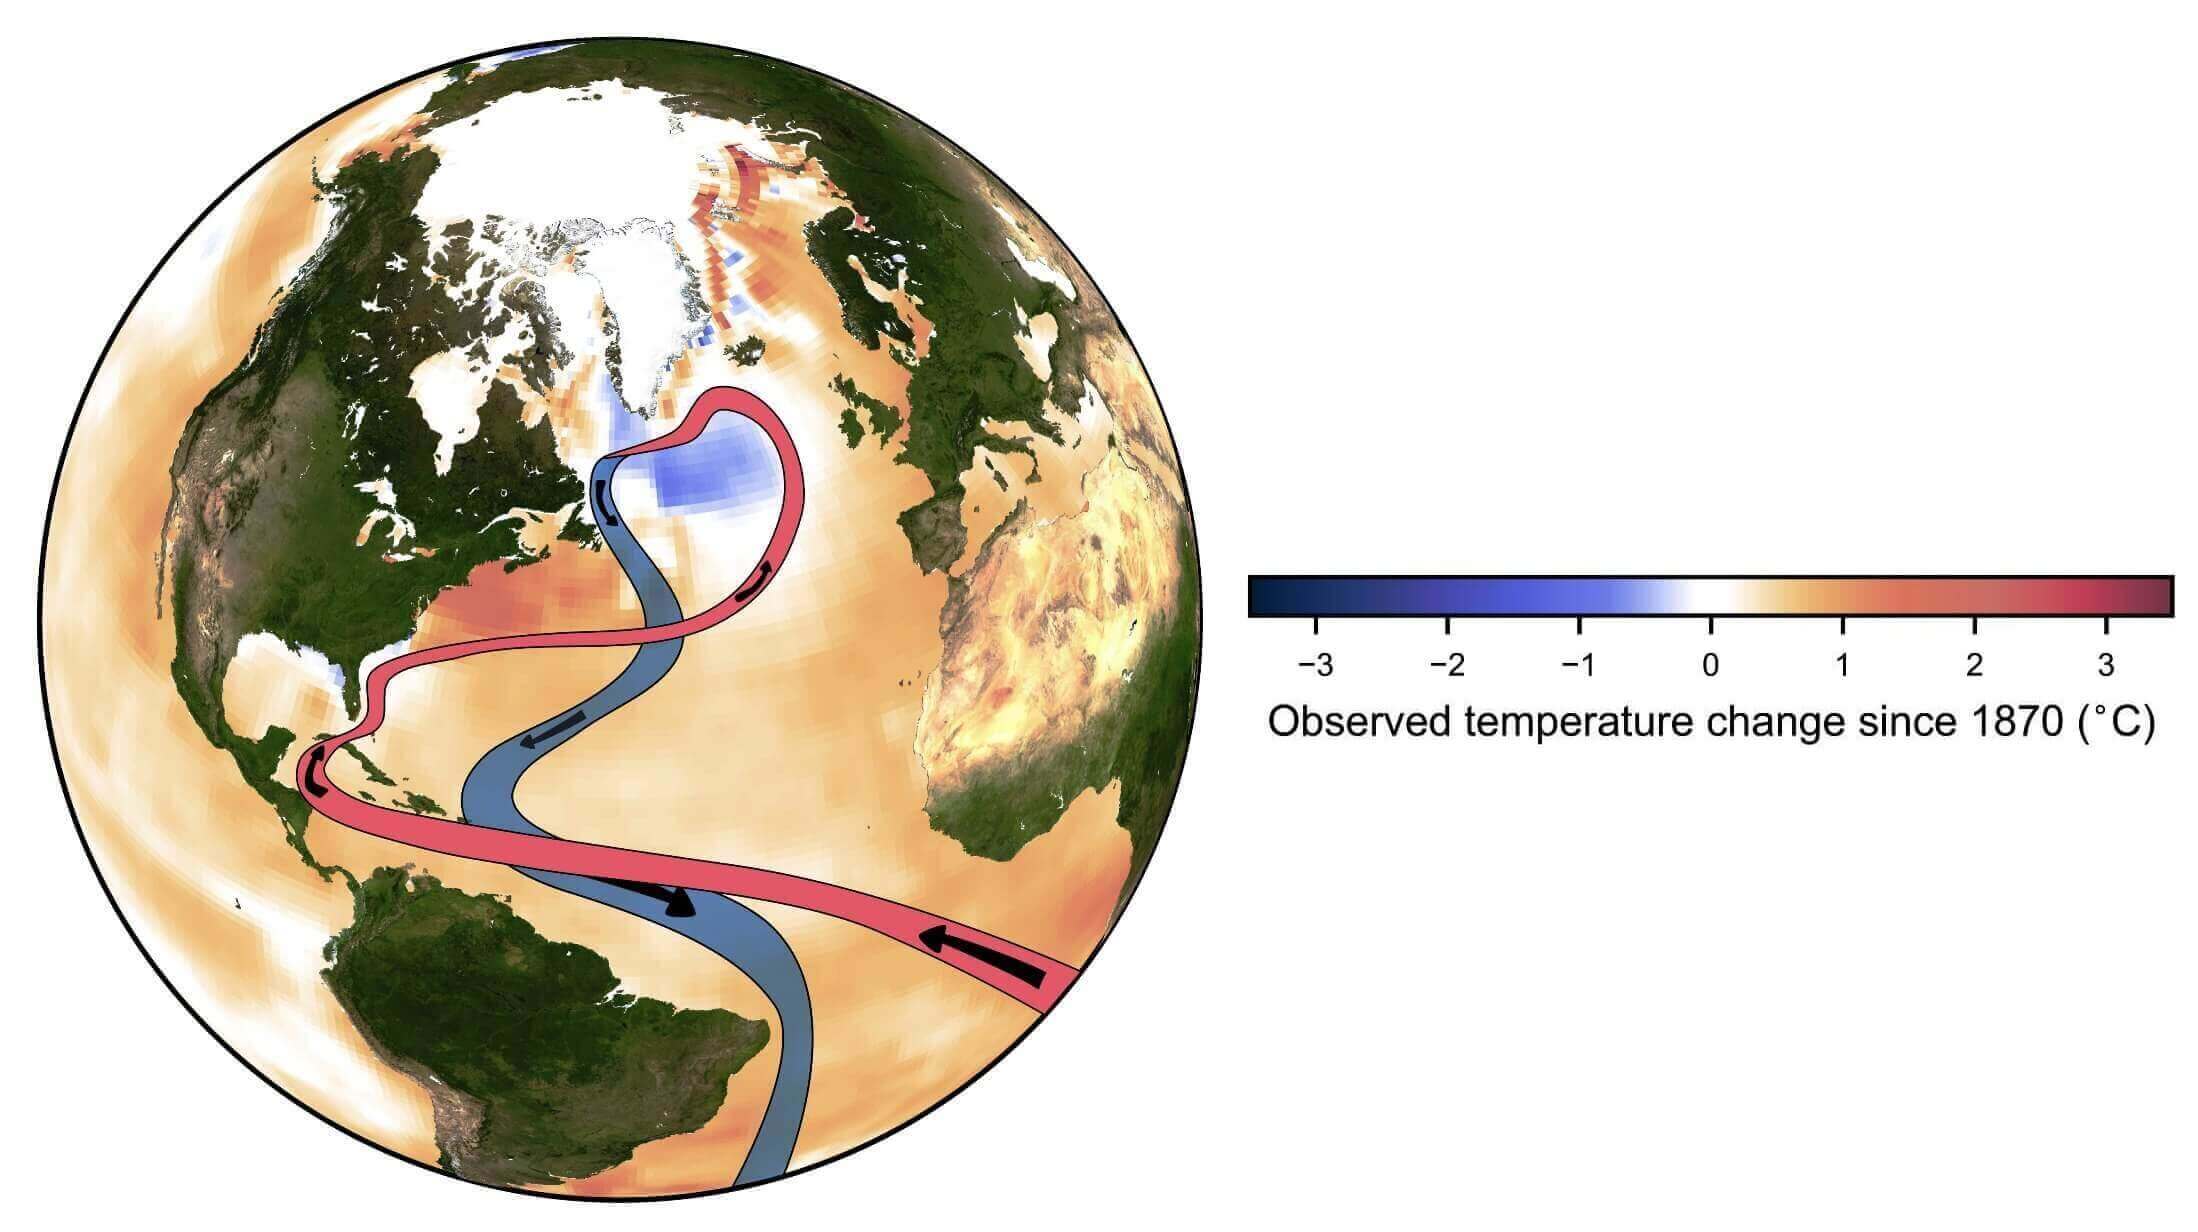
The image below from the UK Met Office roughly shows the entire global ocean circulation.
It has many different names, but mostly it’s called the Global Conveyor Belt or the Thermohaline circulation.
AMOC is the Atlantic part of this global circulation.
But what is actually driving the ocean currents in the North Atlantic?
As the Gulf Stream transports warmer waters northwards, it gradually cools, releasing a large part of the heat.
Evaporation also occurs along the way, increasing the salt concentration in the ocean.
Lower temperature and a high salt content make the water denser and heavier.
This means that it will sink down deeper into the ocean.
Sinking water causes movement and momentum, pulling down more water from the surface, and creating a stable flow.
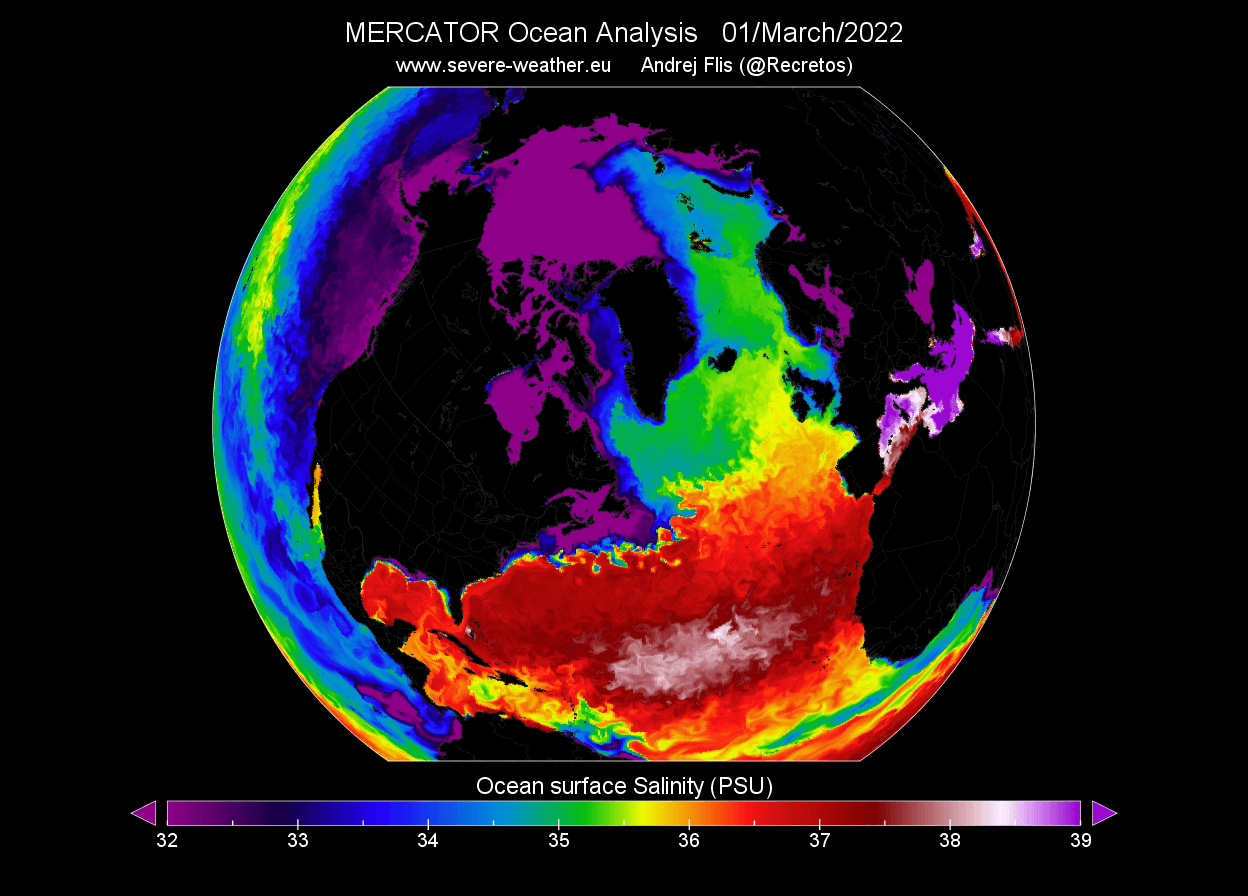
The image below shows ocean surface salinity or the amount of salt in the water.
Higher the number, the saltier the water.
Above 35, we still have salty waters, so as the water cools, it gets denser (heavier), and starts to sink.
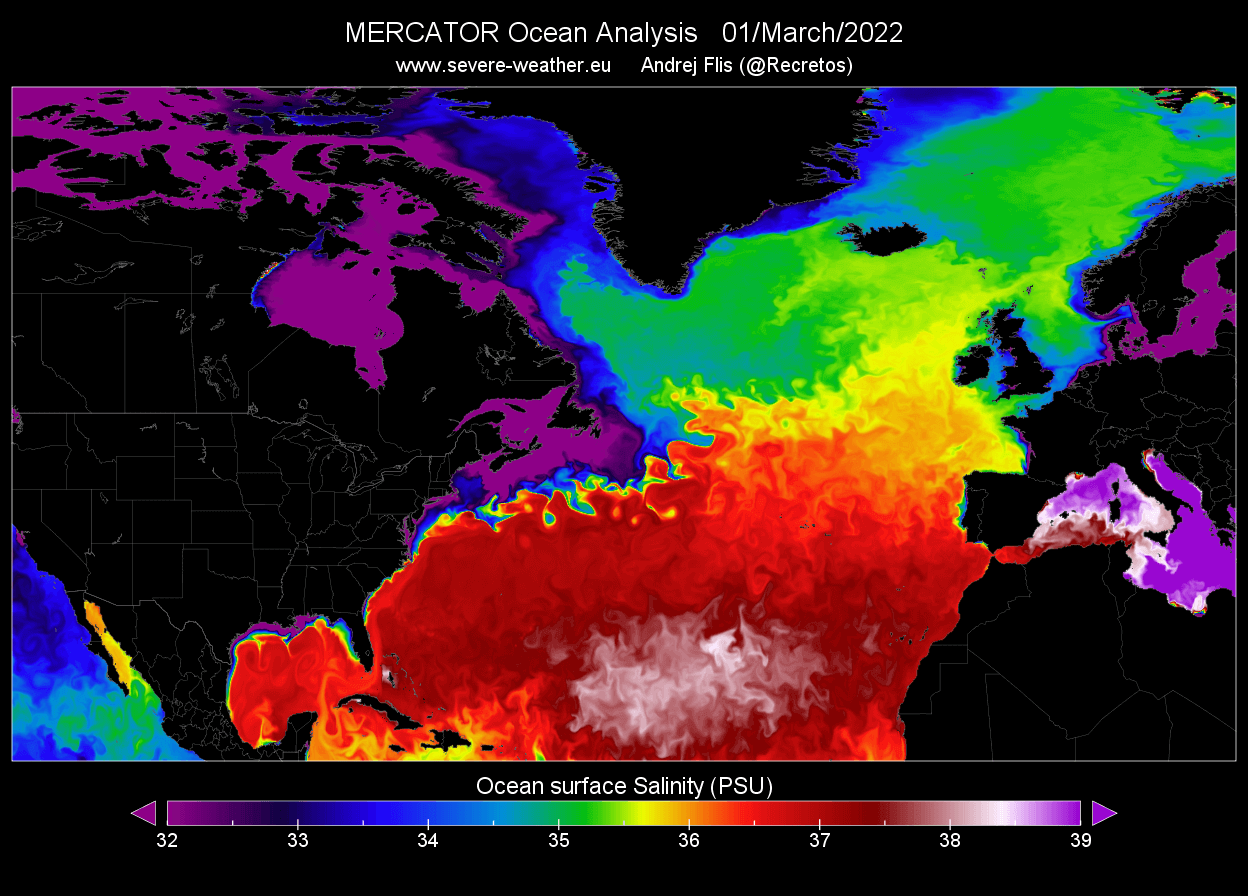
The cold, dense water slowly flows southwards, several kilometers below the ocean surface.
Eventually, it gets pulled back to the surface and warms in a process called “upwelling”, completing the entire circulation circle.
The reason why this is important is that the AMOC is an integral part of the weather and climate in the Northern Hemisphere.
It transports a lot of warmer waters and energy toward the northern regions.
The image below shows the outline of the North Atlantic part of the AMOC.
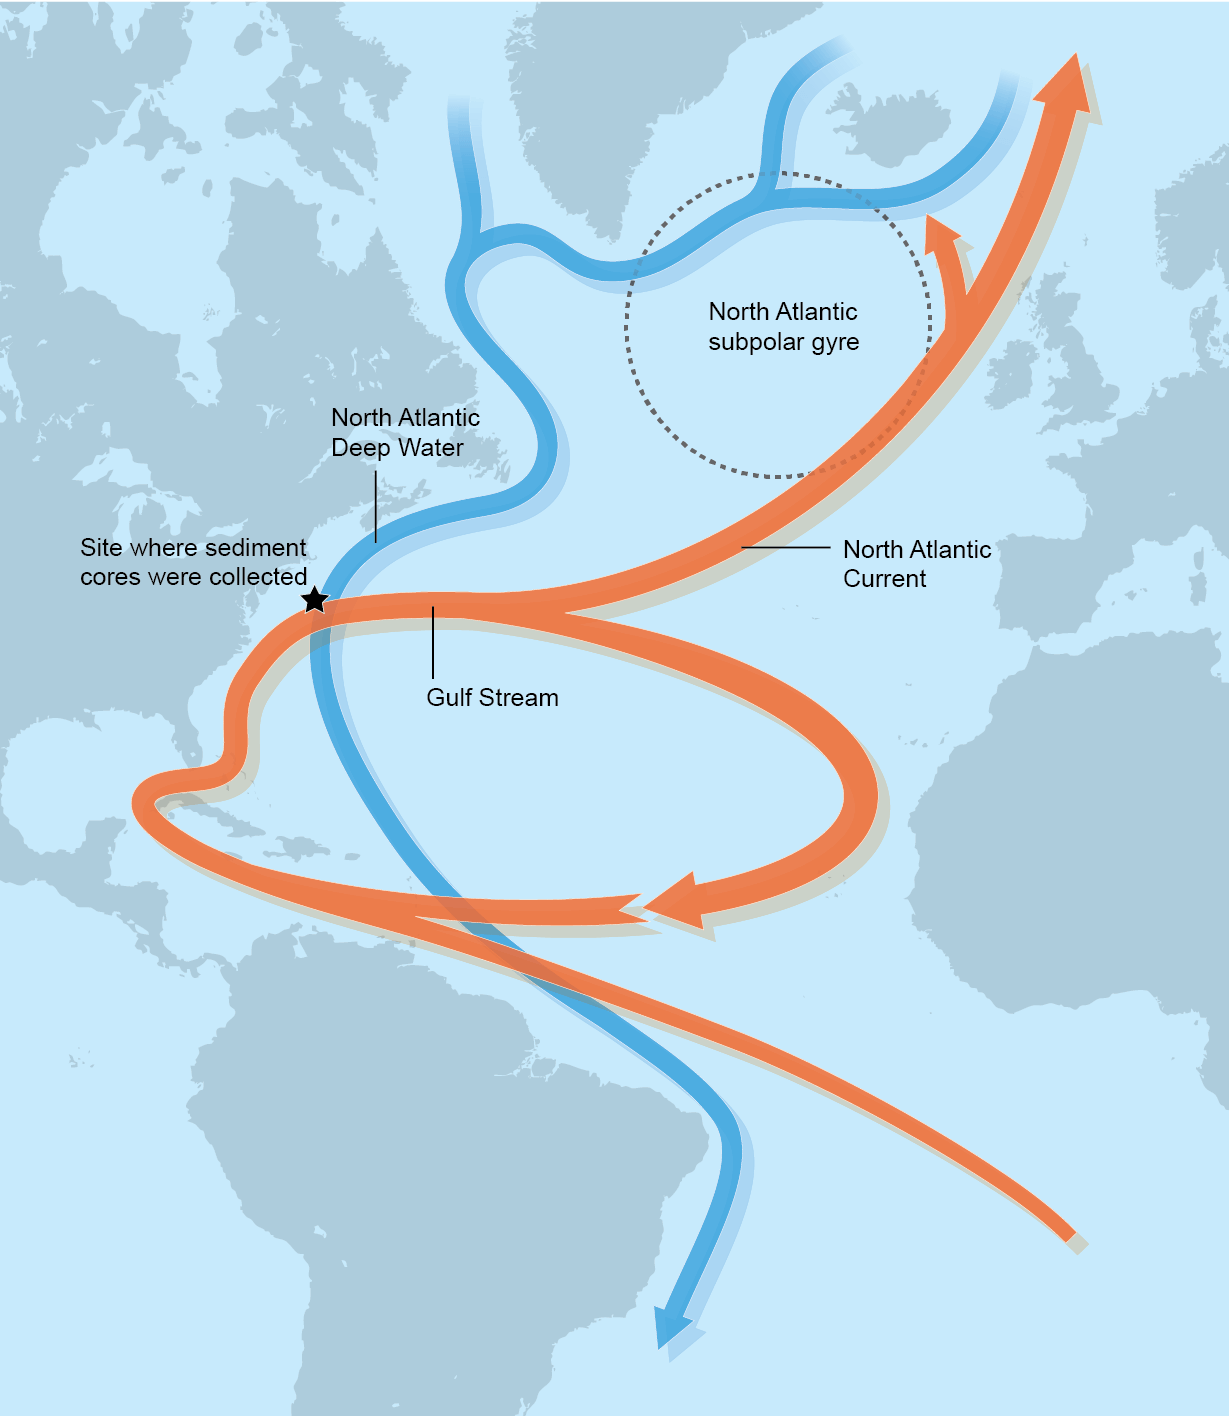
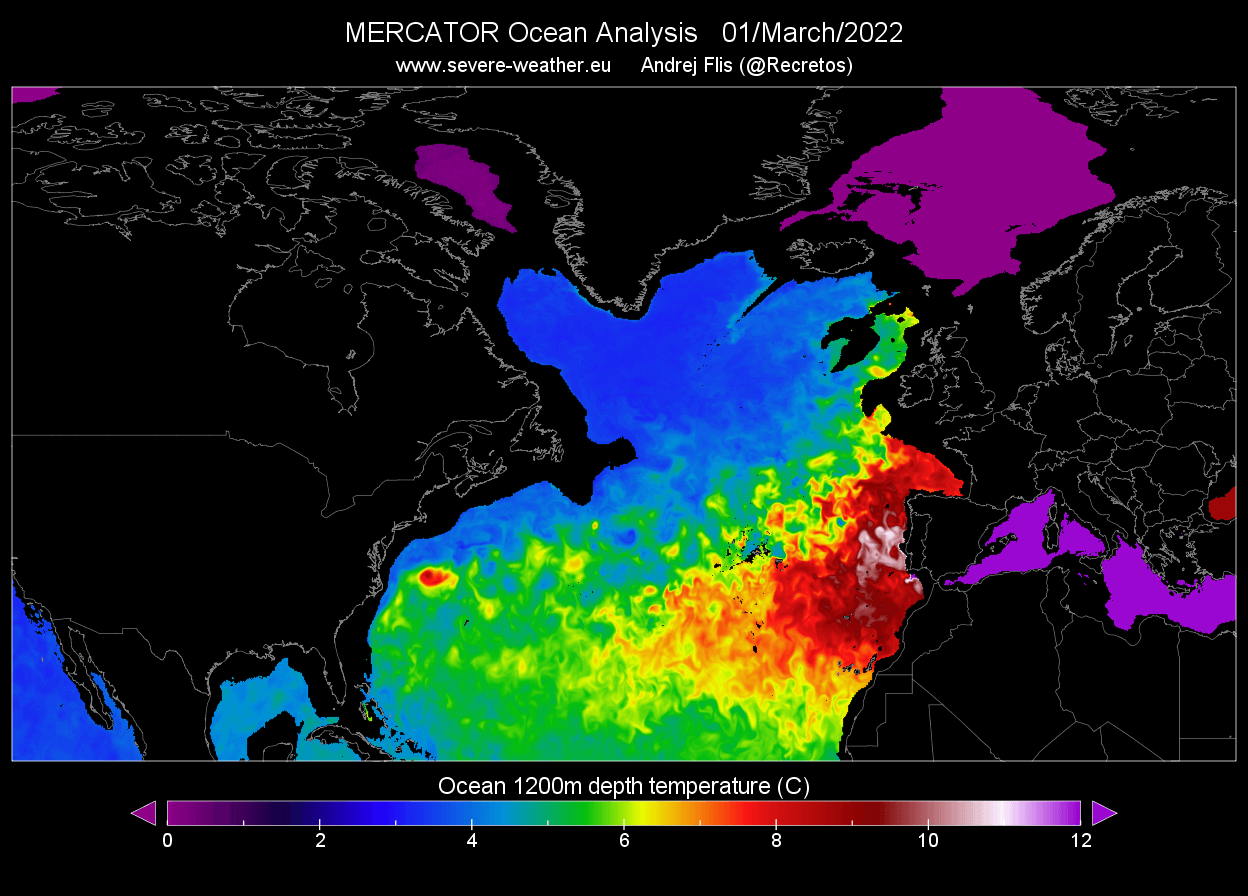
If we look deeper down below the surface, at around 380 meters (1240ft), the Gulf Stream is still nicely seen.
But you can also better see the colder waters south of Greenland, where the ocean current sinks down as it gets denser.
Eventually, it gets pulled back to the surface and warms in a process called “upwelling”, completing the entire circulation circle.
The reason why this is important is that the AMOC is an integral part of the weather and climate in the Northern Hemisphere.
It transports a lot of warmer waters and energy toward the northern regions.
The image below shows the outline of the North Atlantic part of the AMOC.
If we look deeper down below the surface, at around 380 meters (1240ft), the Gulf Stream is still nicely seen.
But you can also better see the colder waters south of Greenland, where the ocean current sinks down as it gets denser.
Still going further down, to around 1200 meters (4000ft), we reach the very bottom of the Gulf Stream.
We can hardly see the warm stream standing out, as we have warmer ocean temperatures further towards the east, around the European continental shelf.
GULF STREAM AND WINTER WEATHER
We produced a special graphic below, which shows why the Gulf Stream and the AMOC generally are so important.
The image shows the average January surface temperature, in the past 42 years.
What you can see is the large temperature difference between the far North Atlantic and Canada for example.

Looking at the same latitude line, for example, 60 degrees North, along the tip of Greenland.
You can see that there is a temperature difference of almost 30 degrees celsius between the North Atlantic and southern Canada.
The difference in winter climate between the United Kingdom and southern Canada for example is really big.
This is in large part because of the warm Gulf Stream.
It brings warmer waters towards the North, keeping the climate milder in Europe.
Since a lot of our readers are more familiar with the Fahrenheit temperature scale, we produced the same graphic, but in Fahrenheit degrees.
You can see the large difference of 50-60 degrees F, between the far North Atlantic and southern Canada for example.
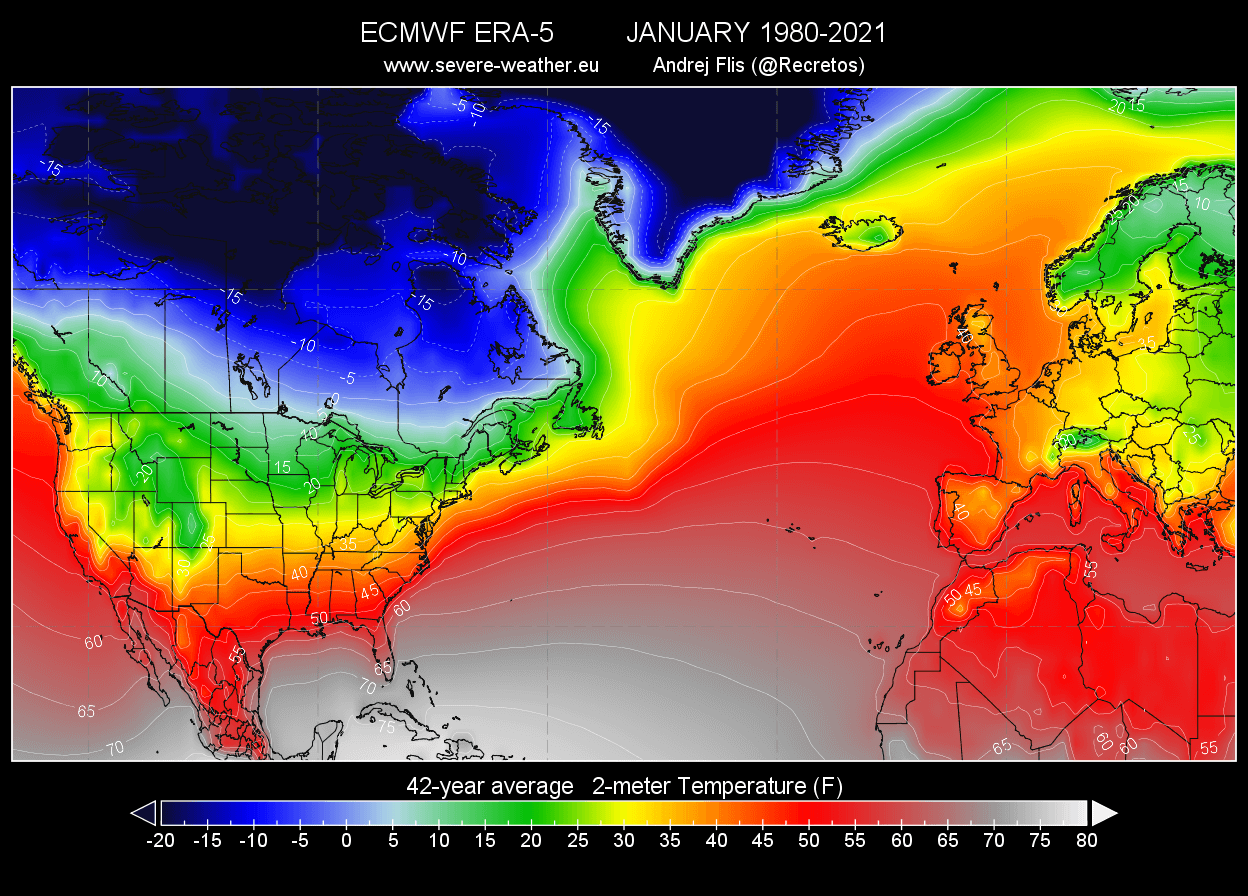
You can also see the warmer climate along the east coast of the United States.
This is also partially affected by the warm ocean current.
But as you will see further down in the article, the Gulf Stream can also have a negative impact on weather in the United States.
But first, focusing on the far North Atlantic part of the AMOC, we can see that it is quite complex.
Warmer waters are being transported far beyond the British Isles and Iceland, reaching deep into the Arctic Ocean.
If you look at the actual ocean temperatures from a month ago, you can see positive temperatures of 6-10 degrees C (43-50 degrees F) reaching into the Polar Circle.
Violet colors are indicating sea ice or very cold waters, near freezing.
This active water transport system is one of the main reasons that the North polar circle is mainly ice-free in this region.
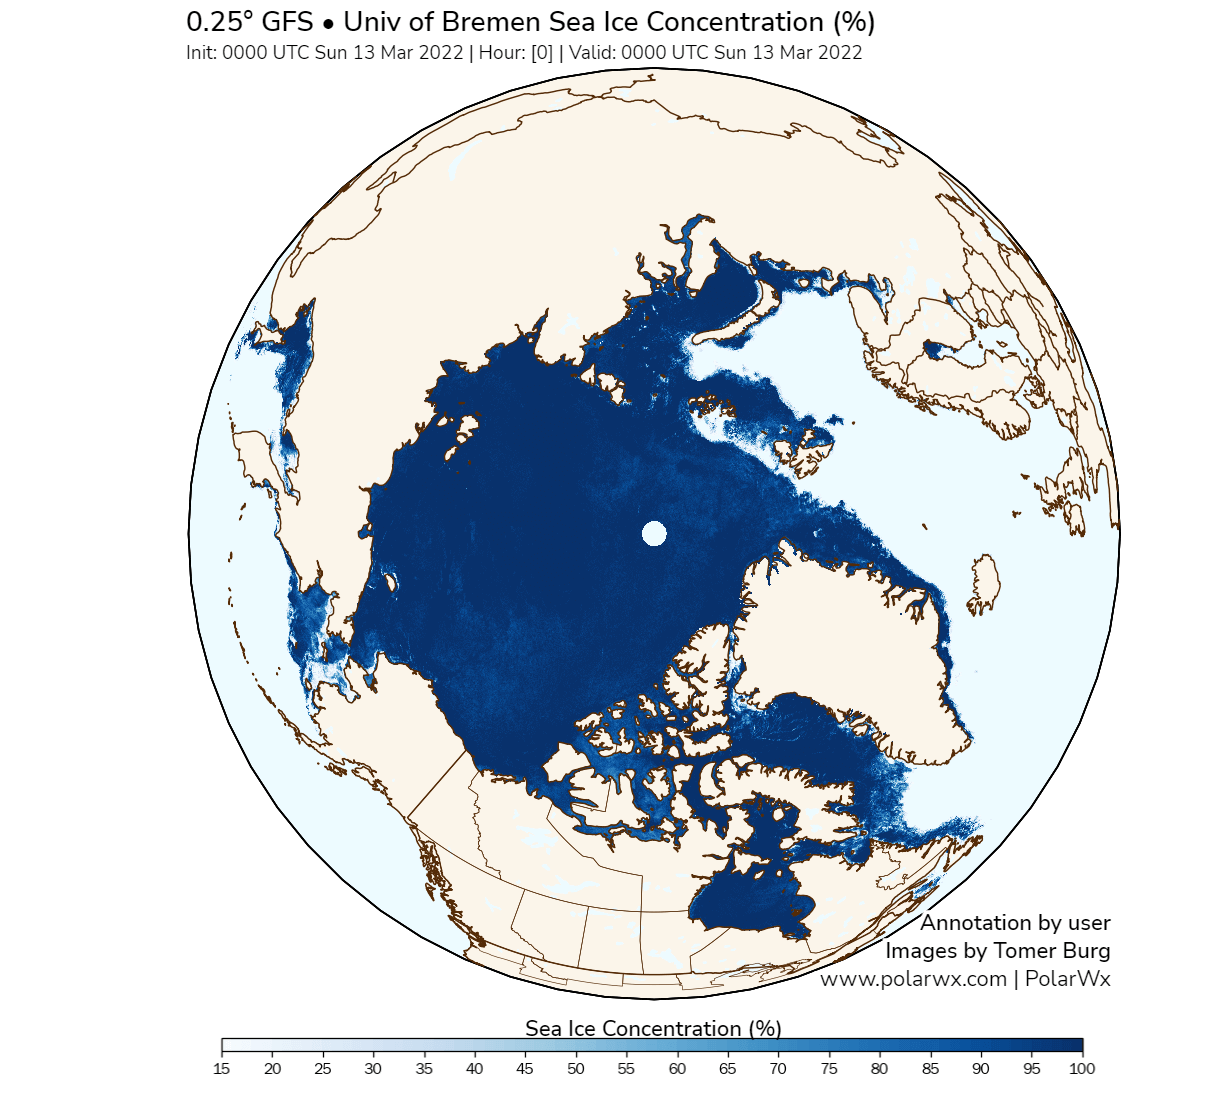
That is nicely seen in the sea-ice concentration analysis below, how the region connecting to the North Atlantic is ice-free.
That is due to the ocean temperatures being too warm to allow freezing.
The active ocean currents are constantly delivering relatively warmer waters, preventing thick sea ice to form.
GULF STREAM WEAKENING AND COLLAPSE
There is a theory that the Gulf Stream might shut down at some point, making the movie “The day after tomorrow” a reality.
In that famous movie, the North Atlantic ocean circulation has completely shut down, pushing the world into a new ice age.
The movie is not really scientifically accurate, as these global changes do not happen in just three days.
Even tho the reality is somewhat different than the movie, we will look at the state of the Gulf Stream, which shows that this ocean current is indeed weakening.
Going directly to the main point, we have a graphic below, which shows the strength of the AMOC over the past centuries.
Of course, these are reconstructions, based on “proxy data”, like coral data, ocean sediments, and land-based data.
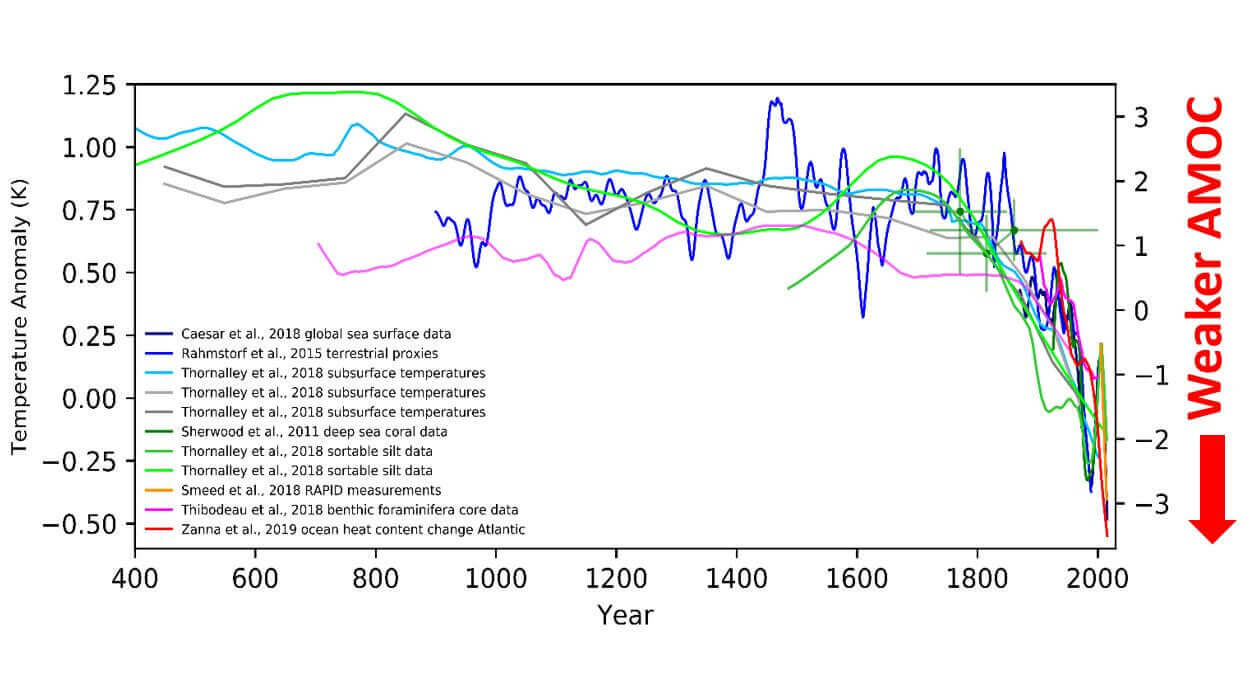
The most important takeaway is that we can see an intense weakening of the AMOC in at least the past 200 years.
This proxy data agrees with the modern instrument observations.
That gives it good confidence for the historical reconstruction part.
Most often, the ocean temperatures are being used to determine the state/strength of the Gulf Stream and the entire North Atlantic current circulation.
The image below shows the North Atlantic ocean divided into two areas.
On the eastern coast of the United States, we have the warm Gulf Stream area.
But in the subpolar North Atlantic, we have the blue area, where the Gulf Stream releases its heat and sinks down into the depths.
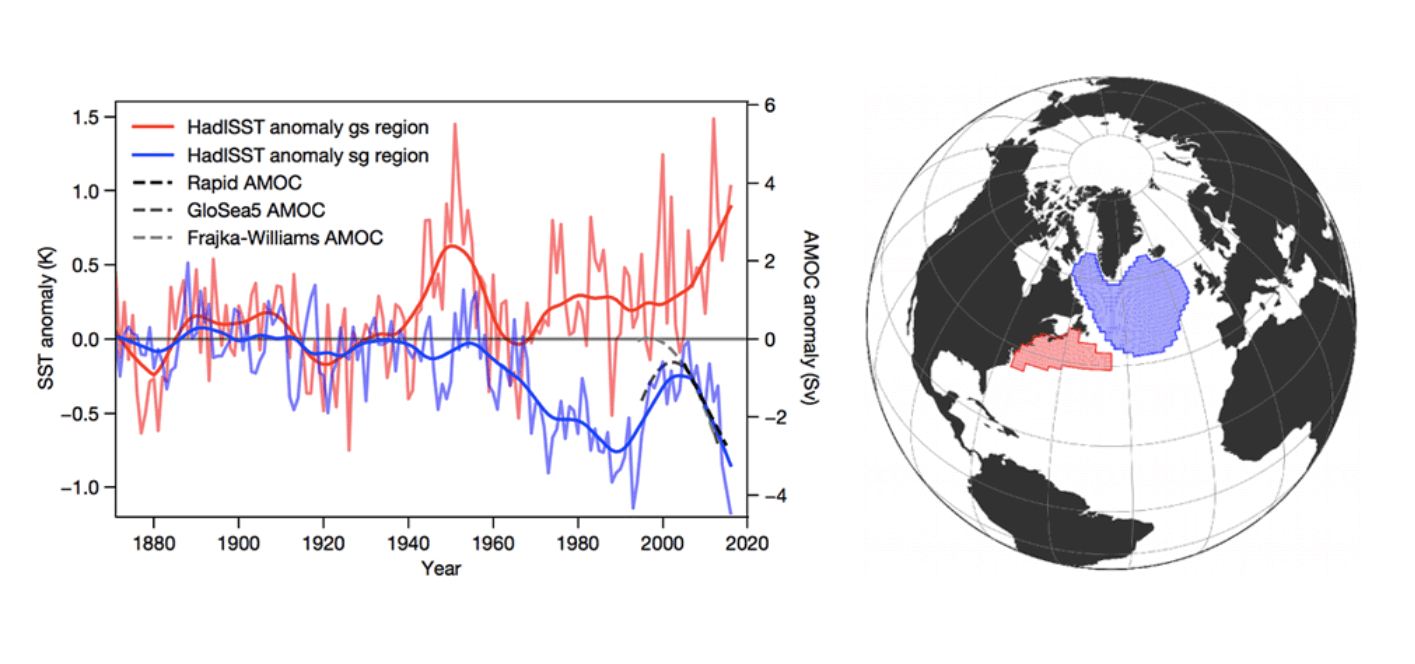
The graphs on the left show temperature progression over time.
You can see that the Gulf Stream area is warming, while the North Atlantic is actually cooling over time.
The relative difference between these two areas is typically used as an estimate of the strength of the AMOC.
We produced a graph, which actually shows the relative difference between these two areas.
It is nicely seen that since at least the 1900s, there was a slow but consistent downward trend.
Especially in the past 40 years, we can see a stronger negative difference in these two areas, indicating a likely further weakening of the AMOC.
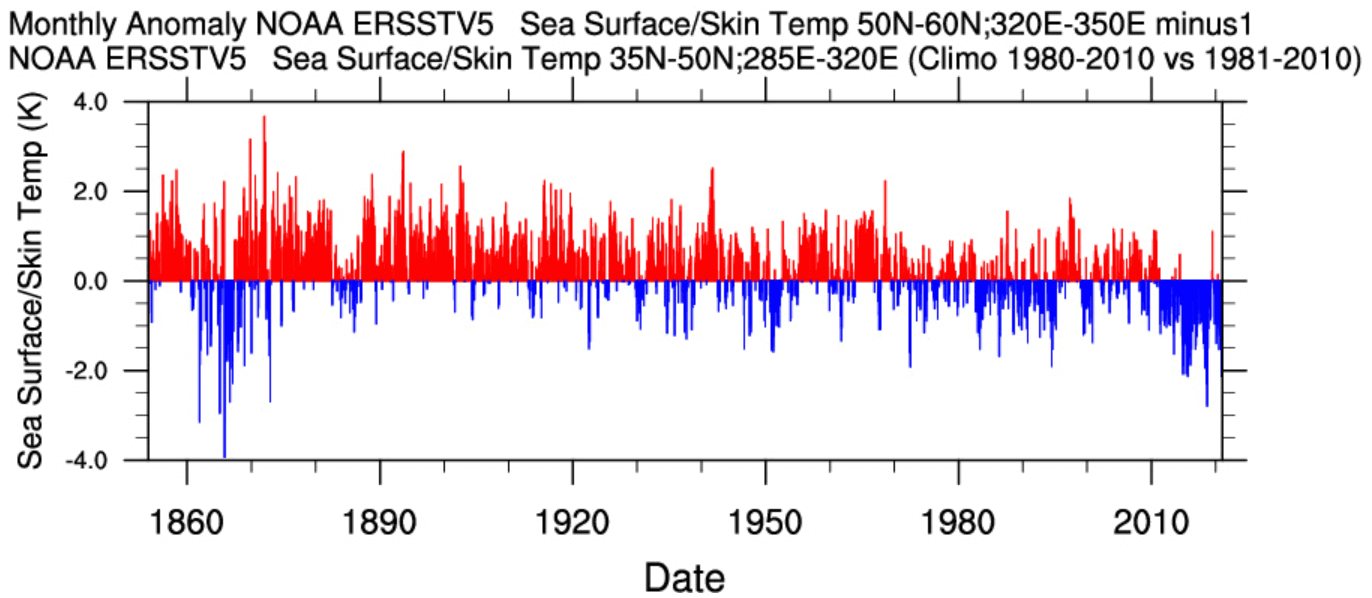
The data basis for this graph comes from the NOAA’s ERSSTv5 dataset.
It is a combination of observations and reconstructions, taking all the available data and modern techniques, to reconstruct the sea surface temperatures back to 1854.
The data is of course not 100% accurate that far back.
But is proven to agree very well with modern observations, giving confidence also for the historical periods.
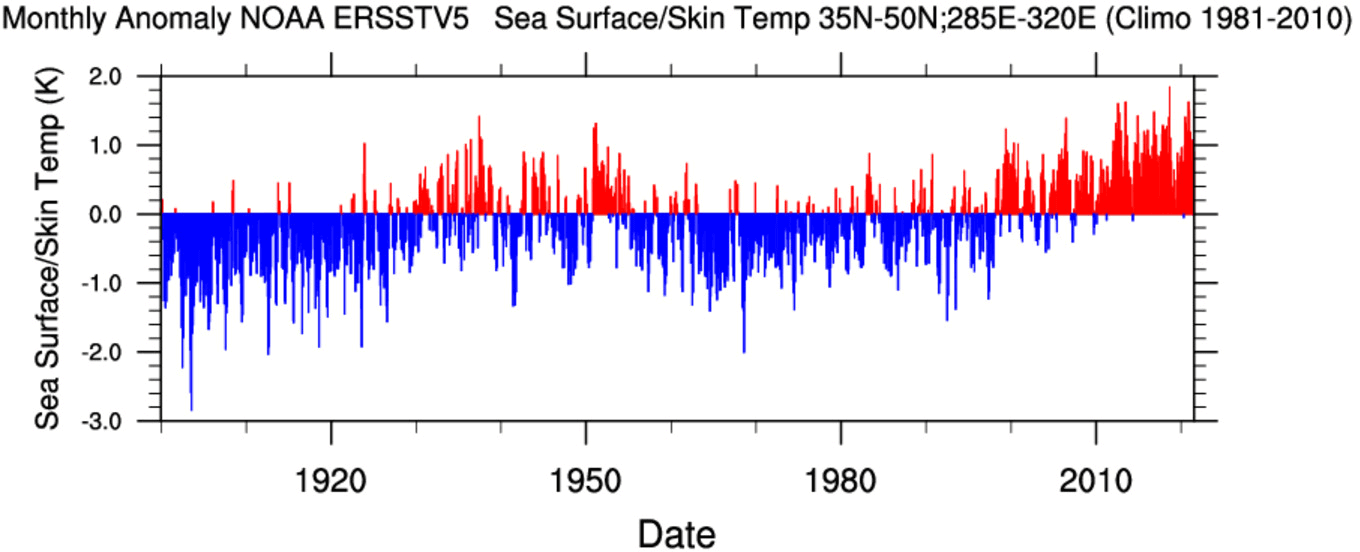
We produced another graph, this time for the warm Gulf Stream part along the northeastern coast of the United States.
It shows the strong temperature increase in this region, especially in the past 60 years.
It shows the ocean temperatures increasing in the Gulf Stream area.
You can see that the Gulf Stream area is warming, while the North Atlantic is actually cooling over time.
The relative difference between these two areas is typically used as an estimate of the strength of the AMOC.
We produced a graph, which actually shows the relative difference between these two areas.
It is nicely seen that since at least the 1900s, there was a slow but consistent downward trend.
Especially in the past 40 years, we can see a stronger negative difference in these two areas, indicating a likely further weakening of the AMOC.
The data basis for this graph comes from the NOAA’s ERSSTv5 dataset.
It is a combination of observations and reconstructions, taking all the available data and modern techniques, to reconstruct the sea surface temperatures back to 1854.
The data is of course not 100% accurate that far back.
But is proven to agree very well with modern observations, giving confidence also for the historical periods.
We produced another graph, this time for the warm Gulf Stream part along the northeastern coast of the United States.
It shows the strong temperature increase in this region, especially in the past 60 years.
It shows the ocean temperatures increasing in the Gulf Stream area.
Now, the next graphics show an even better example of the changing Gulf Stream.
First, we have a computer model, simulating a weakening of the AMOC.
We can see the warming of the Gulf Stream region along the east coast of the United States, and cooling in the far North Atlantic.

The second image below shows the actual ocean temperature trends over time.
It looks practically the same as the model simulation of a weakening AMOC.
This supports the fact that the AMOC is indeed losing its strength, perhaps at a faster rate than first anticipated.
First, we have a computer model, simulating a weakening of the AMOC.
We can see the warming of the Gulf Stream region along the east coast of the United States, and cooling in the far North Atlantic.
The second image below shows the actual ocean temperature trends over time.
It looks practically the same as the model simulation of a weakening AMOC.
This supports the fact that the AMOC is indeed losing its strength, perhaps at a faster rate than first anticipated.
This temperature signature of the warm Gulf Stream area and cold North Atlantic is one of the strongest indicators that the AMOC is weakening.
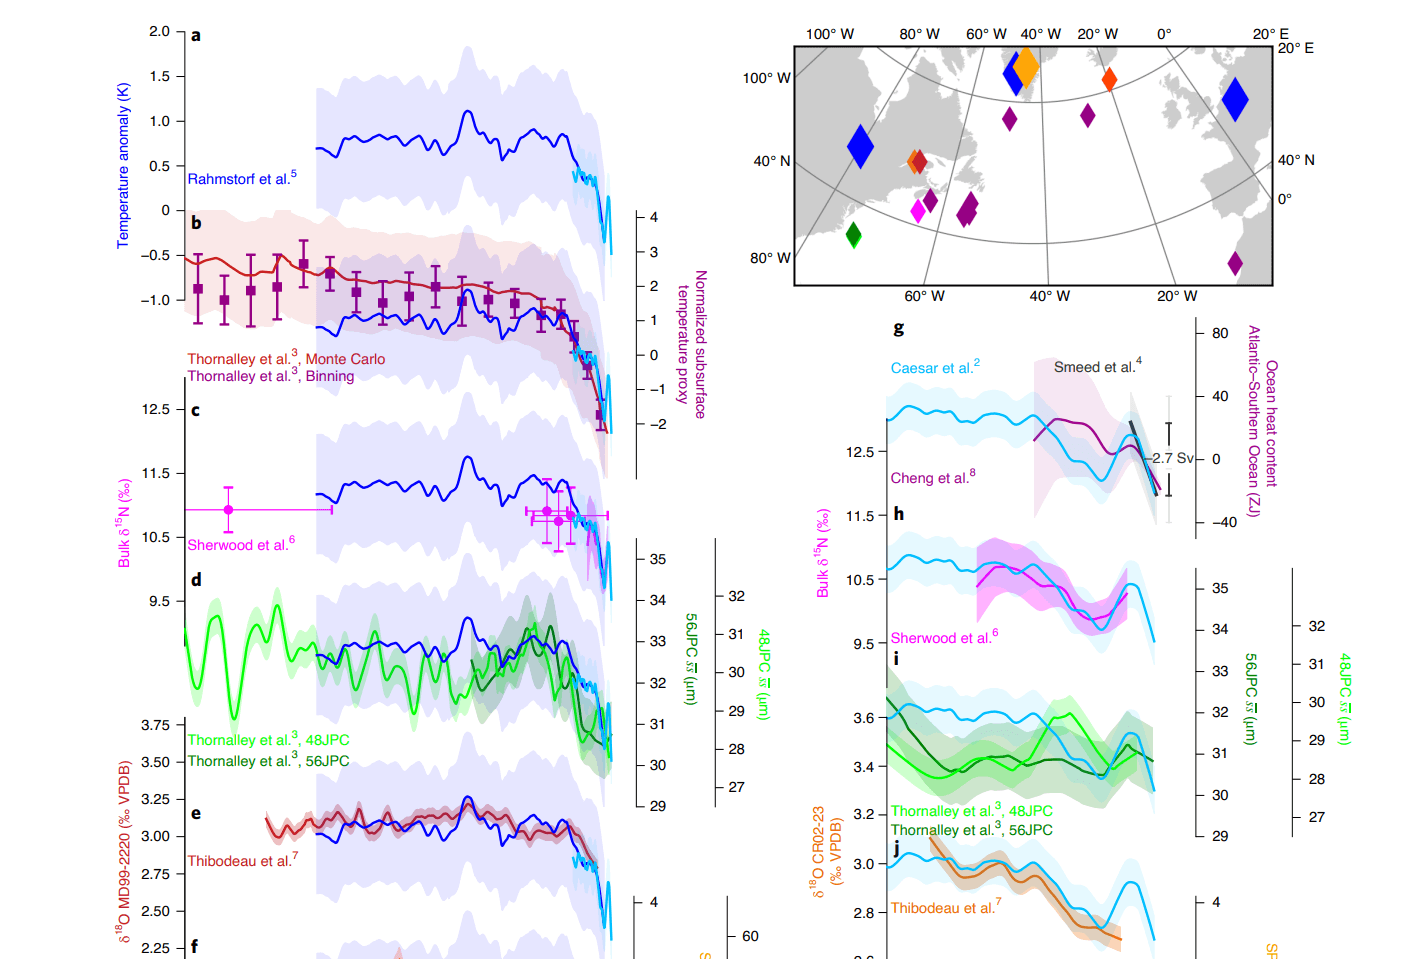
There are also observations being made with instruments, which objectively confirmed that the North Atlantic circulation is indeed on the decline.
In the image below, we have a series of datasets from different areas in or around the North Atlantic.
Each shows its own reconstruction of the AMOC strength.
They all confirm, either with the ocean or land data, that the AMOC is indeed weakening.
The idea is, that a weakening Gulf Stream cannot transport the warmer waters towards the north as effectively.
That results in warmer waters starting to pile up along the east coast of the United States.
As a result, the North Atlantic starts to cool down, because it is not receiving as much warm water anymore via the Gulf Stream.
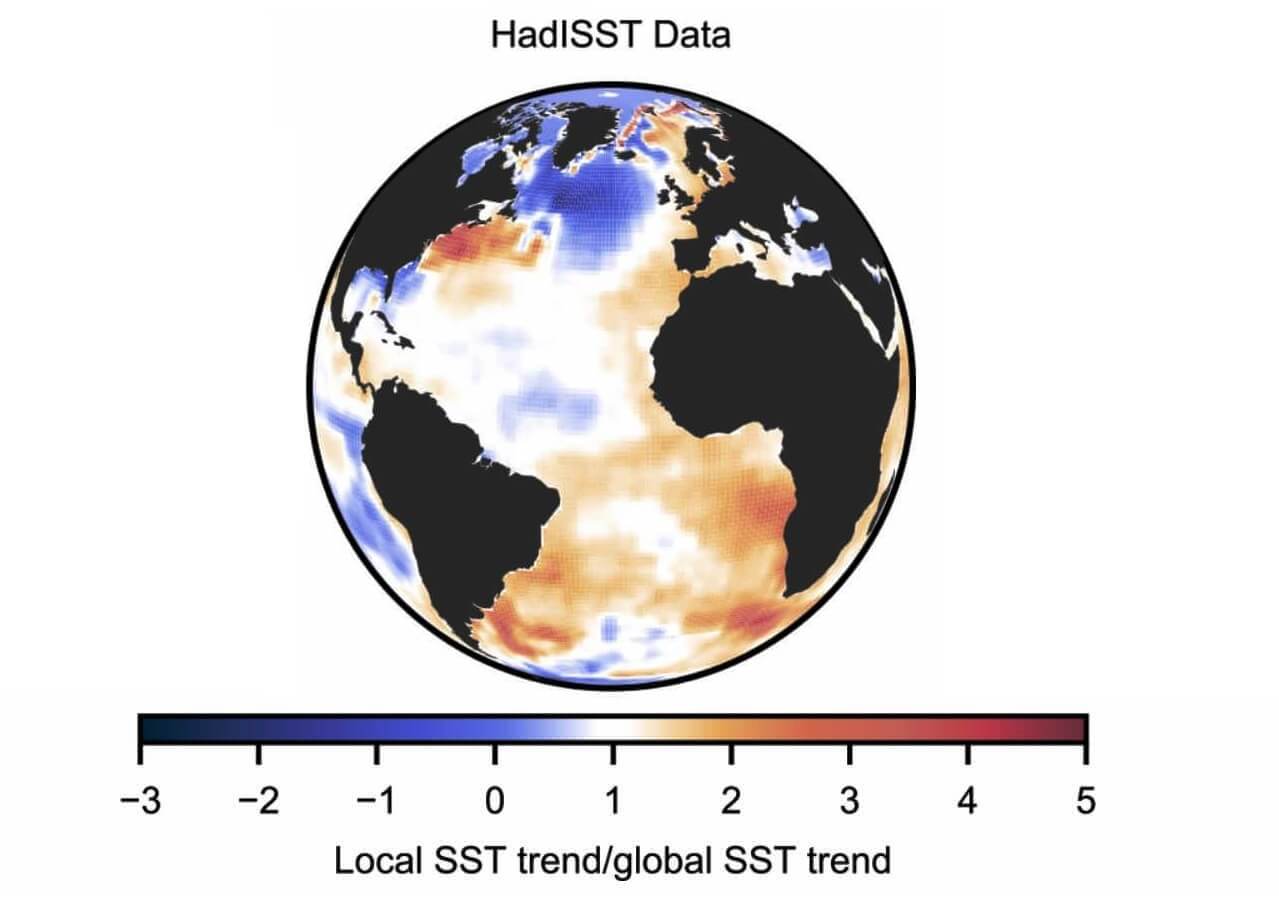
We can also see this weakening signature on the long-term temperature trend of the oceans since 1870.
Tho most ocean areas are slowly warming, the North Atlantic remains an area that is actually slowly cooling.
Compared to the Gulf Stream area which is warming, this is a direct indication of the weakening ocean circulation.
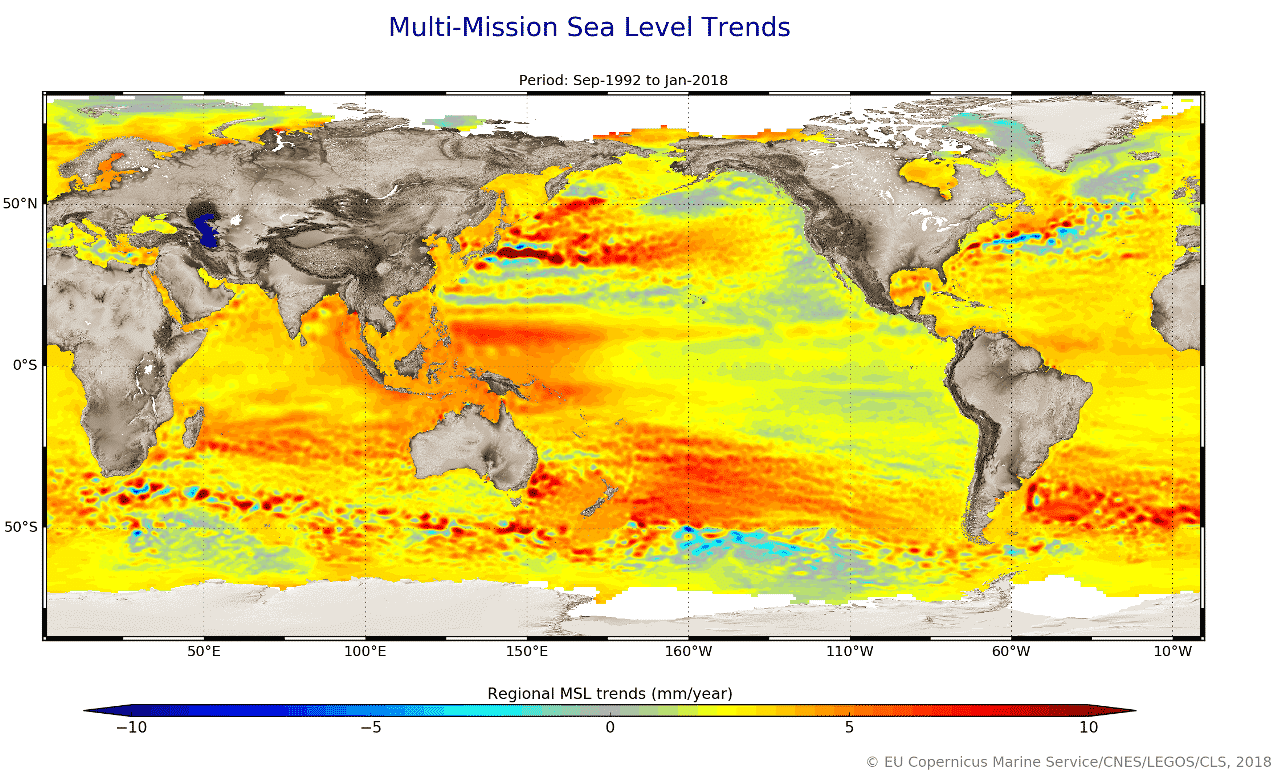
As ocean temperatures change over time, they also affect the sea surface height.
Below we have the sea-level trends from ESA, which show the rising/falling sea levels around the world.
We can see that the Gulf Stream area is actually rising, as the waters are slowing and warming, effectively “piling up”.
LATEST OCEAN DATA
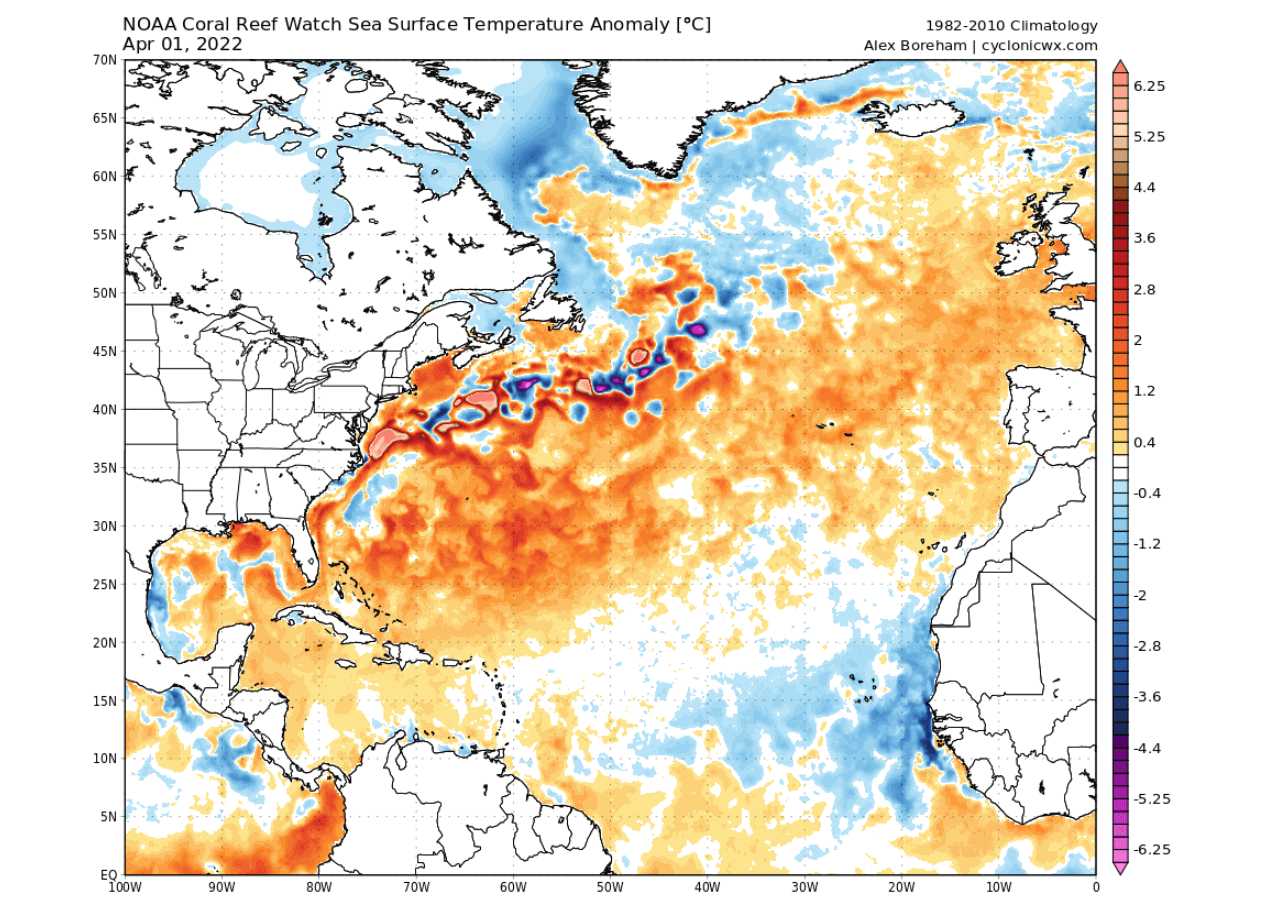
The latest ocean temperature anomalies show a similar signature.
Above-normal temperatures in the Gulf Stream region, and cooler towards the North Atlantic.
But these are surface temperatures and can be heavily influenced by the changing pressure and wind patterns.
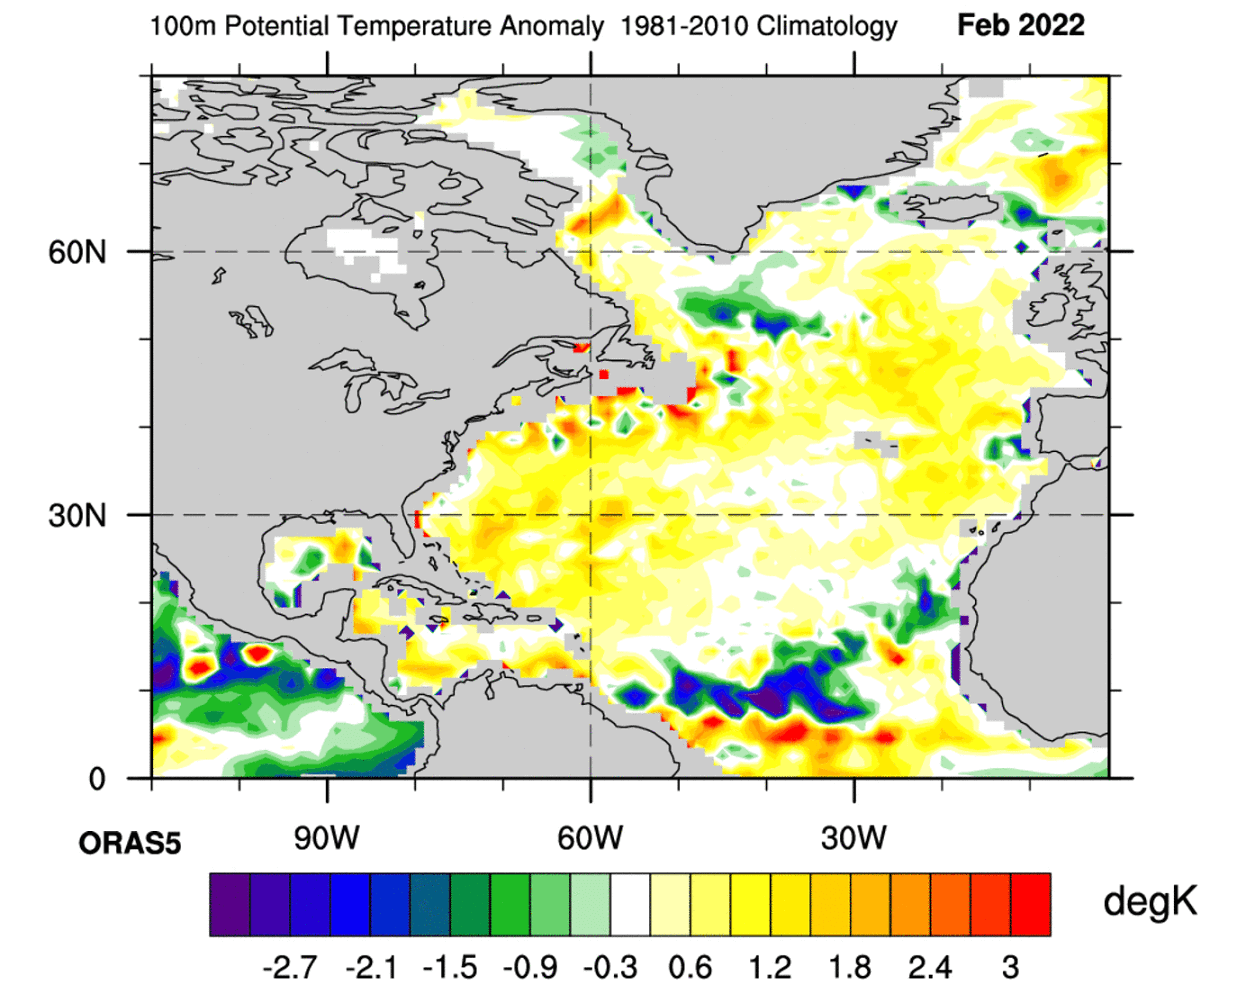
If we look below the surface, we can better see the more typical signature.
Warm Gulf Stream area, and cooler temperatures in the North Atlantic.
The cold anomaly is currently not as pronounced, but it is present down with depth.
Below we have the sea-level trends from ESA, which show the rising/falling sea levels around the world.
We can see that the Gulf Stream area is actually rising, as the waters are slowing and warming, effectively “piling up”.
LATEST OCEAN DATA
The latest ocean temperature anomalies show a similar signature.
Above-normal temperatures in the Gulf Stream region, and cooler towards the North Atlantic.
But these are surface temperatures and can be heavily influenced by the changing pressure and wind patterns.
If we look below the surface, we can better see the more typical signature.
Warm Gulf Stream area, and cooler temperatures in the North Atlantic.
The cold anomaly is currently not as pronounced, but it is present down with depth.
But why is the Gulf Stream weakening?
There is more than one reason why the AMOC is weakening overall.
In the movie “The Day After Tomorrow”, the reasoning was that melting the Arctic and Greenland ice introduced lots of freshwater into the North Atlantic, creating a strong imbalance in the ocean current.
As you will now see, that is actually one thing that the movie probably got right.
IMBALANCE IN THE NORTH ATLANTIC
Freshwater reduces the salinity of the North Atlantic.
That makes the surface water less dense (and less heavy), so it can’t sink properly down to the depths.
As the ocean current cant sink as fast, it’s causing a “traffic jam”, slowing down the entire current.
Below we have a graphic that shows the sea surface salinity but over a larger area.
You can nicely see the salty waters coming towards the North Atlantic with the Gulf Stream.
But we can also see a lot of fresher waters in the Arctic Ocean which flows down into the North Atlantic and the North Pacific.
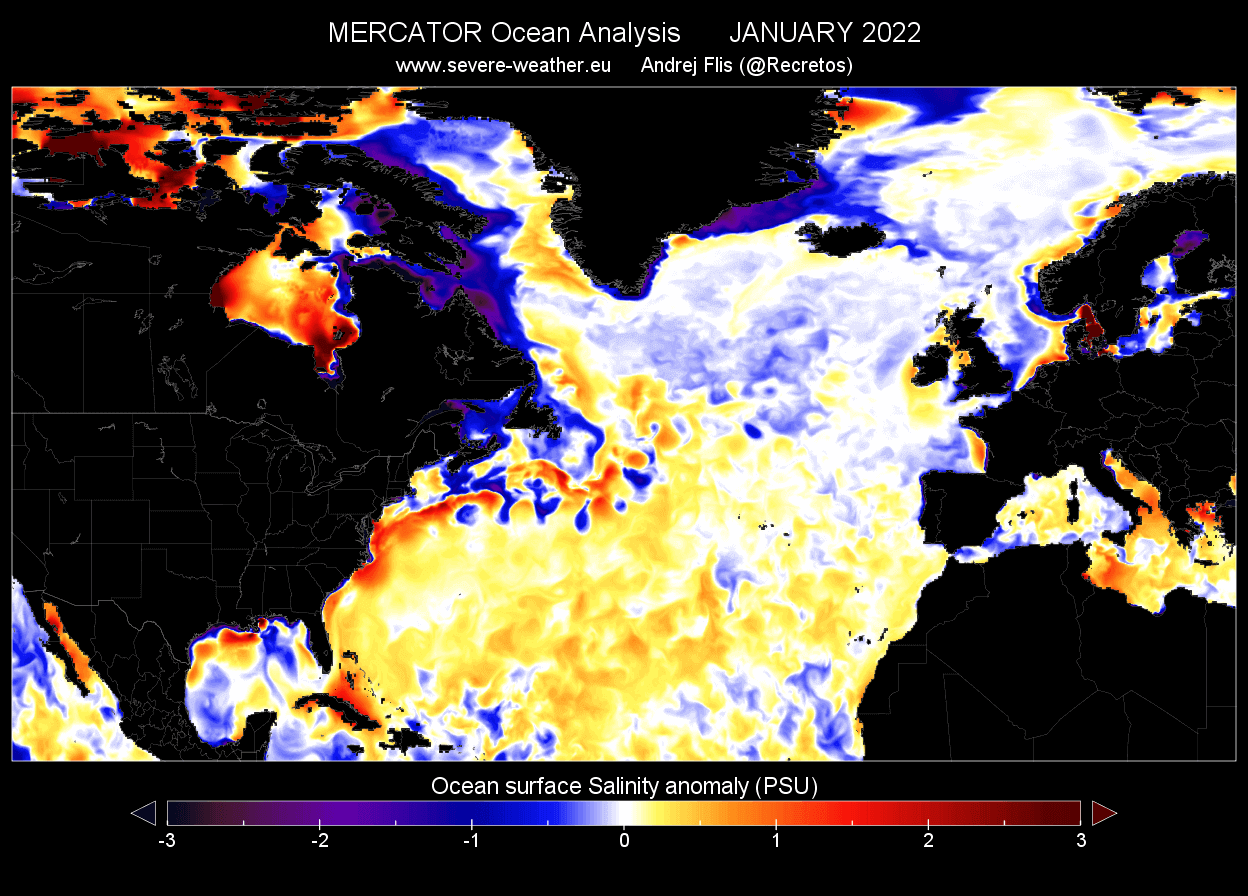
Looking at the ocean salinity anomaly, we can see that most of the North Atlantic ocean is currently less salty than normal.
It has a higher freshwater content than it should have.
But this is just the surface layer.
There is more than one reason why the AMOC is weakening overall.
In the movie “The Day After Tomorrow”, the reasoning was that melting the Arctic and Greenland ice introduced lots of freshwater into the North Atlantic, creating a strong imbalance in the ocean current.
As you will now see, that is actually one thing that the movie probably got right.
IMBALANCE IN THE NORTH ATLANTIC
Freshwater reduces the salinity of the North Atlantic.
That makes the surface water less dense (and less heavy), so it can’t sink properly down to the depths.
As the ocean current cant sink as fast, it’s causing a “traffic jam”, slowing down the entire current.
Below we have a graphic that shows the sea surface salinity but over a larger area.
You can nicely see the salty waters coming towards the North Atlantic with the Gulf Stream.
But we can also see a lot of fresher waters in the Arctic Ocean which flows down into the North Atlantic and the North Pacific.
Looking at the ocean salinity anomaly, we can see that most of the North Atlantic ocean is currently less salty than normal.
It has a higher freshwater content than it should have.
But this is just the surface layer.
But, looking at the last decade and a bit deeper, at around 50 meters (164ft), we can see that the North Atlantic is also fresher than normal.
This strongly indicates that there is currently more fresh water in the North Atlantic than is normally expected.
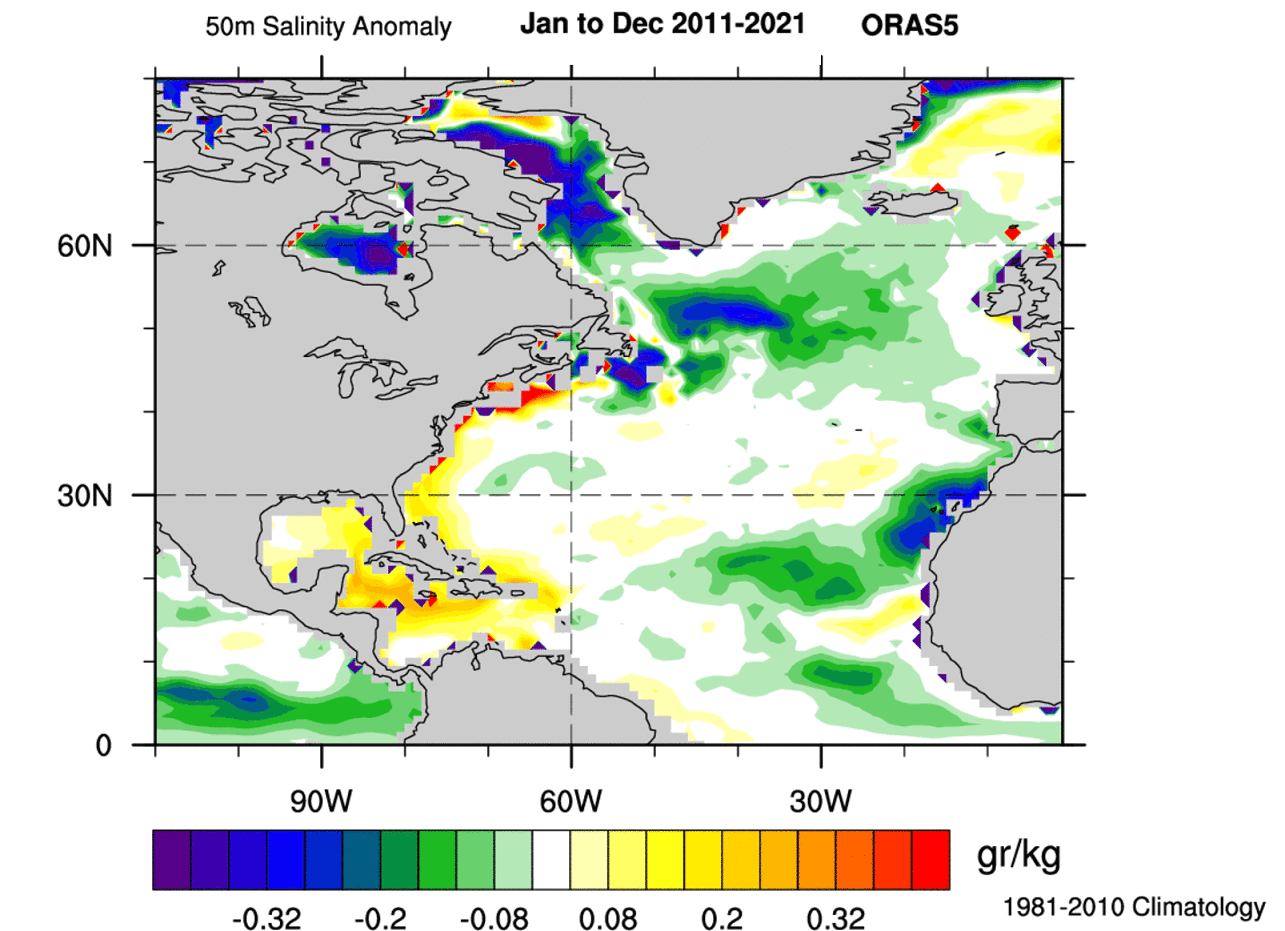
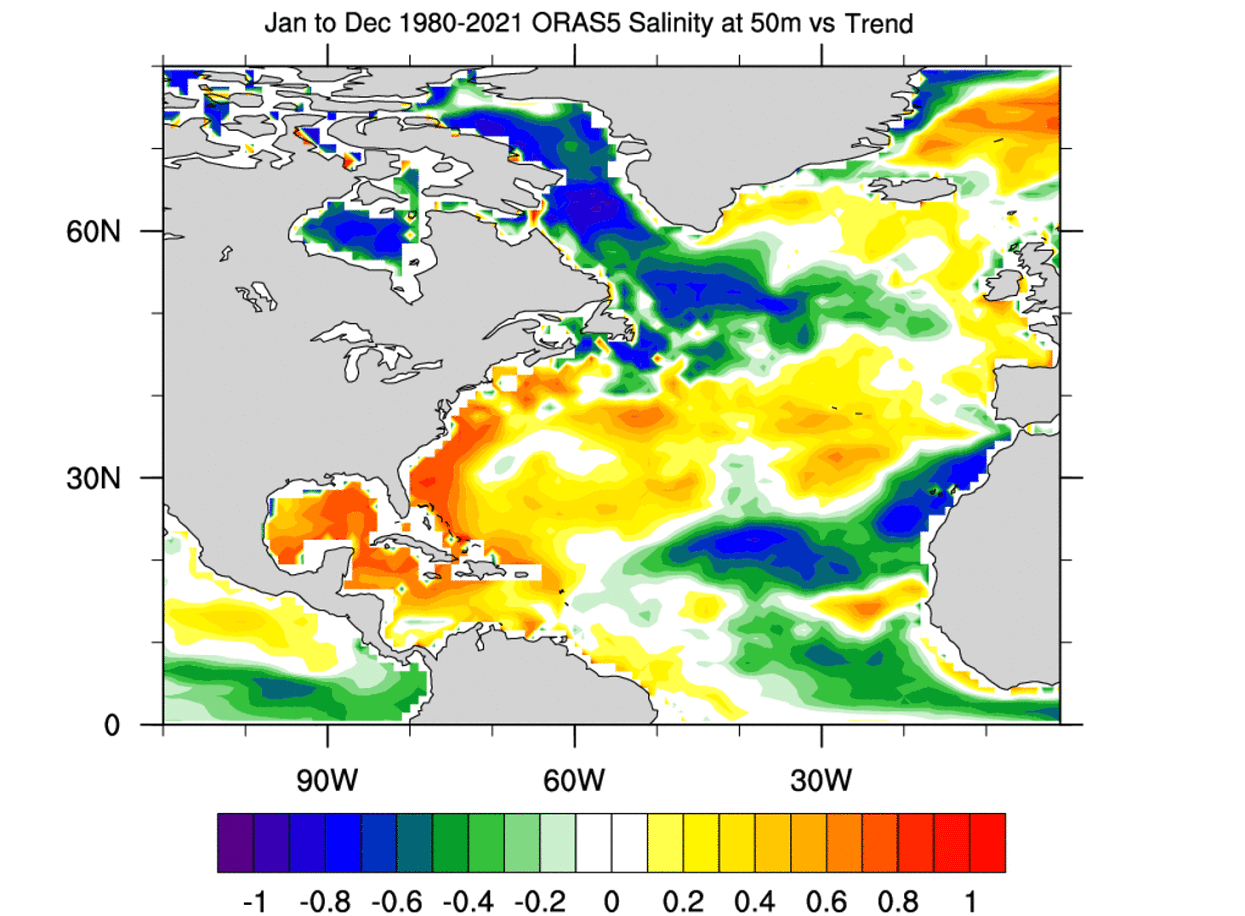
Comparing the salinity at the same depth over the past 40 years with a linear trend, we can see a pretty stable freshening of the North Atlantic.
The Labrador Sea is also seen with a reduced salinity trend.
The data on these graphics is from ECMWF ORA-S5 ocean reanalysis.
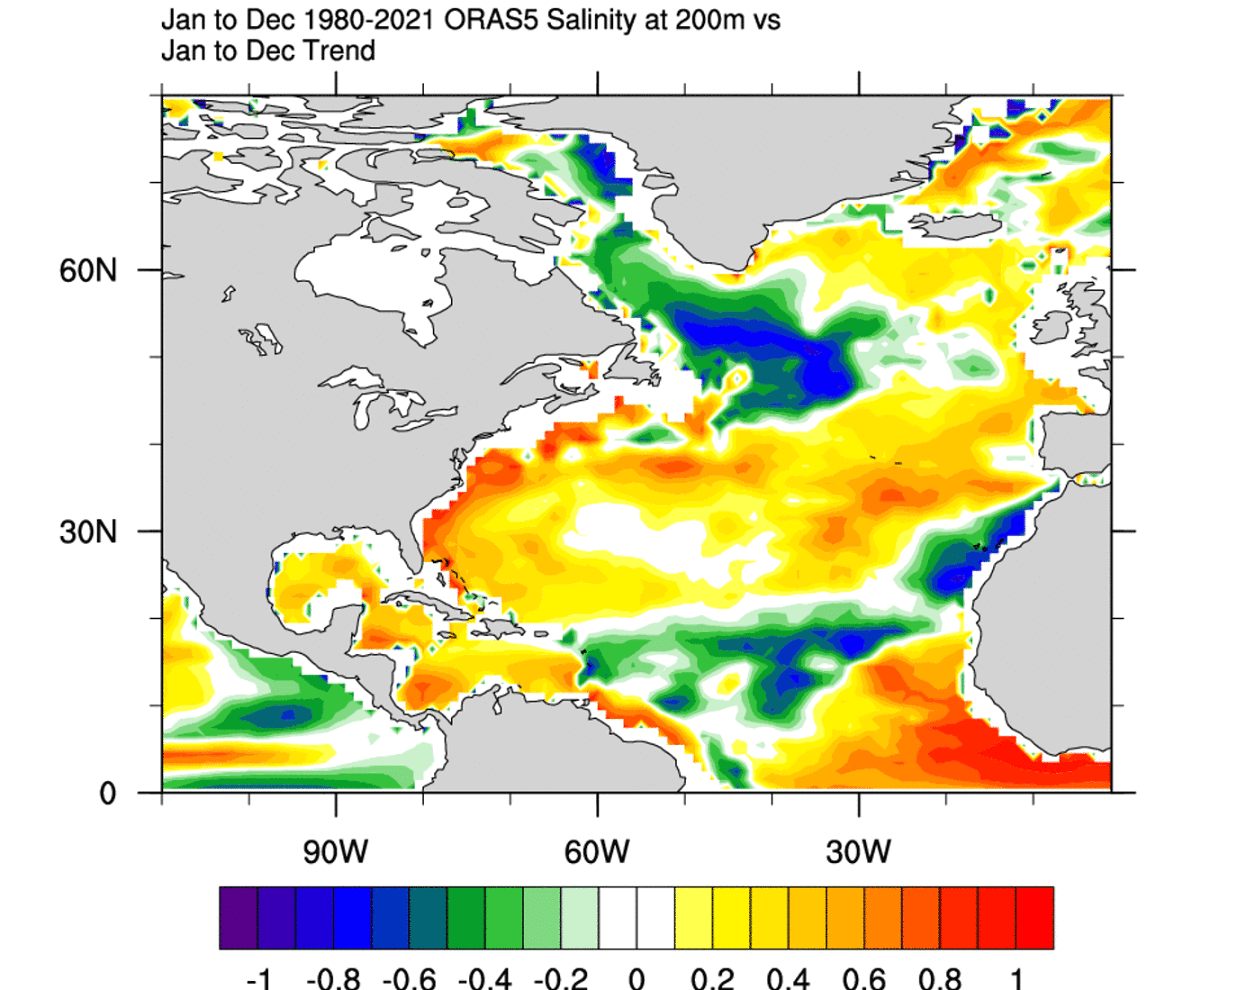
At 200m (656ft) depth, the story is the same.
We can see a large part of the subpolar North Atlantic fresher than normal.
That is directly in the area where the Gulf Stream starts to sink down into the depths.
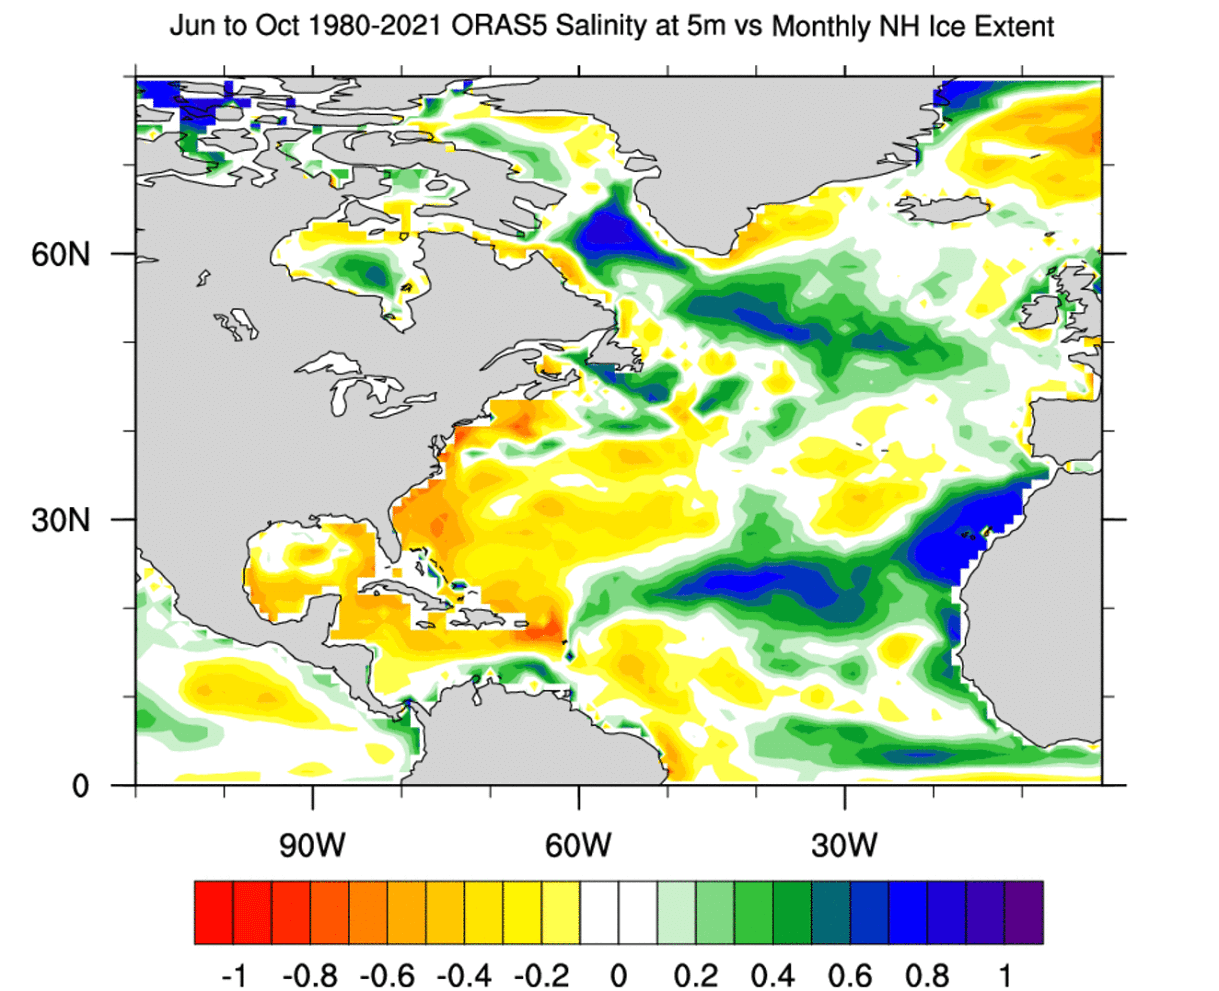
The image below is a bit different and actually compares the surface salinity with the Arctic sea ice extent in the past 40 years.
We can see a strong signal, that shows the North Atlantic getting more freshwater, as more sea ice is melting.
We can see a large part of the subpolar North Atlantic fresher than normal.
That is directly in the area where the Gulf Stream starts to sink down into the depths.
The image below is a bit different and actually compares the surface salinity with the Arctic sea ice extent in the past 40 years.
We can see a strong signal, that shows the North Atlantic getting more freshwater, as more sea ice is melting.
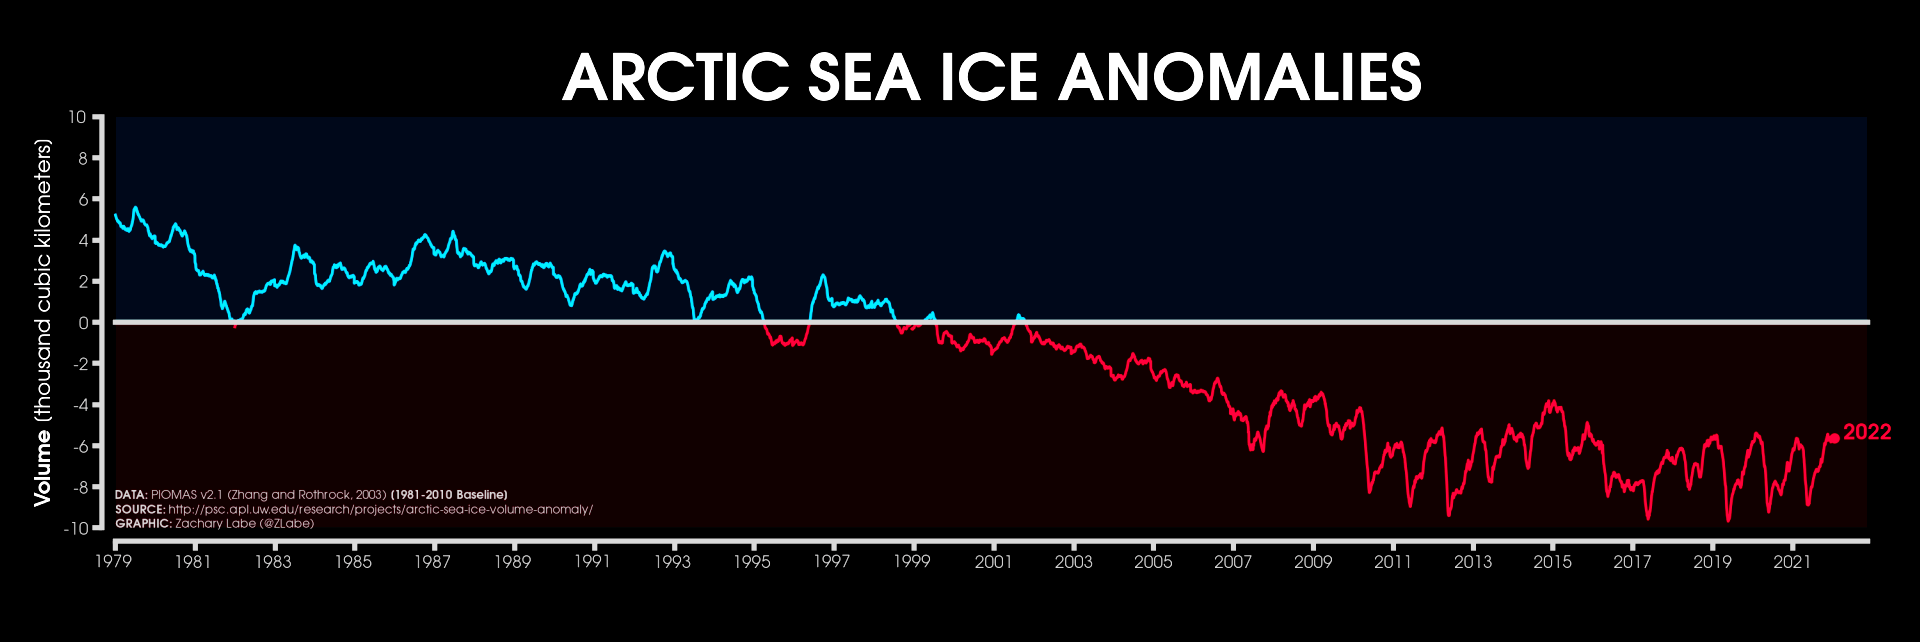
The graph below actually shows the Arctic sea ice volume anomaly, since 1979.
We can see a gradual reduction of sea ice volume, meaning a stronger melt rate.
The long-term salinity trends below are also very telling.
We can see a stable decrease in salinity across the North Atlantic, indicating the influx of freshwater over time.
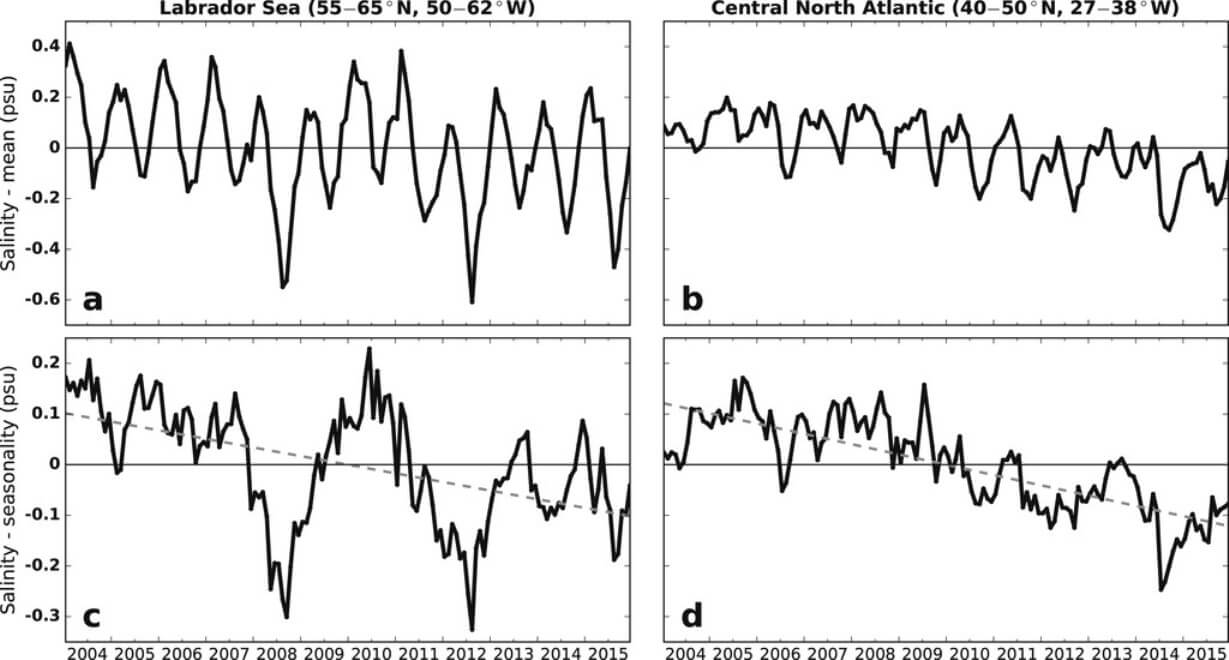
Below we have a graph that shows the salinity anomaly at 200m (656ft) depth, in the August-October period.
This covers the latter warm season, with the highest rate of sea ice melt.
It is telling us that more freshwater is arriving in the North Atlantic.

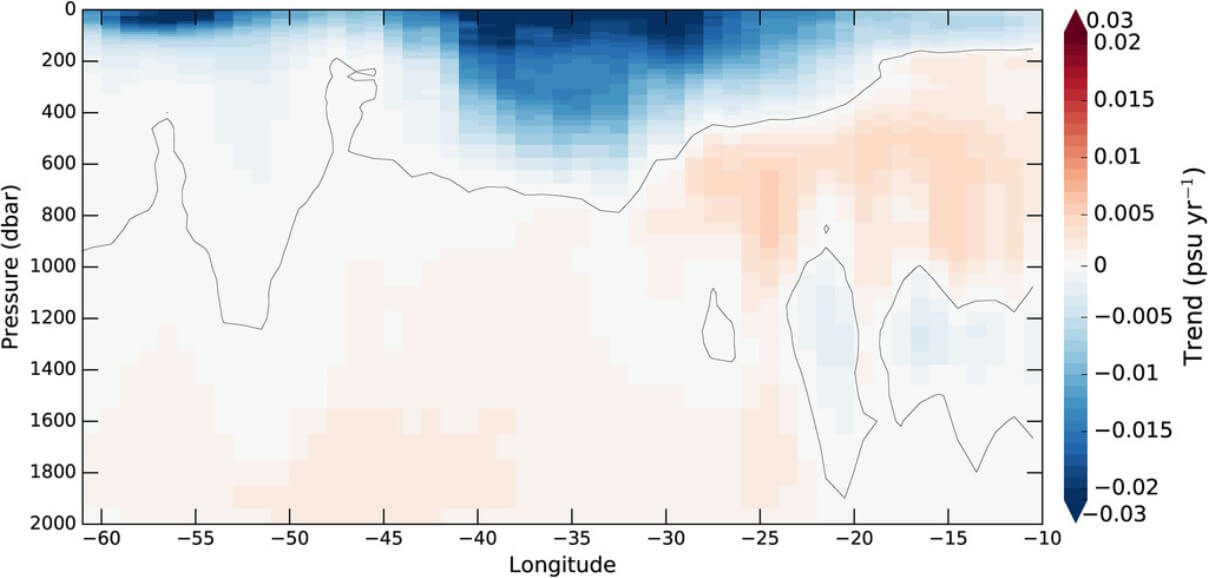
We produced a special graphic, that shows a cross-section of the North Atlantic.
It shows the salinity anomaly with depth for the past decade.
You can see that the fresher waters reach quite deep down, likely being transported by the ocean currents/circulation.
This covers the latter warm season, with the highest rate of sea ice melt.
It is telling us that more freshwater is arriving in the North Atlantic.
We produced a special graphic, that shows a cross-section of the North Atlantic.
It shows the salinity anomaly with depth for the past decade.
You can see that the fresher waters reach quite deep down, likely being transported by the ocean currents/circulation.

Looking at the long-term trend with depth, we can see the strong reduced salinity trend reaching deeper down in the North Atlantic.
Stronger freshening is seen in the surface layers, most likely affected by the influx of fresher waters from the Arctic and Greenland.
This is one thing that the movie “The day after tomorrow” got somewhat right if we ignore its overly short time scale.
But are we now facing a new ice age? In a short answer, no.
But we are not yet at a full collapse and shutdown of the Gulf Stream.
We can, however, make a global simulation, of what can be expected once e do reach that point.
Many model simulations were made, to try and calculate what would happen if the AMOC would completely shut down.
Below is the end result, which shows the temperature, compared to a world with an active AMOC.
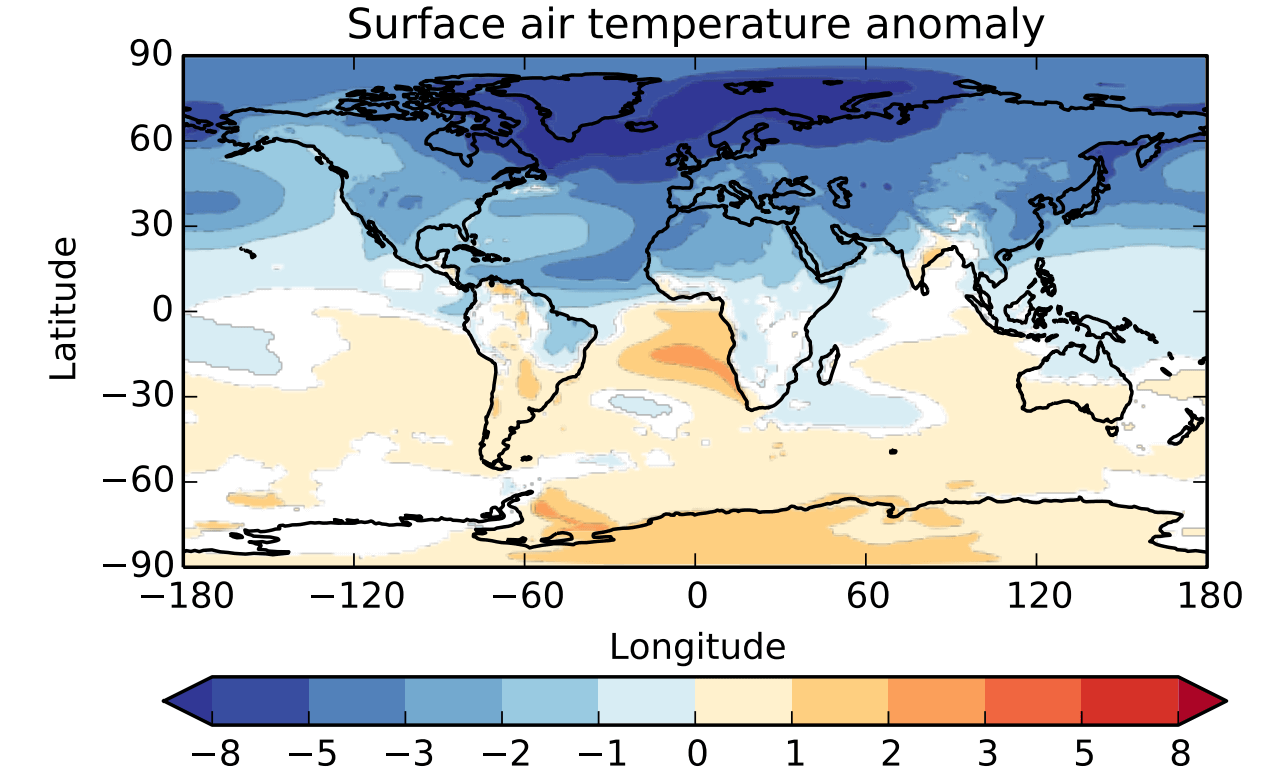
You can see that the entire Northern Hemisphere is several degrees cooler.
And that is just the beginning.
Strong climatic changes were to occur, with very different pressure patterns and precipitation distribution.
Winters would become more severe in Europe and the United States.
This would partially counter the continuing warming.
But it would introduce further severe destabilization of the already changing climate system.
It does not mean a new ice age just yet, but the global weather changes can be quite substantial.
So while we do not see a new ice age starting from the collapse of the Gulf Stream System, the global weather changes are quite severe.
But we do not need a full collapse of the AMOC to change the weather.
Slowing Gulf Stream means more water piling up on the east coast of the United States, which is dangerous for storm surges.
For Europe, it can mean a change in the track and strength of low-pressure systems coming in from the North Atlantic.
Of course, this is not something that would/will happen overnight, as these changes can take years, decades, or even centuries.
But we do know for a fact that the AMOC is in a decline.
And based on the amount of freshwater induced from the melting ice, we will likely be seeing climate effects still within our lifetime.
It is actually hard to argue that some are not happening already, but hard to filter out in a chaotic system like the global climate.
But what can happen almost overnight, are strong storms and hurricanes.
And the Gulf Stream and the AMOC play an important role in these events, especially for the United States, as you will soon learn.
GULF STREAM AND THE UNITED STATES
The water in the far North Atlantic is not sinking as fast anymore, as it is getting fresher.
That slows down the ocean transport system.
Because the ocean current is slowing down, the warmer water from the Gulf Stream has nowhere to go, and stalls, like in a traffic jam.
This means that less of the warm water is being transported to the North Atlantic.
Instead, it is now piling up just off the east coast of the United States.
This is a dangerous situation, as it provides a very potent energy source for powering up Nor’easter storms and tropical systems.
As the warmer water piles up, sea surface height is also increased, which means a higher potential for severe storm surges.
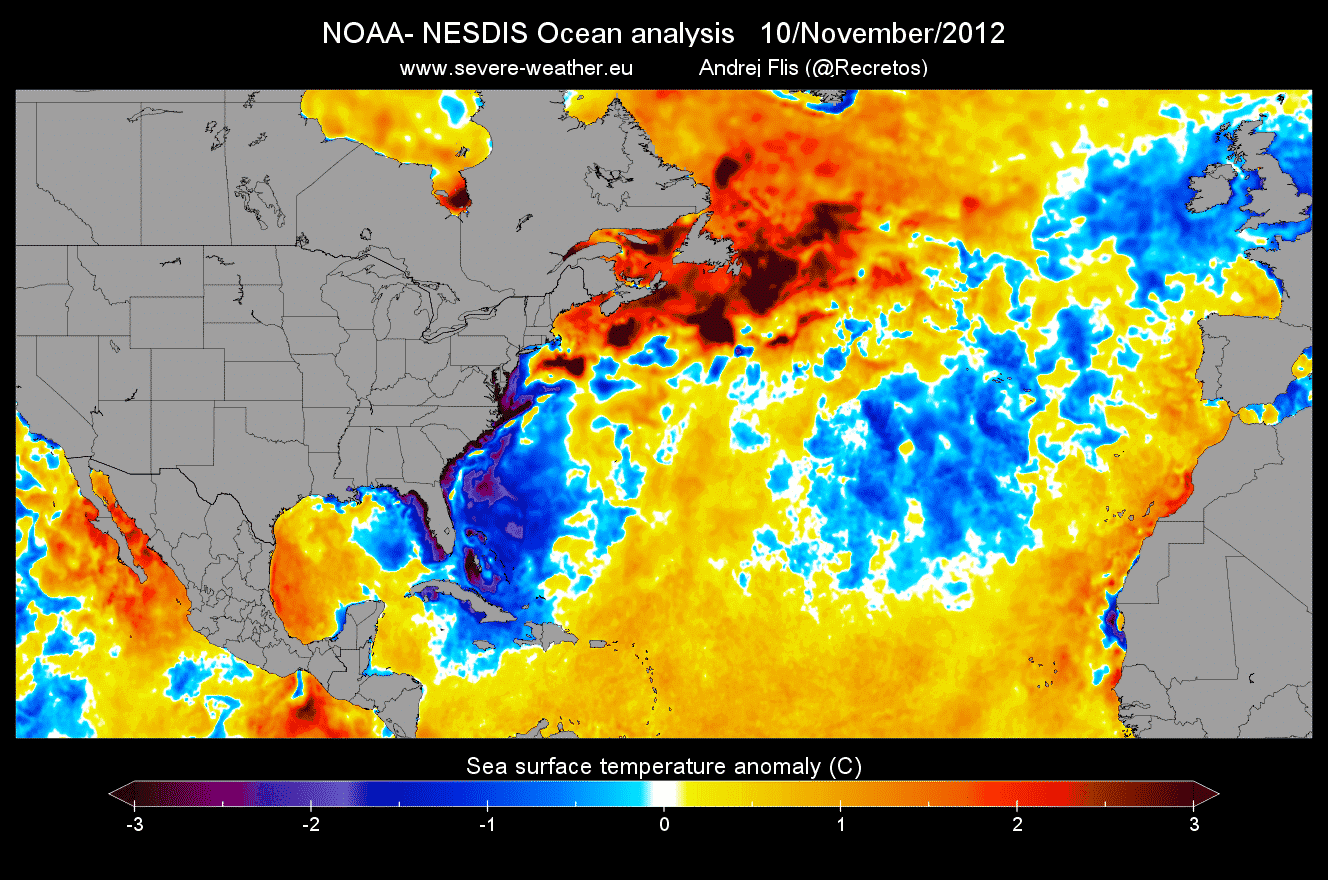
A somewhat recent example of this process was the infamous Hurricane Sandy, in 2012.
Below is an NOAA-GOES satellite image of Hurricane Sandy as it was sitting over the warm Gulf Stream, using it to power up before landfall in the United States.
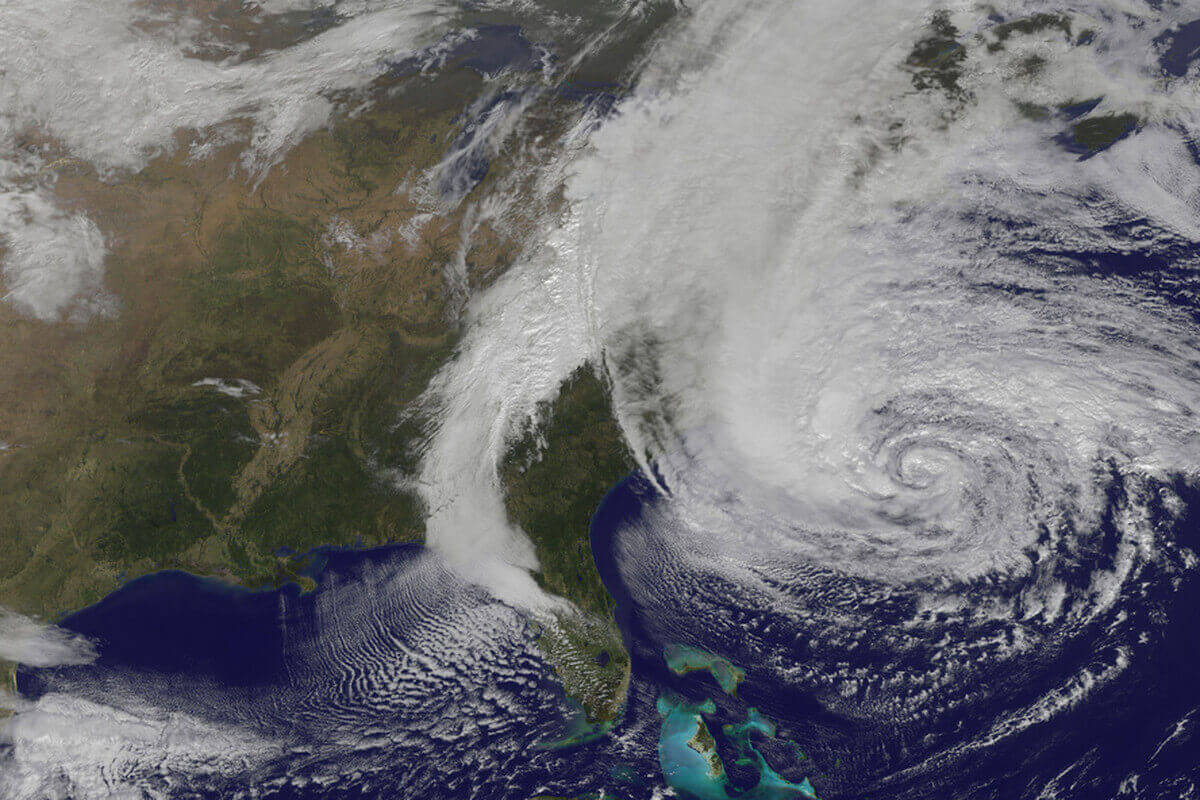
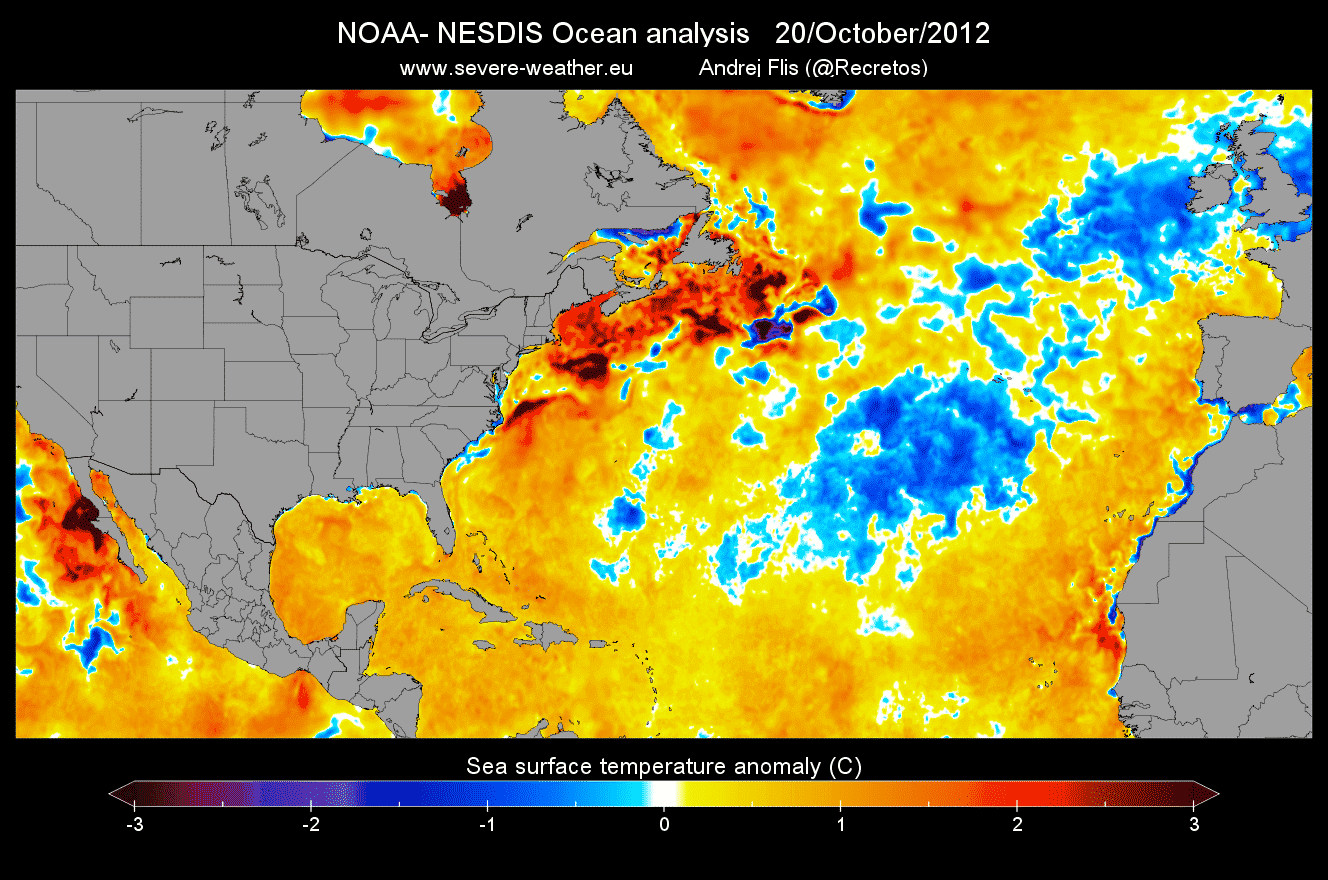
In the image below, you can see the sea surface temperature anomaly before the arrival of Hurricane Sandy.
Much of the tropical Atlantic was warmer than normal, along with the Gulf Stream area.
The warmer the ocean, the more energy it can provide for storm systems.
And that is just the beginning.
Strong climatic changes were to occur, with very different pressure patterns and precipitation distribution.
Winters would become more severe in Europe and the United States.
This would partially counter the continuing warming.
But it would introduce further severe destabilization of the already changing climate system.
It does not mean a new ice age just yet, but the global weather changes can be quite substantial.
So while we do not see a new ice age starting from the collapse of the Gulf Stream System, the global weather changes are quite severe.
But we do not need a full collapse of the AMOC to change the weather.
Slowing Gulf Stream means more water piling up on the east coast of the United States, which is dangerous for storm surges.
For Europe, it can mean a change in the track and strength of low-pressure systems coming in from the North Atlantic.
Of course, this is not something that would/will happen overnight, as these changes can take years, decades, or even centuries.
But we do know for a fact that the AMOC is in a decline.
And based on the amount of freshwater induced from the melting ice, we will likely be seeing climate effects still within our lifetime.
It is actually hard to argue that some are not happening already, but hard to filter out in a chaotic system like the global climate.
But what can happen almost overnight, are strong storms and hurricanes.
And the Gulf Stream and the AMOC play an important role in these events, especially for the United States, as you will soon learn.
GULF STREAM AND THE UNITED STATES
The water in the far North Atlantic is not sinking as fast anymore, as it is getting fresher.
That slows down the ocean transport system.
Because the ocean current is slowing down, the warmer water from the Gulf Stream has nowhere to go, and stalls, like in a traffic jam.
This means that less of the warm water is being transported to the North Atlantic.
Instead, it is now piling up just off the east coast of the United States.
This is a dangerous situation, as it provides a very potent energy source for powering up Nor’easter storms and tropical systems.
As the warmer water piles up, sea surface height is also increased, which means a higher potential for severe storm surges.
A somewhat recent example of this process was the infamous Hurricane Sandy, in 2012.
Below is an NOAA-GOES satellite image of Hurricane Sandy as it was sitting over the warm Gulf Stream, using it to power up before landfall in the United States.
In the image below, you can see the sea surface temperature anomaly before the arrival of Hurricane Sandy.
Much of the tropical Atlantic was warmer than normal, along with the Gulf Stream area.
The warmer the ocean, the more energy it can provide for storm systems.
The sea surface temperature anomaly in the image below is after the passing of Hurricane Sandy.
We can see a huge ocean temperature drop behind Sandy, from the western Caribbean all the way up the east coast of the United States.
Sandy has used the warmth of the ocean and the Gulf Stream, converting it into energy to power up.
It left behind ocean temperatures 4 to 6 degrees cooler.
Cooling is also due to the mixing of the ocean layers as a storm is passing over.
Deeper cooler waters rise to the surface as the seas get very rough under a low-pressure system, overturning and mixing with the warmer surface waters.
The warmer than normal Gulf Stream area can amplify the storms that approach the southeastern United States or the east coast.
Especially problematic is the increased sea surface height, which also enables higher tides and potentially stronger storm surges.
Check out the new study on the Gulf Stream Collapse by Niklas Boers, from the Potsdam Institute for Climate Impact Research:
Observation-based early-warning signals for a collapse of the Atlantic Meridional Overturning Circulation
Links :
- GeoGarage blog : Atlantic Ocean circulation at weakest in a millennium, say scientists / : Global ocean circulation keeps slowing ... / Slow-motion ocean: Atlantic's circulation is ... / Scientists say the global ocean circulation ... / Global warming is now slowing down the ... / NASA finds new way to track ocean currents ... / How climate change could jam the world's ocean ... / A sharper view of the world's oceans
Wednesday, August 17, 2022
When it comes to lightning, don’t pass the salt
Passing by a thunder cloud while crossing the Gulf Stream head to Key Largo from the Bahamas
From NYTimes by Katherine Kornei
Researchers recently found that the frequency of lightning decreases by up to 90 percent in the presence of salty sea spray
One of nature’s most intense spectacles can be tamed with humble sea salt, the same stuff that graces some dinner tables.
Researchers recently found that the frequency of lightning decreases by up to 90 percent in the presence of salty sea spray.
That makes sense based on how electric fields build up within clouds, the team proposes.
These new results, reported this month in the journal Nature Communications, help explain why thunderstorms occur much less frequently over the ocean than over land.
From rogue waves to floating debris, mariners have plenty to worry about. But at least being struck by lightning doesn’t generally make the list: Compared with the lightning that’s recorded over the continents, only about one-tenth as many strikes occur at sea.
From rogue waves to floating debris, mariners have plenty to worry about. But at least being struck by lightning doesn’t generally make the list: Compared with the lightning that’s recorded over the continents, only about one-tenth as many strikes occur at sea.
Why exactly has long remained a mystery. And that’s a “glaring deficiency” in our understanding, said David Romps, a physicist at the University of California, Berkeley, not involved in the research.
To dig into this enigma, Zengxin Pan, an atmospheric scientist at the Hebrew University of Jerusalem, and his colleagues mined data from over 75,000 recent lightning storms.
To dig into this enigma, Zengxin Pan, an atmospheric scientist at the Hebrew University of Jerusalem, and his colleagues mined data from over 75,000 recent lightning storms.
The researchers combined observations from the World Wide Lightning Location Network, a global repository of radio-frequency observations of lightning, with satellite-based measurements of cloud properties, precipitation and tiny airborne aerosol particles.
The goal was to trace how convective clouds — the birthplaces of lightning — evolved over time in different atmospheric conditions, said Daniel Rosenfeld, a co-author of the study who is an atmospheric scientist also at the Hebrew University of Jerusalem.

Compared with the lightning that is recorded over the continents,
only about one-tenth as many strikes occur at sea.
Credit...Darrin Zammit Lupi/Reuters
That was expected, Dr. Rosenfeld said. Fine aerosols function like miniature landing sites for water within clouds. Liquid tends to stick to them, building up droplets, but those droplets are small enough that they tend to stick around within a cloud rather than falling to the ground as raindrops, Dr. Rosenfeld said.
And because the presence of water in clouds sets up the intense electric fields that lead to lightning, dirty air leads to more lightning.
And because the presence of water in clouds sets up the intense electric fields that lead to lightning, dirty air leads to more lightning.
(This effect has been previously demonstrated in oceanic shipping lanes, which are plied by pollution-belching ships.)
The cleanliness of our air — or lack thereof — affects our weather, said Wei Gong, another co-author of the study and a physicist at Wuhan University in China.
“Aerosols in clouds have a significant effect,” he said.
Dr. Pan and his colleagues next demonstrated that larger particles, specifically the bits of sea salt produced by wind-swept sea spray, suppress lightning.
Dr. Pan and his colleagues next demonstrated that larger particles, specifically the bits of sea salt produced by wind-swept sea spray, suppress lightning.
These aerosols — at least 10 times larger than airborne pollution — also attract water, lots of it, Dr. Rosenfeld said.
“They absorb a lot of water vapor and form relatively large drops,” he said.
But those hefty drops are more likely to rain out of clouds.
But those hefty drops are more likely to rain out of clouds.
Because that process removes a key ingredient in the formation of lightning, sea spray is essentially a lightning killer, the team suggests.
Dr. Pan and his collaborators showed that the effects of sea spray were substantial: Storms exposed to high levels of sea salt aerosols produce up to 90 percent less lightning than storms with very low levels of sea salt aerosols.
Dr. Pan and his collaborators showed that the effects of sea spray were substantial: Storms exposed to high levels of sea salt aerosols produce up to 90 percent less lightning than storms with very low levels of sea salt aerosols.
That pronounced decrease was a surprise. “I didn’t expect it to be that large,” Dr. Rosenfeld said.

photo Jérémie Gaillard (via Asso Infoclimat)
Thunderstorms are therefore less common over the ocean than over the land for two reasons, the researchers concluded.
The fine airborne particles that promote lightning are more prevalent over land, close to more pollution sources.
And larger sea salt aerosols — which suppress lightning — are naturally found near or over open water. That’s a double whammy, said Yannian Zhu, an atmospheric physicist at Nanjing University in China and a study co-author.
“Different aerosols have significantly different impacts,” he said.

shot from Rhodes, Greece
These results offer a tantalizing explanation for a well-observed phenomenon, said Dr. Romps of the University of California, Berkeley. However, clouds don’t readily give up their secrets, he said.
This work is just one investigation into what will certainly be a long line of research. “It will not be the last word,” he said.
Links :
Links :
- Scientific American : Salty Sea Spray Keeps Lightning Strikes Away
Tuesday, August 16, 2022
Chinese customs seize thousands of maps over missing South China Sea ‘nine-dash line’

Chinese laws require maps, and products showing a map, to go through
vetting by the Ministry of Natural Resources during export.
Maps
intended for publication or display outside mainland China must also be
vetted.
From SCMP by Jack Lau
- A total of 23,500 ‘problematic’ maps seized by customs officials in the eastern city of Ningbo
- Offending maps also fail to include Beijing’s island claims in the East and South China seas, and lack a vetting number, officials reveal
Ningbo city customs authorities said the two batches of “problematic maps”, numbering 23,500 in all, omitted the nine-dash line covering Beijing’s vast claims in the South China Sea that extend as far as 2,000km (1,200 miles) from the Chinese mainland.
The maps also failed to include contested island chains claimed by China, such as the Spratlys and the Paracels in the South China Sea, as well as the uninhabited East China Sea islands called the Diaoyus – claimed by Japan as the Senkaku.
 |
 MSA AIS platform displaying nine-dash line
For years, Beijing has cracked down on “problematic maps” that it deems to “endanger sovereignty, national reunification, territorial integrity, national security and interests”.
Omitting disputed territories and the nine-dash line are typical characteristics of problematic maps, according to China’s natural resources ministry, the state map regulator.
The nine-dash line was ruled unlawful under international law by the Permanent Court of Arbitration at The Hague in a 2016 ruling, which Beijing refused to take part in and has refused to recognise.
China has remained firm about how its territorial claims are presented, even by private companies headquartered outside the mainland.
In 2018, American clothing retailer Gap apologised to Beijing for selling T-shirts adorned with a Chinese map without Taiwan and its claimed South China Sea islands. Beijing also set a deadline for foreign airlines to change their references to Taiwan, Hong Kong and Macau so that they are not represented as independent countries.
Ningbo customs also said the maps seized did not go through vetting and lacked a map vetting number required under Chinese law.
Chinese mapping laws require maps, and products showing a map, to go through vetting by the Ministry of Natural Resources during export.
Maps intended to be published or shown outside mainland China also need to be vetted.
A photo released by the customs bureau showed two officers examining what appeared to be a gaming mouse mat, with a highly stylised world map featuring time zones printed on it.
A photo released by the customs bureau showed two officers examining what appeared to be a gaming mouse mat, with a highly stylised world map featuring time zones printed on it.
An identical-looking rubber mat could be found on AliExpress, a global retail platform operated by Alibaba Group Holding, which also owns the South China Morning Post .
The product did not have the nine-dash line printed on it.
 Maps are considered sensitive in China for their potential to reveal information that could threaten national security.
Photo: Weibo
Customs in Chongqing in southwestern China also recently seized stylised world maps for having “violated the one-China principle”, referring to Beijing’s position that there is but one China under the sole lawful government in Beijing and self-governed Taiwan is a part of that China.
Authorities said the maps harmed national sovereignty and territorial integrity with their “incorrect” labels for Taiwan and the Diaoyu Islands.
The natural resources department of China’s southern Guangdong province has also issued an advisory calling for stricter regulation of “problematic maps”, and stronger inspection of book stores, exhibitions and markets as well as websites for such maps.
“We have to resolutely crack down on, and seriously inspect and punish, operators of mapping products that draw Chinese map incorrectly, leak state secrets, endanger national sovereignty, security and [cause] damage to national interests,” the advisory said.
Maps are considered sensitive in China for their potential to reveal information that could threaten national security.
Mapping and surveying using GPS is illegal without official authorisation.
Links :
- GeoGarage blog : China revises mapping law to bolster claims over South China Sea land, Taiwan
- China-US Focus : Understanding the South China Sea Dispute
- State.gov : Limits in the Seas, People’s Republic of China : Maritime Claims in the South China Sea
- Foreign Policy : The United States Is Deeply Invested in the South China Sea
Subscribe to:
Posts (Atom)