Saturday, April 29, 2023

Kirsten Neuschäfer is making history winning


Kirsten Neuschäfer (39) / South Africa / Cape George 36 - "MINNEHAHA" officially became the first woman to win a round the world race by the three great capes, including solo and fully crewed races, non-stop or with stops, and the first South African sailor to win a round-the-world event!
 
Links :

Friday, April 28, 2023

Elephant seals take power naps during deep ocean dives

Data-driven animation showing the phases of a sleeping dive to 263 meters.
The phases of a seal’s sleeping dive to 263 meters, made using data captured by a device that monitored the seals’ brain waves, heart rates, dive depths and movement.
Video Credit: Animation by Jessica Kendall-Bar.

From NYTimes by Annie Roth

During the many months they spend at sea gorging on fish and squid, the massive mammals sleep only about two hours a day.

It long seemed as though African elephants were the champions of the all-nighter. 
They can get by on about two hours of sleep.
Other mammals need much more, like koalas (20 hours) or you (at least seven plus at least one strong cup of coffee).

But the largest living mammals on land have some competition at sea. Northern elephant seals are also able to sustain themselves on about two hours’ sleep, according to a study published Thursday in the journal Science. 
 
Cetaceans (whales and dolphins) and otariids (fur seals and sea lions) keep one side of their brains awake while the other is asleep (unihemispheric sleep).
In most other mammals, including phocids (true seals) and humans, both hemispheres of the brain are asleep at the same time.
Credit: Graphic by Jessica Kendall-Bar
 
The study found that Northern elephant seals sleep far less at sea than they do on land, and the z’s they do catch at sea are caught hundreds of feet below the ocean’s surface. 
The study’s authors believe that sleeping in the deep allows the seals to power-nap without being eaten by prowling predators.

Northern elephant seals, which are found along the West Coast, are champion divers that can descend to depths of 2,500 feet and stay under for about two hours.
They are not as big as elephants, but males can weigh as much as a car and stretch 13 feet long.
To maintain their blubbery bulk, Northern elephant seals must spend around seven months at sea each year, gorging on fish and squid.

During these epic voyages, the seals are vulnerable to predation by great white sharks and killer whales. Some marine mammals, such as dolphins and fur seals, can rest half of their brain at a time. 
This type of slumber, known as unihemispheric sleep, enables some mammals at sea to snooze with one eye open, literally, which prevents predators from catching them off guard. However, elephant seals sleep like us, shutting down their brains completely.

 
A sleeping 2-month-old northern elephant seal at Año Nuevo State Park, Calif.
Credit...Rachel Holser

Jessica Kendall-Bar, now a postdoctoral fellow at the Scripps Institution of Oceanography in San Diego, wondered how Northern ​​elephant seals managed to sleep, given how much time they need to spend eating and avoiding being eaten while at sea.

To find out how elephant seals avoid waking up in the maw of an orca or a shark, Dr. Kendall-Bar worked with colleagues at the University of California, Santa Cruz, to design a device that could monitor the seals’ brain waves, heart rates, dive depths and movement.
The device is noninvasive and fits atop the seal’s head like a swim cap.
The team attached the devices to the heads of several seals and monitored their sleeping habits for five days. 
The data collected by the devices revealed a bedtime routine unlike any other.
“They dive down, stop swimming and begin to glide,” Dr. Kendall-Bar said.
As they go deeper, their brain activity starts to slow.
“Then they transition to REM sleep, where they flip upside down and spin in a circle, falling like a leaf,” she said.

While in rapid eye movement, or REM, sleep, which is the deepest stage of sleep, the seals stayed upside down, oblivious to their slow descent.

After sleeping for around 10 minutes, the seals would suddenly wake up and make their way back to the surface.
During these sleep dives, some seals sank over 1,000 feet, sometimes finding themselves on the seafloor.
 
When elephant seals go into rapid-eye-movement (REM) sleep during deep dives, sleep paralysis causes them to turn upside down and drift downwards in a “sleep spiral.”
 This data-driven graphic shows sleeping postures every 20 seconds, with accompanying 30-second segments of EEG traces in the background.
Credit: Jessica Kendall-Bar

The seals Dr. Kendall-Bar and her colleagues monitored took several sleep dives each day, providing them with around two hours of sleep in total.
When Northern elephant seals haul out on land to breed and molt, they sleep for over 10 hours a day.
During that time, the seals aren’t eating, which may explain their need for extra sleep.

“Sleep is an adaptive trait,” said Jerome Siegel, a professor of psychiatry at the University of California, Los Angeles, who studies the evolution and function of sleep. “Animals have evolved to sleep in certain situations and not in others.” 
It makes perfect sense, Dr. Siegel said, that elephant seals would limit the amount of time they spend sleeping while at sea to make the most of their food intake and reduce the amount of time they are vulnerable to predators.

That doesn’t make seal sleep habits any less impressive.
“Northern elephant seals exhibit unparalleled flexibility in their sleep duration,” Dr. Kendall-Bar said. “No other mammal goes from sleeping about two hours a day for over 200 days to sleeping 10.8 hours a day.”

Dr. Kendall-Bar hopes her team’s findings will aid in the protection of marine mammals.
“Learning more about where, when and how marine mammals sleep at sea can help scientists improve the management of their critical resting habitats,” she said.

Links :

Thursday, April 27, 2023

Ice loss from Greenland and Antarctica hits new record


From ESA

A report, released last Friday, states that ice loss from Greenland and Antarctica has increased fivefold since the 1990s, and now accounts for a quarter of sea-level rise.

It is without doubt that climate change is causing our polar ice sheets to melt, thereby driving up sea levels and putting coastal regions around the world at risk.

Since 1992, when satellite records of ice-sheet melt began, the polar ice sheets have lost ice every single year.
The highest rates of melt have occurred in the past decade.

Scientists use data from satellites such as ESA’s CryoSat and the European Union’s Copernicus Sentinel-1 to measure changes in ice volume and flow, as well as satellites that provide information on gravity, to work out how much ice is being lost.

A team of scientists compile these records in the Ice Sheet Mass Balance Intercomparison Exercise (IMBIE), which is funded by ESA and NASA.
This is used widely, including by the International Panel on Climate Change (IPCC), to understand and respond to the climate crisis.

The latest IMBIE assessment, which was published today, states that between 1992 and 2020, the polar ice sheets lost 7560 billion tonnes of ice – equivalent to an ice cube measuring 20 km each side.


Ice loss from Greenland and Antarctica 
The latest Ice Sheet Mass Balance Intercomparison Exercise (IMBIE) reports that ice loss from Greenland and Antarctica has increased fivefold since the 1990s, and now accounts for a quarter of sea-level rise.
The assessment states that between 1992 and 2020, the polar ice sheets lost 7560 billion tonnes of ice – equivalent to an ice cube measuring 20 km each side.
Melting of the polar ice sheets has caused a 21 mm rise in global sea level since 1992.
Ice loss from Greenland is responsible for almost two-thirds (13.5 mm) of this rise, and ice loss from Antarctica is responsible for the other third (7.4 mm).
The polar ice sheets have together lost ice in every year of the satellite record, and the seven highest melting years have occurred in the last decade.

The polar ice sheets have together lost ice in every year of the satellite record, and the seven highest melting years have occurred in the last decade.

Melting peaked in 2019, when the Greenland and Antarctic ice sheets lost a staggering 612 billion tonnes of ice.

This was driven by summer heatwave in the Arctic, which led to a record 444 billion tonnes of ice being lost from Greenland that year.
Antarctica lost 168 billion tonnes of ice – the sixth highest year on record – owing to the continued speedup of glaciers in West Antarctica and record melting from the Antarctic Peninsula.
East Antarctic Ice Sheet remained close to a state of balance, as it has throughout the satellite era.

Melting of the polar ice sheets has caused a 21 mm rise in global sea level since 1992.

Ice loss from Greenland is responsible for almost two-thirds (13.5 mm) of this rise, and ice loss from Antarctica is responsible for the other third (7.4 mm).

In the early 1990s, ice sheet melting accounted for only a small fraction (5.6 %) of sea-level rise. However, there has been a fivefold increase in melting since then, and they are now responsible for more than a quarter (25.6 %) of all sea-level rise.

If the ice sheets continue to lose mass at this pace, the IPCC predicts that they will contribute between 148 and 272 mm to global mean sea level by the end of the century.

Inès Otosaka, from the University of Leeds in the UK and who led the IMBIE study, said, “Ice losses from Greenland and Antarctica have rapidly increased over the satellite record and are now a major contributor to sea-level rise. Continuously monitoring the ice sheets is critical to predict their future behaviour in a warming world and adapt to the associated risks that coastal communities around the world will face.”

This is now the third assessment of ice loss produced by the IMBIE team and is made possible thanks to continued cooperation between the space agencies and the scientific community.

Over the past few years, ESA and NASA have made a dedicated effort to launch new satellite missions capable of monitoring the polar regions.
The IMBIE project has taken advantage of these to produce more regular updates, and, for the first time, it is now possible to chart polar ice sheet losses every year.

Andrew Shepherd, from Northumbria University and founder of IMBIE, said, “After a decade of work, we are finally at the stage where we can continuously update our assessments of ice sheet mass balance thanks to satellites measuring and monitoring them.”

This third assessment from the IMBIE team involved a team of 68 polar scientists from 41 international organisations using measurements from 17 satellite missions, including, for the first time, from GRACE Follow-On gravity mission.

The assessment will now be updated annually to make sure that the scientific community has the very latest estimates of polar ice losses.

ESA’s Diego Fernandez noted, “This is another milestone in the IMBIE initiative and represents an example of how scientists can coordinate efforts to assess the evolution of ice sheets from space offering unique and timely information on the magnitude and onset of changes.

“The new annual assessments represent a step forward in the way IMBIE will help to monitor these critical regions, where we’ve reached a point where abrupt changes can no longer be excluded.”


ESA’s Mark Drinkwater added, “For over 13 years our CryoSat mission has played a starring role in measuring changes in polar ice.
“To secure the long-term continuation of radar altimetry ice-elevation and topographic-change records, we are currently developing the CRISTAL mission, a Copernicus Sentinel Expansion Mission, to enhance and extend the record from CryoSat and earlier heritage missions.”

IMBIE is supported by NASA and ESA’s Earth Observation Science for Society programme and Climate Change Initiative, which has contributed long-term satellite observation records to the study. Data on both ice sheets from multiple missions provides a consistent record of change from the 1990s to present day.

Links :

Wednesday, April 26, 2023

“It’s just mind boggling.” More than 19,000 undersea volcanoes discovered

 
The 4776-meter-tall Pao Pao Seamount (right) in the South Pacific Ocean has been mapped by sonar.
Many others haven’t.
Noaa Office Of Ocean Exploration And Research

From Science by Paul Voosen 

New seamount maps could aid in studies of ecology, plate tectonics, and ocean mixing

The U.S. submarine fleet’s biggest adversary lately hasn’t been Red October.
In 2005, the nuclear-powered USS San Francisco collided with an underwater volcano, or seamount, at top speed, killing a crew member and injuring most aboard.
It happened again in 2021 when the USS Connecticut struck a seamount in the South China Sea, damaging its sonar array.

With only one-quarter of the sea floor mapped with sonar, it is impossible to know how many seamounts exist.
But radar satellites that measure ocean height can also find them, by looking for subtle signs of seawater mounding above a hidden seamount, tugged by its gravity.
A 2011 census using the method found more than 24,000.
High-resolution radar data have now added more than 19,000 new ones.
The vast majority—more than 27,000—remain uncharted by sonar.
“It’s just mind boggling,” says David Sandwell, a marine geophysicist at the Scripps Institution of Oceanography, who helped lead the work.

Published this month in Earth and Space Science, the new seamount catalog is “a great step forward,” says Larry Mayer, director of the University of New Hampshire’s Center for Coastal and Ocean Mapping.
Besides posing navigational hazards, the mountains harbor rare-earth minerals that make them commercial targets for deep-sea miners.
Their size and distribution hold clues to plate tectonics and magmatism.
They are crucial oases for marine life.
And they are pot-stirrers that help control the large-scale ocean flows responsible for sequestering vast amounts of heat and carbon dioxide, says John Lowell, chief hydrographer of the National Geospatial-Intelligence Agency (NGA), which runs the U.S. military’s satellite mapping efforts.
“The better we understand the shape of the sea floor, the better we can prepare [for climate change].”

After the USS San Francisco accident, Sandwell and his colleagues secured funding from the Navy and NGA to hunt for seamounts with satellites.
They identified thousands, including 700 particularly shallow ones that posed hazards to submarines.
But the team knew its first catalog was far from complete.
Now, armed with data from high-resolution radar satellites, including the European Space Agency’s CryoSat-2 and SARAL from the Indian and French space agencies, the team can detect seamounts just 1100 meters tall—close to the lower limit of what defines a seamount, Sandwell says.

Seamounts often occur in chains formed as tectonic plates ride over stationary plumes of hot rock rising from the mantle.
As a result, the catalog will pay immediate dividends for studies of Earth’s interior, says Carmen Gaina, a geophysicist at the Queensland University of Technology.
It has already identified new seamounts in the northeast Atlantic Ocean that could help track the evolution of the mantle plume that feeds Iceland’s volcanoes.
The survey also spotted seamounts near a ridge in the Indian Ocean where fresh crust is made as tectonic plates spread apart.
They suggest a surprising amount of volcanism in a region once thought to be magma starved, Gaina says.

To biologists, seamounts’ steep slopes resemble crowded, boisterous skyscrapers for corals and other marine life.
“They’re oases for biodiversity and biomass,” says Amy Baco-Taylor, a deep-sea biologist at Florida State University.
Whales use them as waypoints.
But biologists debate the role seamounts play in marine biodiversity: Are they home to genetically distinct species, like remote islands? Or do they serve as stepping stones for life to hopscotch through the oceans? By pushing up the density of seamounts, the new maps could strengthen the argument for the latter, Baco-Taylor says.

They will also boost efforts to protect biodiversity in international waters under a new marine protection treaty.
“We can’t protect the things if we don’t know they’re there,” says Chris Yesson, a marine biologist at the Zoological Society of London’s Institute of Zoology.
The maps will provide a practical payoff, Yesson adds: “We won’t waste our time as much.” Some of his colleagues, he says, once traveled to the Indian Ocean to study a seamount that turned out to be a phantom created by an error in presonar depth records.
 
Two seamounts from the Kim-Wessel catalog before and after being centered (20 Eotvos contours). Light blue colored points indicate the original location of the seamounts.
Red points are the new centers chosen based on the maximum VGG value.
Credit: Earth and Space Science (2023). DOI: 10.1029/2022EA002331
 
Visualization with the GeoGarage platform (STRM bathymetry)
 
A bumpy ocean bottom


Satellites have detected more than 43,000 sea mounts.
But only 16,000 have been charted in detail by sonar from ships and submarines.
(Graphic) D.An-Pham/Science, (Data) David Sandwell

Nowhere will the new maps be as important as in understanding the ocean’s globe-girdling conveyor belt of currents.
The currents ferry heat from the equator to the poles, where the water cools and gains density until it plunges downward, carrying heat and carbon dioxide into the abyss.
But the flip side of this perpetual motion machine—deep ocean waters defying gravity and rising upward—has long been a mystery.
The “upwelling” was once thought to happen evenly across the ocean, driven by turbulent waves at boundaries between deep ocean layers of different densities.
Now, researchers believe it is concentrated at seamounts and ridges.
“There’s a zoo of interesting things that happen when you have topography,” says Brian Arbic, a physical oceanographer at the University of Michigan, Ann Arbor.

When ocean currents curl around seamounts, they create turbulent “wake vortices” that can provide the energy to push cold water up, says Jonathan Gula, a physical oceanographer at the University of Western Brittany.
In unpublished research, Gula and co-authors have found that these wake vortices make seamounts the leading contributor to upward ocean mixing, and a central player in climate.
Since the team relied on the old Scripps catalog, not the new one, the effect of the seamounts is probably even larger, Gula adds.

The seamount catalog is sure to expand further with Seabed 2030, an international project to accelerate high-resolution sonar mapping that Mayer is helping lead.
But space surveys will improve too.
NASA’s Surface Water and Ocean Topography satellite, launched in December 2022, can measure the height of a water surface to within a couple of centimeters.
Better remote sensing would be welcome, given the cost of sonar mapping voyages, Mayer says.
“I would love to see it threaten what I do.”
 
Links :

Tuesday, April 25, 2023

Rivalry between America and China has spread to the Indian Ocean


The world’s most powerful navies are swarming to a long-neglected maritime region

A“free and open indo-pacific”, intended to encompass both the Indian and the Pacific Oceans, is the hottest geopolitical slogan.
Yet when strategists talk about the Indo-Pacific they often mean just the Pacific, and then only the far-western part, around the South China Sea and the East China Sea.
It is there that a struggle for primacy is at its fiercest between America, dominant since the second world war, and a resurgent China.
Yet the Indian Ocean, relatively neglected until recently, is now having a moment.

The economic dynamism of its rim and great importance of the ocean as a hub for trade in goods and energy has long been recognised.
Now its strategic significance is catching up.
No single power holds sway in the ocean, and perhaps never will.
Yet China is making inroads into its waters and other navies also jostle there for influence.
A new oceanic era shaped by great-power rivalry has begun.
Smaller Indian Ocean countries wonder whether they will be victims of it, or beneficiaries.


The Indian Ocean stretches from the southern tip of Africa to the Malacca Strait between Malaysia, Singapore and Indonesia; and from the Persian Gulf to far south-western Australia: over 80 degrees of latitude and 100 degrees of longitude (see map).
It encompasses three-dozen continental and island states accounting for 12% of world gdp.
Around its rim live more than 2.6bn people, in countries with a dizzying array of topographies, cultures and economies.
On its waters are islands such as the Maldives at the cross-roads of strategic shipping routes.
Though tiny, they have exclusive rights to huge expanses of ocean.


Signs of sharpening rivalry are everywhere.
The navies of America, Australia, Britain, France, India, Japan and Singapore have all patrolled in the Indian Ocean this year.
In March the navies of China, Iran and Russia exercised there together.
America, Australia and Britain recently announced more details of a plan to base next-generation nuclear-powered submarines in Western Australia.
Last month Japan’s prime minister, Kishida Fumio, travelled to India to promise $75bn of investment across the Indo-Pacific.
Also in India there is wild speculation about a Chinese radar installation in nearby Sri Lanka and a Chinese listening post on Myanmar’s Cocos Islands.
Fear of China is pushing India into a closer relationship with America.

The transport across the Indian Ocean of oil and gas from the Middle East is vital for the vibrant economies of East and South-East Asia.
Most of these shipments pass through at least one of three geographic choke points.
The first is the Strait of Hormuz, the narrow exit from the Persian Gulf through which two-fifths of the world’s traded oil passes.
Another, the Bab-al-Mandab strait, lies between the Horn of Africa and the Arabian peninsula, with Eritrea and Djibouti on one side and Yemen on the other.
It is the gateway to the Red Sea and the Suez canal.
The third area of acute concern is the Malacca Strait, the main shipping channel between the Indian Ocean and Pacific.
Just 1.7 miles (2.7km) wide at its narrowest point at Singapore, it sees a fifth of global maritime trade.

Any malign force capable of throttling the choke points and other crucial entrances to the Indian Ocean would cause immense harm.
And Bab-al-Mandab and the Strait of Hormuz are both potentially vulnerable.
The Horn of Africa is notorious for piracy and Islamist militancy.
The threats to shipping are high.
As for the narrow Strait of Hormuz, in recent years a hostile Iran has seized or attacked merchant vessels and threatened to close the strait.
The Iranian navy is converting two merchant vessels into carriers for kamikaze drones.

Notwithstanding its relatively lavish security, the Malacca Strait has the highest incidence of piracy in the world.
In the event of a regional conflict, control of the strait would assume huge importance.
With four-fifths of its oil passing through it, China has for years obsessed over how easily a hostile power such as America could close the strait and so cripple the Chinese economy.

In this context, states with the naval capability to ensure that choke points and channels remain open not only protect their own legitimate interests but provide a global good.
These countries are today’s Indian Ocean powers.
And there are proliferating consequences to their growing naval presence.
Reconnaissance missions around choke points and other vulnerable places increase awareness of what is on the water and under it—including the submarines of potential adversaries.
As a result, strategic rivalries among naval states can sharpen even in peacetime, while maintaining open sea-lanes is a shared naval objective.
That is happening now.

The Indian Ocean’s Western, former colonial powers have been around longest.
The tropical island of Réunion remains an overseas department of France, which also owns remote islands in the Mozambique Channel.
They make France an Indian Ocean power with interests to defend.
Britain makes much of its regular Indian Ocean deployments, including a new aircraft-carrier.
Its ships join French ones on patrols and exercises.

Having neglected the waters of the Indian Ocean for years, the American navy is now upping its presence.
It has increased “freedom of navigation exercises” in the region.
It conducts additional exercises there with, among others, Australia, India and Japan, fellow members of the “Quad” security grouping intended to counter Chinese power in the Indo-Pacific.
America’s navy intends to resurrect its First Fleet, which was disbanded half a century ago, and base it in the Indian Ocean.

Although India sees its chief threats, Pakistan and China, as mainly land-based, it has the strongest naval presence in the northern part of the Indian Ocean.
It has increased naval co-operation with America because of concerns about China’s growing clout in the region.
It is also striving to fix many gaps in its naval capacity.

Australia has been an Indian Ocean power at least since it opened a submarine base in Fremantle during the second world war.
Its presence is about to get a huge boost from aukus, a defence-technology pact between America, Australia and Britain that will see next-generation nuclear-powered submarines based near the same port-city.
aukus is meant to counter Chinese military expansion in the Indian Ocean as well as the Pacific.
Singapore, despite being a small city-state, packs a naval punch, too.
In tiny Djibouti no fewer than eight outside powers maintain naval bases, above all America, France, Japan and, since 2017, China.

China is the new kid on the Indian Ocean block, with Djibouti its first ever overseas military base.
China’s naval capabilities have grown fast.
Gordon Flake of the Perth USAsia Centre, a think-tank, says it came as a shock to Australia when in 2014 a self-sustaining Chinese naval force appeared in the southern Indian Ocean to help search for the missing Malaysian Airlines flight 370.
China’s navy has since become the largest in the world by vessel numbers.
In Beijing, a debate about establishing an Indian Ocean fleet is under way.

China wants more and more distant bases for support and resupply.
Yet, Djibouti aside, it has been slow to secure them.
Persistent rumours that the Chinese navy is establishing bases in Hambantota port in Sri Lanka and Gwadar in Pakistan have not been substantiated.
China’s plans for a commercial port at Bagamoyo in Tanzania are sparking speculation about a naval base there, too.
According to Kate O’Shaughnessy, a former Australian high commissioner to Mauritius, “It is in really out-of-the-way places where China is playing a long game in building up its core infrastructure and access to the Indian Ocean.”

The smaller countries of the Indian Ocean view renewed interest by stronger powers with both satisfaction and alarm.
On the one hand, they suffer more than anyone from the instability caused by rogue-state or non-state actors (such as pirates, Islamists and drug smugglers) and so welcome naval patrols.
Growing strategic rivalry is also to their advantage when countries woo them with development goodies, such as infrastructure projects.

But, as Darshana Baruah of the Carnegie Endowment for International Peace, a think-tank in Washington, points out, small states fear being suborned by big ones for use in projecting power—as happened during the cold war.
Strategic rivalry between an American-led camp and China, if it does not take into account the interests of small countries, would be disastrous, says Abdulla Shahid, foreign minister of the Maldives.
“That would seriously undermine our security and our prospects.”

Conceivably, rivalry between the West and China could badly complicate smaller countries’ relationships with both camps, especially if big powers ignore the fundamentally different security priorities of smaller countries.
They care much less about military competition than about climate change; illegal, unreported and unregulated (iuu) fishing; plastics pollution; and oil spills threatening tourism.
In an era of great-power rivalry, small states, Mr Shahid concludes, must avoid being tied down.
That will mean doing business with China even if America and its allies disapprove.

There are plenty of things Western powers—and India—can do to counter China’s advances in the Indian Ocean besides deploying hard naval power.
Most involve recognising small countries’ distinct security priorities.
On climate, rich countries have promised cash and other help in adapting to rising seas and more extreme weather.
But most small states have yet to see it.
Helping small-island (but large-ocean) states protect their fisheries from the iuu scourge, including by Chinese vessels, would be another easy win.
Relatively small steps by big countries can be big wins for small ones.

The ever increasing rivalry in the Indian Ocean does not preclude surprising areas of partnership.
The navies of America and China co-operate in patrolling sea lines of communication off the Horn of Africa, for example.
Still, the regional security dynamic is growing more complex, multilayered and prone to miscalculations.
That is the Indian Ocean’s fast emerging new reality.
 
Links :

Monday, April 24, 2023

Diving Deeper: How AI is helping to map the way Western Australia protects its sea floor


The underwater communities of seagrass, macroalgae and other organisms off WA's coastline are vital to the survival of aquatic animals—and the overall health of our planet’s water systems. 
This is how researchers are using space, AI, and cloud technologies to help protect these habitats. 


Beneath the shimmering surface of Western Australia’s aquatic ecosystems lies a world teeming with life and activity – benthic habitats.
These submerged communities of seagrass, macroalgae and other organisms are not only vital to the survival of a diverse range of aquatic animals, but also play a crucial role in the overall health of our planet’s oceans and freshwater systems.
From nutrient cycling to sediment stabilisation and water filtration, benthic habitats are a true cornerstone of earth’s natural balance.

“Benthic habitats provide primary life support to a lot of the organisms that reside around the sea floor,” says Dr Renae Hovey, a researcher and Senior Lecturer in marine science at The University of Western Australia.
 
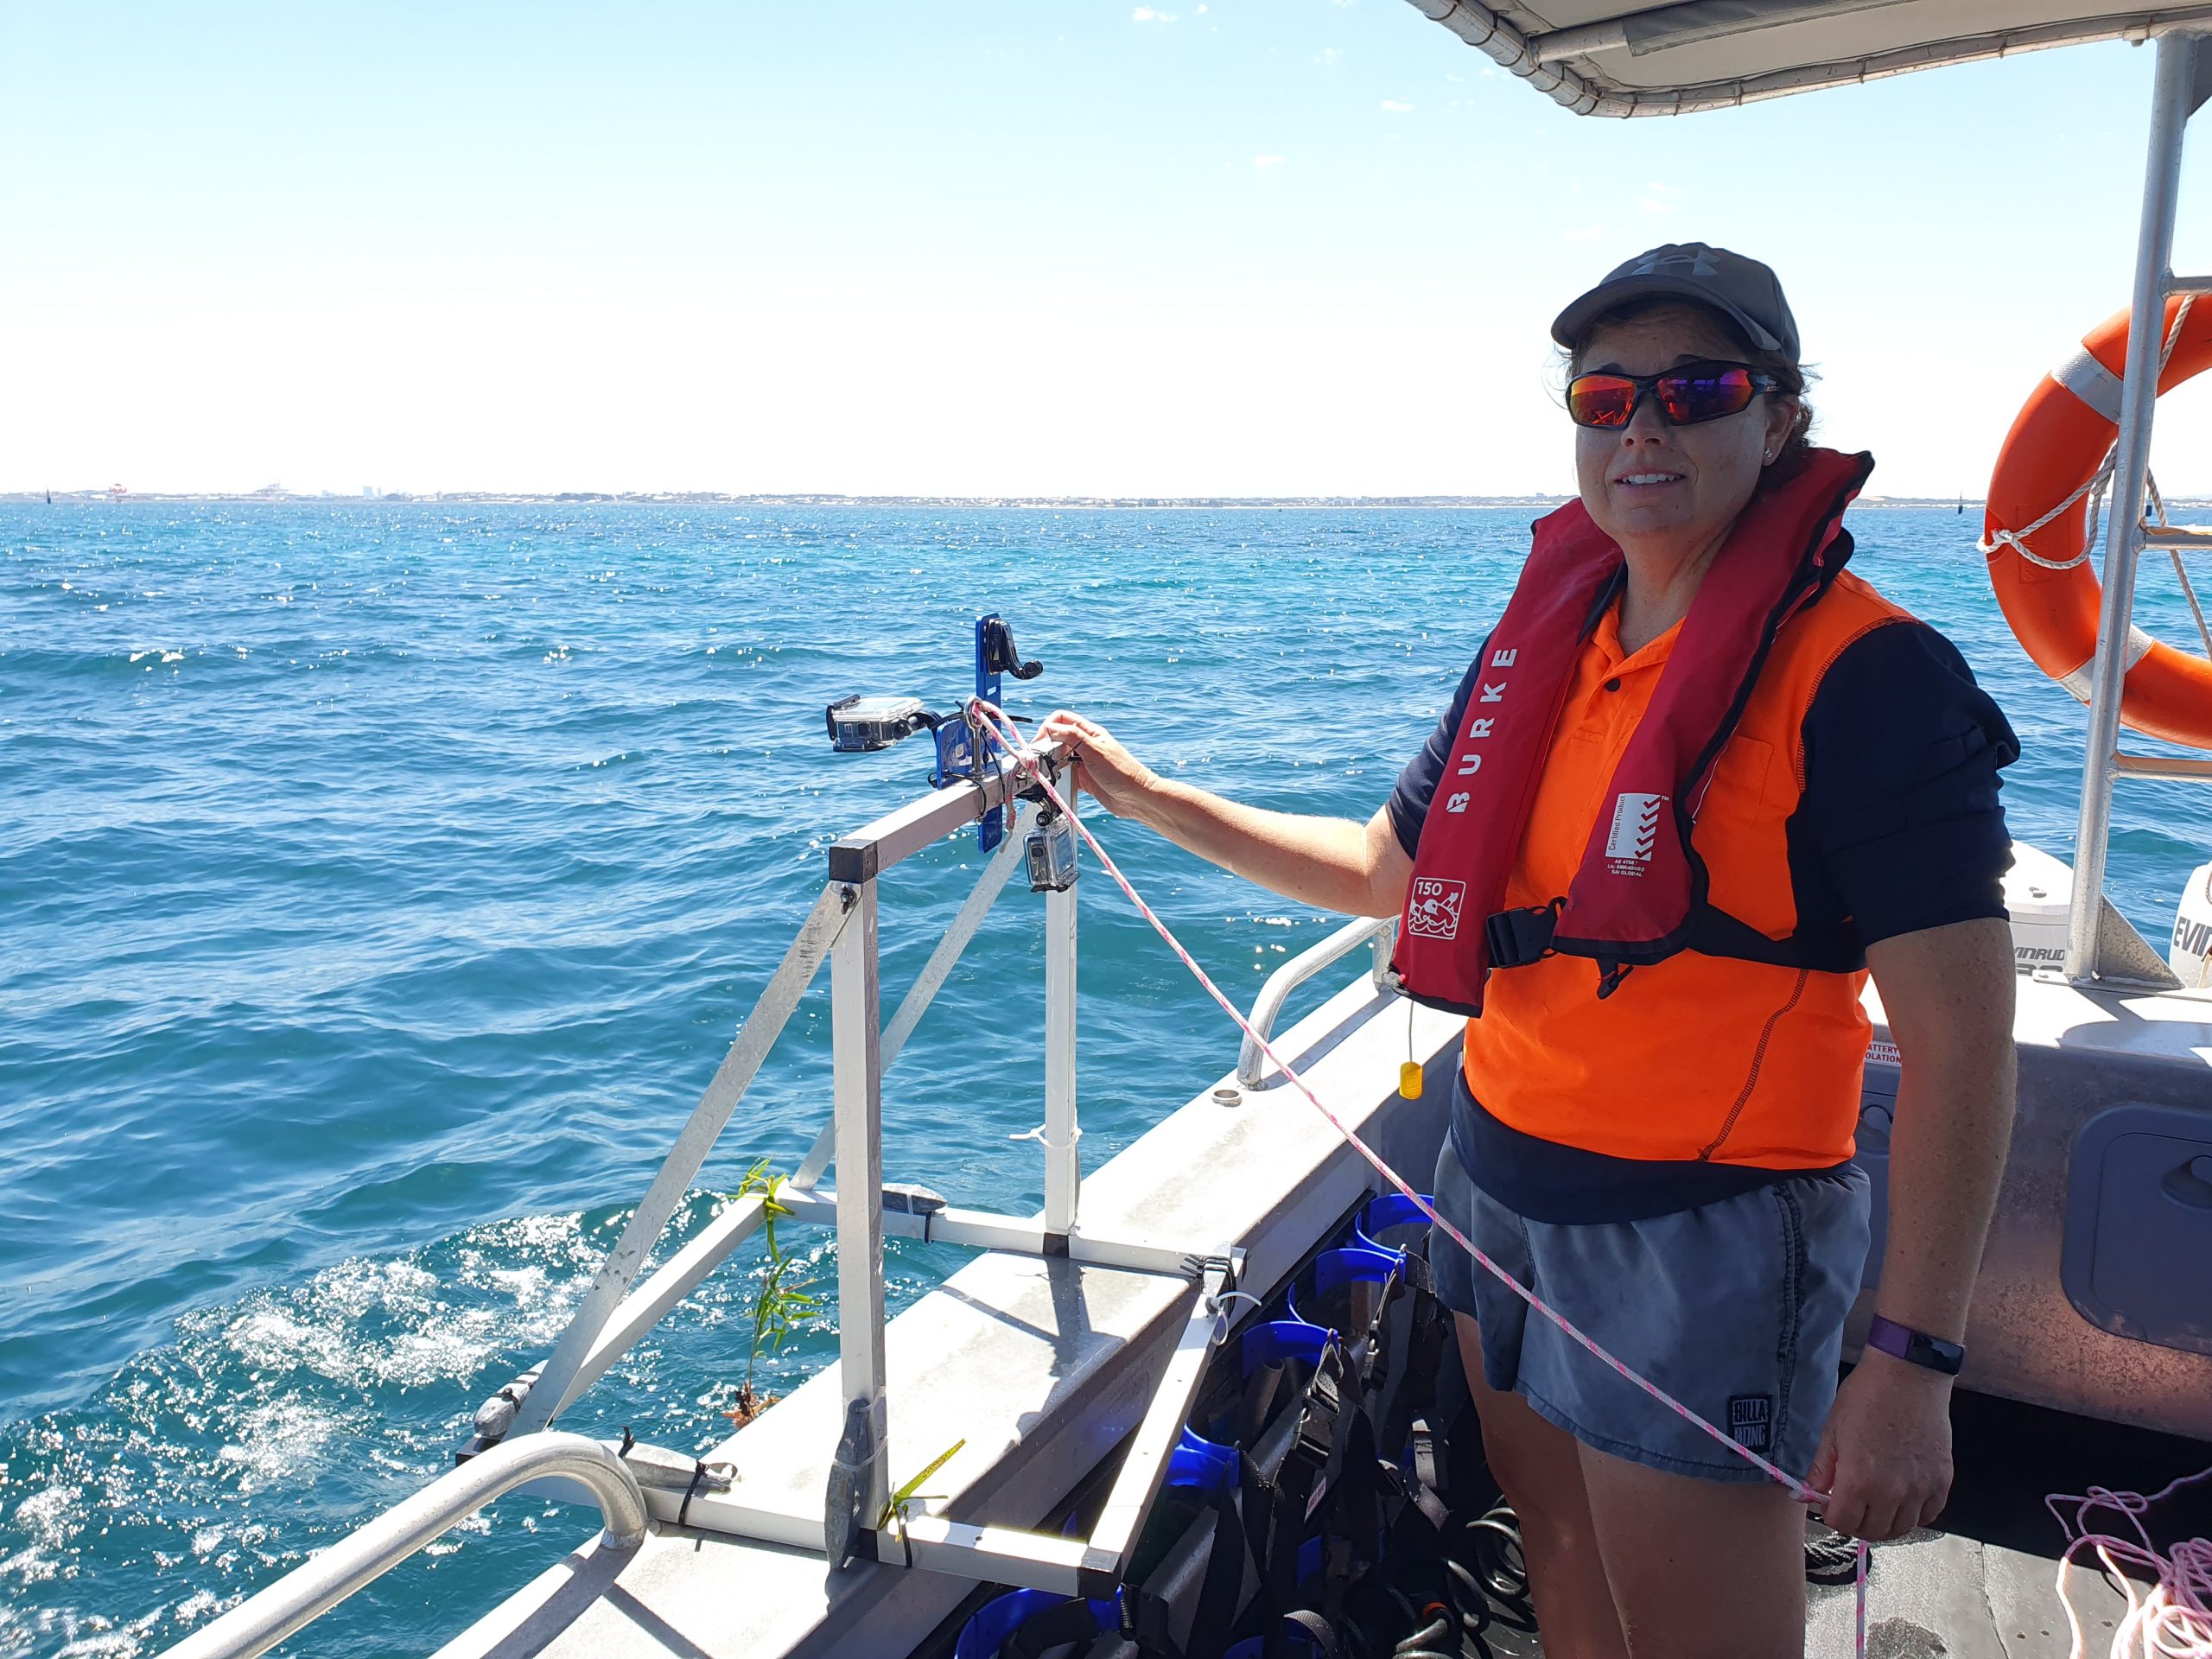
Dr Renae Hovey has been a lecturer at the University of Western Australia for over a decade.
She is now currently leading the research with WAMSI, embedding innovative technologies to map out benthic habitats across the Western Australia coastline
(Source: Dr Renae Hovey)

“For example, fish might use these habitats for shelter and protection from predators, or they might hunt for their food in amongst those organisms that are attached to the sea floor.”

However, Dr Hovey notes that benthic habitats face several threats to their own survival.
“There’s obviously climate change, which causes species to shift their distributions.
So, we might see more tropical benthic species where there used to be temperate benthic species,” she explains.
“This shift can alter the dynamics of the [marine] ecosystem and the types of animals that live there.”

Dr Hovey says there are other threats that cause a more rapid response in the ecosystem.
These include the physical removal of benthic habitats through dredging or coastal developments, or a degrading of the water quality.
“Off Western Australia’s coastline, we have what we refer to as low-nutrient water, so the water clarity is really good,” she says.
“But by adding nutrients, which usually come from land-based sources, we change the organisms in the water column.

That reduces the amount of light reaching the sea floor, and that has a huge negative impact on things like seagrasses and macroalgae, which need a lot of light to survive.

Filling knowledge gaps with benthic habitat maps


To better understand benthic habitats and how they’re affected by human activities, researchers like Dr Hovey create detailed maps of the sea floor.
These maps provide valuable insights for decisions about coastal developments such as the Western Australian Government’s Westport program.
The program features a proposed new container port with integrated road and rail transport networks, to be built in Kwinana.
 
 
This research project aims to help better understand the human impact of proposed developments on these habitats.
(Source: Dr Renae Hovey)


Benthic habitat mapping is one of 31 projects under a $13.5 million research program being undertaken by the Western Australian Marine Science Institute (WAMSI) in partnership with the State Government’s Westport Program.

Led by Dr Hovey, the three-year mapping project aims to improve stakeholders’ understanding of temperate benthic communities and processes – specifically seagrass, macroalgae and macroinvertebrates – in three areas relevant to the Westport program: Cockburn Sound, Owen Anchorage and Gage Roads.
It will fill knowledge gaps relating to these habitats, which will improve environmental impact assessments and natural resource management within the proposed development regions.
“There are lots of legacy issues in Cockburn Sound around poor human practices,” says Dr Twomey.
“Lots of pollution back in the 60s, 70s and 80s led to the loss of about 80 per cent of the seagrass, and it had a major impact on the fisheries and the ecology of that particular system.

We want to gain a better understanding of how seagrass survives in the system and what the drivers are, like the types of nutrients they need and their annual cycles.
And we want to use this knowledge to encourage seagrass to continue in this system and flourish.

The major challenge for Dr Hovey and her team of researchers was that traditional benthic habitat mapping methods are labour-intensive, time-consuming, costly and sometimes dangerous.
“Traditionally, a lot of underwater data is collected by divers, but it’s becoming harder and harder to actually get in the water and dive because it’s so expensive and time-consuming,” she explains.
“Plus, a lot of the things we need to be looking at are beyond 10 metres, so it becomes quite difficult to do a number of dives per day beyond that depth.”

Researchers also tend to spend hours each day manually classifying thousands of images, which leaves room for human error.
New mapping methods to unlock big time and cost savings

To increase the speed and accuracy of benthic habitat mapping, Dr Hovey and her team are trialling innovative remote sensing technologies that leverage Microsoft’s cloud, space and AI capabilities.

These include satellites that regularly capture high-resolution imagery of the sea floor in Cockburn Sound, Owen Anchorage and Gage Roads.
This data will then be fed into the Microsoft Azure cloud via Azure Orbital Ground Station for researchers to analyse.

Dr Hovey says satellites are particularly effective for mapping shallow coastal habitats that are close to shore.
“We can take a satellite image and then designate the different components of that image, which is usually based on pixel colour,” she explains.
“But to really be sure of what those different colours represent, we have to get into the field.
“If it’s shallow enough, we’ll usually deploy divers from a boat, and if it’s a bit deeper, we’ll deploy underwater cameras.
This allows us to take a closer look at what’s on the sea floor, and we use that information to ‘ground truth’ the satellite imagery.”

 
Seagrass are a critical part of a marine environment, providing food and shelter for many organisms that live there. 
(Source: Dr Renae Hovey)
 
Traditionally, human divers were needed to capture the data.
Now, WAMSI are trialing satellites and autonomous cameras to capture these images which are then fed into the Microsoft Cloud for AI processing. 
(Source: Dr Renae Hovey)

WAMSI’s research team is also using autonomous underwater vehicles fitted with cameras that take photos and videos, which will be uploaded to the cloud.
These vehicles are a game changer for mapping benthic habitats, according to Dr Hovey.

“They allow us to explore those deeper coastal habitats and take a look at what’s there on the continental shelf,” she says.
“We can pre-program these vehicles to go and collect the imagery we need, come back to the surface, and then we can pick up the vehicle and deploy it at our next site.”

Rather than requiring experts to annotate the hundreds of thousands of photos and videos collected by autonomous underwater vehicles, WAMSI’s research team is testing Microsoft’s Azure AI capabilities to process and classify this imagery.

“We’ve had some pretty good success with training an algorithm to detect and identify different seagrass species in Cockburn Sound, Owen Anchorage and Gage Roads,” says Dr Hovey.
“It gives us a really quick indication of whether these benthic habitats are changing, and whether it’s a positive or negative change.

It’s three orders of magnitude quicker to process the data using AI than it is to sit down and do it manually, which is huge in terms of saving time, but also saving on costs.

In addition to the time- and cost-saving benefits, Dr Twomey says AI will improve the quality of data that the researchers use to create benthic habitat maps.
“When you have a human in there, you have a very high risk of making mistakes or having differences between analysts,” he explains.
“But if you have the consistency of AI, you’re able to bring the error bars of those maps down and have much higher-quality data coming through.
“From an industry perspective, it also sets up a common data set, rather than having many disparate ones. So, it makes the job of the regulator much easier because industries are all working off the same regional habitat map. And it will result in better and faster decision-making.”
 
Links :