How users in Central and Eastern Europe are anticipating the arrival of Europe’s next generation of geostationary meteorological satellitesMeteorologists in Central and Eastern Europe say that data provided by EUMETSAT’s Meteosat Third Generation satellites will expand opportunities for nowcasting and storm prediction, and promote teamwork at all levels.
On 28 June 2014, an intense area of low pressure formed over the western Atlantic.
The system quickly evolved into Hurricane Arthur, the first named storm of the season.
Making landfall in North Carolina, US, and powering northwards along the coast to Canada, Arthur – a category 2 storm – blew down trees, damaged houses, cut power, and closed airports.
Predicting the exact nature and path of a hurricane is notoriously difficult.
Nevertheless, thanks to a multitude of Earth observations from space and ground, forecasters can provide a cone of uncertainty, representing the likely track of the centre of a storm.
What was impossible to forecast at the time, however, was the role that Hurricane Arthur would play in the formation of a
once-in-a-generation hailstorm that struck thousands of kilometres away in Bulgaria’s capital, Sofia.
 Sofia was hit by an unexpected hailstorm on 8 July 2014, with radar images clearly showing the heavy precipitation.
Credit: Hail Suppression Agency, Bulgaria.
Unseen impacts“A large, fast-moving air mass associated with the aftermath of the hurricane crossed the Atlantic, contributing to the largest hail storm Sofia has seen since 1941,” recalls Dr Christo Georgiev, a professor in the Forecasts and Information Service Department of Bulgaria’s
National Institute of Meteorology and Hydrology (NIMH).
“Using hindcasting techniques, researchers analysed the footprints left in satellite data and simulated the reverse trajectory of the air masses by numerical models.
They identified a strong relationship between conditions in the upper atmosphere and the development of the extreme weather in eastern Europe.”
On 8 July – days after Hurricane Arthur had dissipated in the Labrador Sea – an intense area of convective activity grew above eastern Serbia.
It then split into two major storms, one headed in the direction of Sofia.
Wind gusts of up to 125km an hour coincided with hailstones the size of baseballs.
More than 40 people were injured and damage exceeded 50 million euros.
“Data provided by EUMETSAT’s Meteosat Second Generation (MSG) satellites helped hindcast the role of a large plume of water vapour in the upper atmosphere, which mixed with moist air and large temperature gradients at lower altitudes, and seeded the conditions for the storm,” Georgiev says.

To better understand the impacts of Hurricane Arthur on the hailstorm in Sofia, experts combined images taken by NOAA’s Geostationary Operational Environmental Satellites (GOES) and EUMETSAT’s MSG spacecraft.
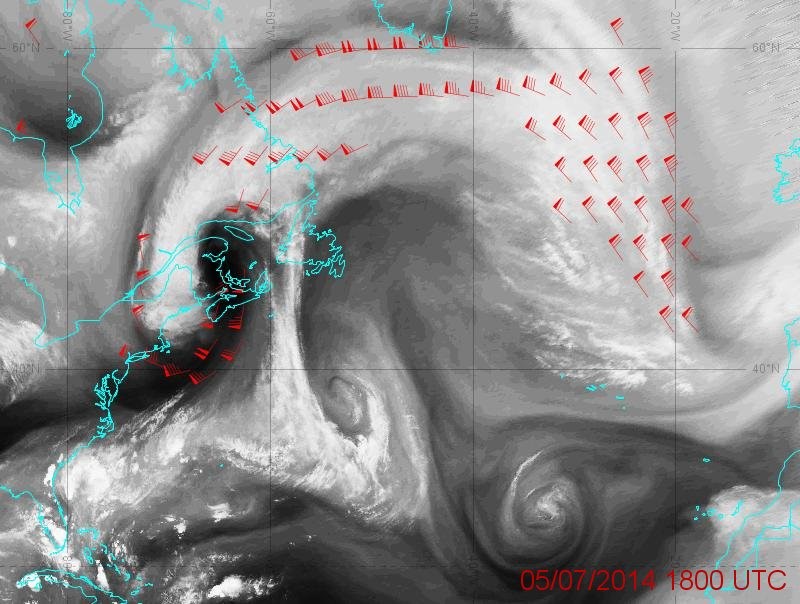 Large scale movement of water vapour in the atmosphere was tracked using the Action de Recherche Petite Echelle Grande Echelle (ARPEGE) global numerical weather prediction model.
Image courtesy of Karine Maynard, Meteo-France.“Water vapour, or general humidity, forms an important link between land and ocean, and is a crucial mechanism for transporting energy around the planet.
“Such mesoscale processes can also play a key role in extreme weather at regional and local levels.
But humidity is also one of the hardest variables to observe effectively over large areas.”
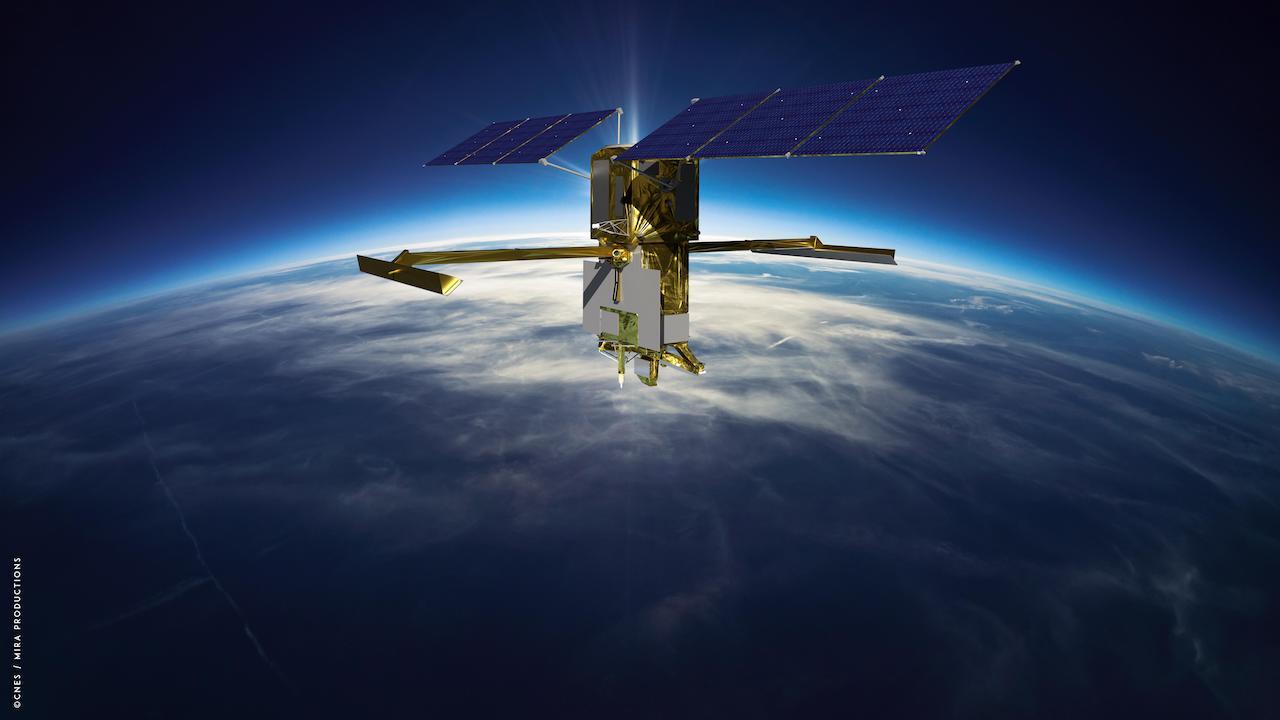
EUMETSAT’s
Meteosat Third Generation (MTG) satellites will play a vital role in turning such hindcasts into forecasts.
“To predict storms and their implications at a very local level, nowcasters must bring together and analyse as much data as possible, as frequently as possible,” Georgiev says.
“Meteosat satellites continuously have their eyes on the whole of Europe and beyond: they are in a superb position to meet this need.
“Meteosat First Generation satellites, beginning in the late 1970s, were the earliest geostationary meteorological spacecraft to feature instruments able to measure water vapour in the atmosphere from space.
“Since the early 2000s, Meteosat Second Generation has provided much more data, increasing the number of channels on the visible and infrared spectrum from three to 12.
This has enabled us to track water vapour and associated winds in the mid and upper atmosphere, with huge benefits for diagnosis and numerical weather prediction.
“Now, with the imminent launch of MTG satellites, we are looking forward to further increases in the amount, types, and frequency of data delivery.
This will help improve our ability to predict fast-evolving weather events, and hopefully turn more hindcasts into nowcasts.”
MTG’s first imager satellite will launch on 13 December 2022.
Multidimensional viewGeorgiev says MTG will help meteorologists build up a four-dimensional picture of humidity – and other key variables such as temperature – in the atmosphere in near-real time.
“The
Flexible Combined Imager aboard MTG’s Imager satellites will provide more detailed data on moisture and its circulation in the upper parts of the atmosphere,” he explains.
“It will also enable observation of water vapour at lower altitudes, something that’s not previously been possible using MSG measurements.
“New
hyperspectral sounding instruments on board MTG’s sounder satellites will enable meteorologists to detect the distribution and temperature of water vapour.
They will do this by providing vertical profiles of the ever-changing state of the troposphere, from the ground up to the stratosphere.
“The new
Lightning Imager, on the other hand, will provide continuous observations of lightning activity from space, providing comprehensive data on lightning flashes across Europe and Africa for the first time.
“Collectively, these observations will provide tremendous opportunities to enhance nowcasts, forecasts, numerical weather prediction models, land surface analyses, and much more.”

Like their predecessors, MTG satellites will have a constant eye on a substantial part of the Earth’s surface – image compiled using test data.
Credit: Image courtesy of Jan Kanak.
Capturing ‘overshooting tops’Another way MTG will benefit storm prediction is by providing more opportunities for meteorologists to detect “overshooting tops” – dome-like protrusions atop cumulonimbus clouds driven by large updrafts, which can indicate a storm may be about to strike.
“Early detection of overshooting tops presents a window of opportunity to nowcast intense storms and for authorities to issue warnings,” says Dr Jan Kanak, a physicist at the Slovak Hydrometeorological Institute (SHMI), who has been working with Georgiev and other experts from across Europe to prepare for the arrival of MTG data.
“But detecting them is highly challenging, not least because the timescales on which overshooting tops occur is very short, often in the range of 10 minutes or much less.
Current satellite missions enable scans of the Earth’s disk every 15 minutes, so there are still many that we do not see.
“MTG will provide observations more regularly, with rapid-scan data available up to every two-and-a-half minutes.
It will present an opportunity to detect many more overshooting tops – not only in visible channels but also in the infrared, which is invaluable for observing the Earth at night-time.
“We will also be able to better observe other important variables, including minimum cloud top temperatures – a vital piece of information for predicting the strength of a storm – to better know the size of water droplets within clouds and to integrate this data into nowcasts and forecasts.”
Kanak, who has worked at SHMI since 1985, also develops real-time processing software with the goal of ensuring that data collected by EUMETCast reception stations and the EUMETSAT archive have the greatest possible impact at the regional level.
Products developed by his team decompress, calibrate, georeference, archive, and visualise satellite data so that users can efficiently make sense of it and integrate it for their needs.
They are used in at least 11 countries across Central and Eastern Europe.
“By operating these products for Meteosat Second Generation, we have learned a lot about how to effectively organise training, update software, and provide a stable service for users,” he says.
“MTG presents an opportunity to open up such software and products to an even larger community of users.
“Getting the most out of MTG data requires teamwork at many different scales – at the global level, the European level, and the regional level.
“To ensure users such as nowcasters, forecasters and researchers are ready, a huge number of MTG user preparation activities have taken place or are in the planning.
“EUMETSAT and national meteorological and hydrological institutes have joined forces on crucial aspects such as the development of training activities, updates to products and services, and studies of test data to prepare users for the arrival of new data types – such as lightning data.”
Regional connectionsBoth Kanak and Georgiev say that such joint activities between countries in Central and Eastern Europe are essential for preparations to efficiently use MTG data.
For example, Bulgaria’s NIMH is one of the operational users of MSG processing software developed by Kanak in the Slovak Republic, providing feedback to support the testing of new applications and the development of a new, MTG version.
The pair first met at the 1994 edition of the EUMETSAT Meteorological Satellite Conference.
They later took part in the 2010
Data Access to West Balkan and East Europe (DAWBEE) project, providing technical support and training to beneficent countries.
“We introduced users not only to Red Green Blue (RGB) imagery from MSG satellites, but also Meteosat Meteorological Product Extraction Facility products,” Kanak recalls.
“These products help forecasters to monitor upper atmosphere divergence, and the occurrence of precipitation, drought, and fires.
 Software such as MSG Proc enables users to blend images from different MSG channels together to help make sense of storms.
Credit: Image courtesy of Jan Kanak.“In last few years we have also co-developed processing and visualisation capabilities for the common display of RGB imagery and lightning data from MTG’s new instruments – the Flexible Combined Imager and Lightning Imager.”
These new data types present challenges but also tremendous opportunities, Kanak adds.
“For meteorological understanding, it is very important to have data over all of Europe, because severe storms relate to local conditions, orography, and distance from the sea and ocean,” he explains.
“But in their final application they must be localised to our conditions.
Therefore, close collaboration with meteorological services to develop products and models specific to the region are also essential.
“In combination with initiatives such as the
European Weather Cloud, huge amounts of satellite data will ultimately be more easily accessible.
“Meteorological services across our region will be able to dedicate more time to furthering the meteorological aspects of products and ensuring that satellite data fulfil their maximum potential to benefit society and help save lives and property.”
Links :


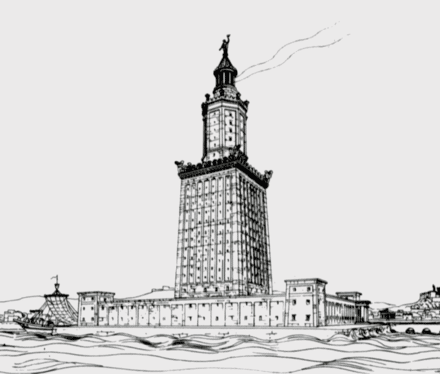

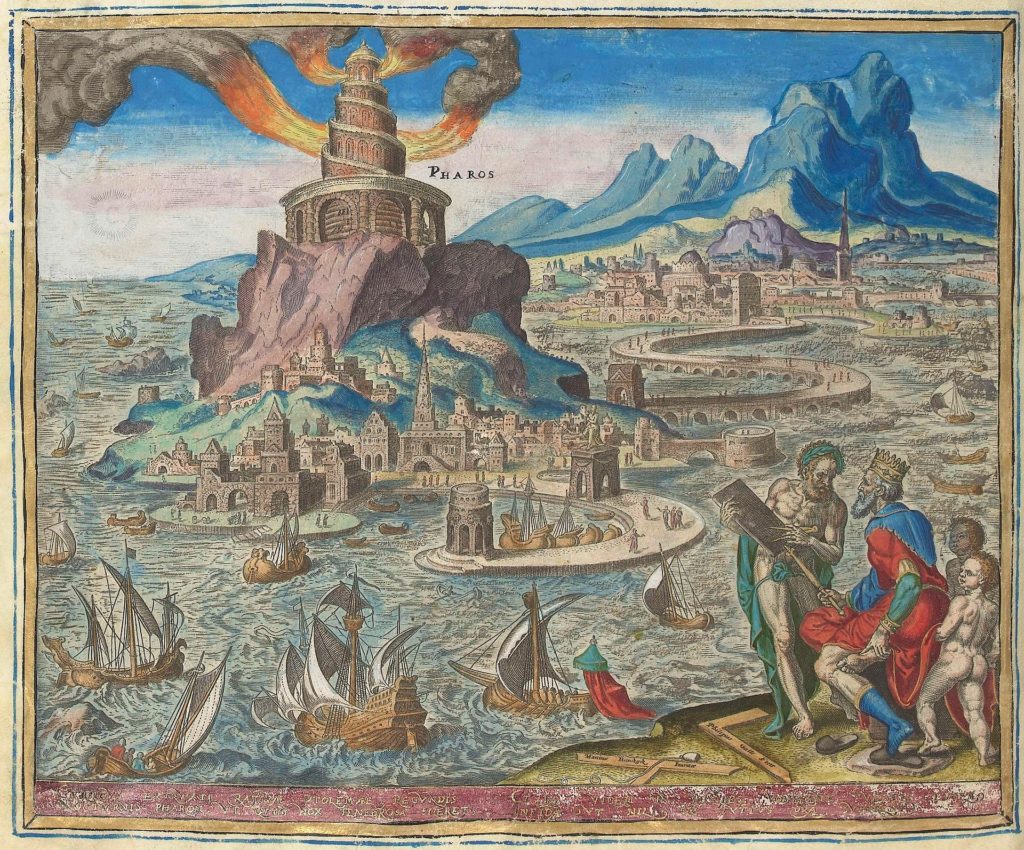 Lighthouse of Alexandria by
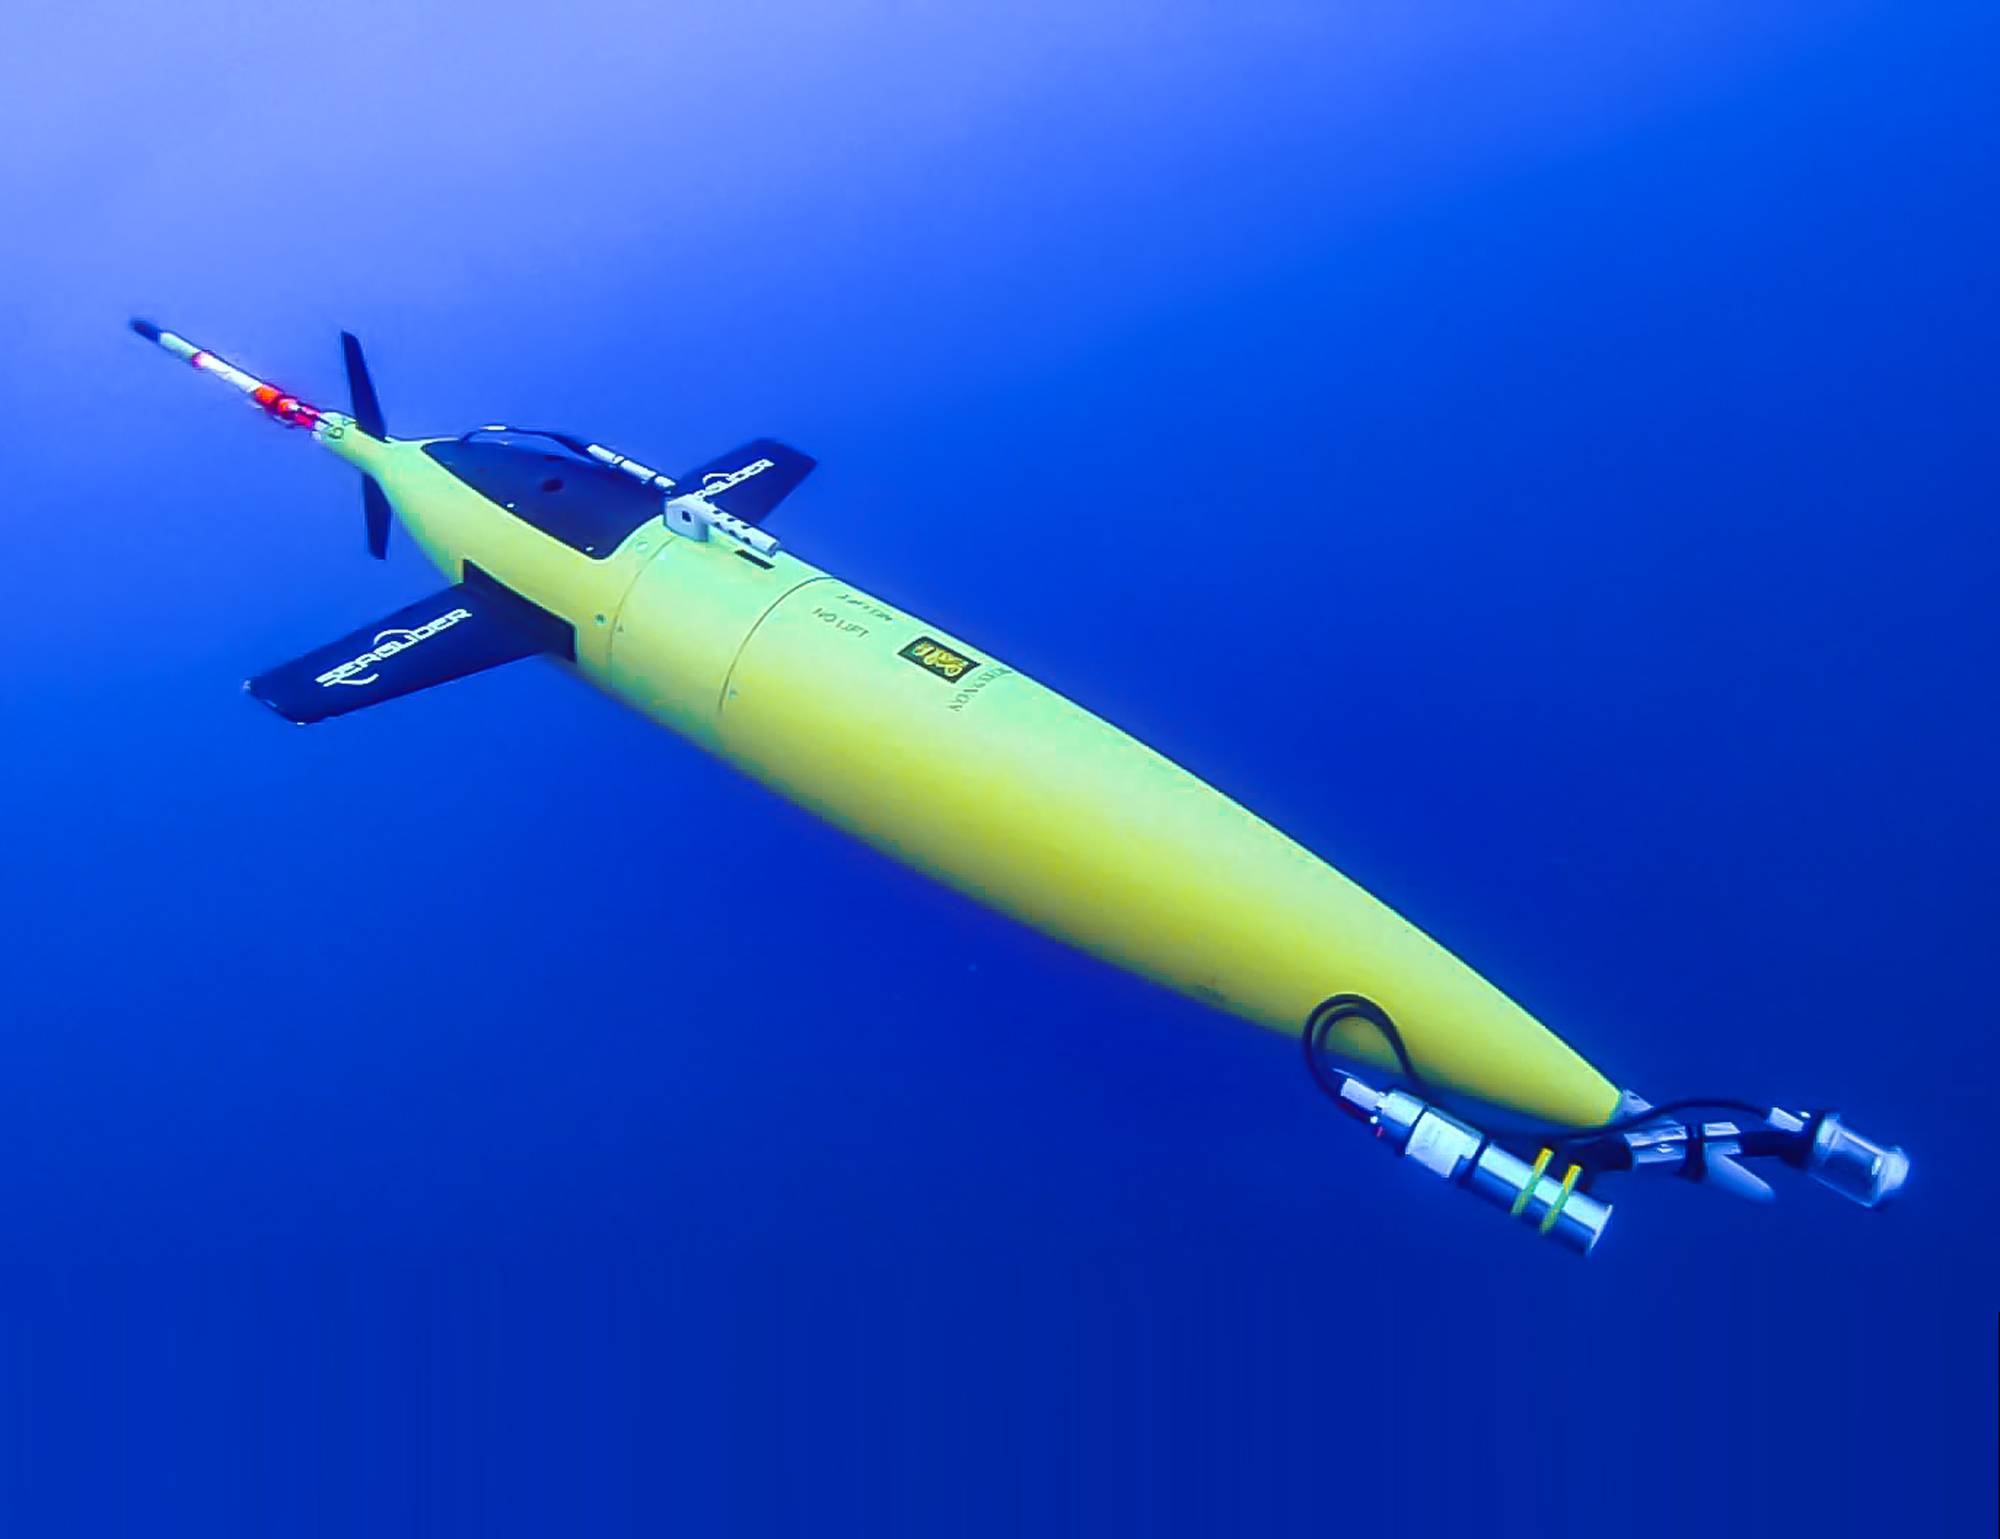
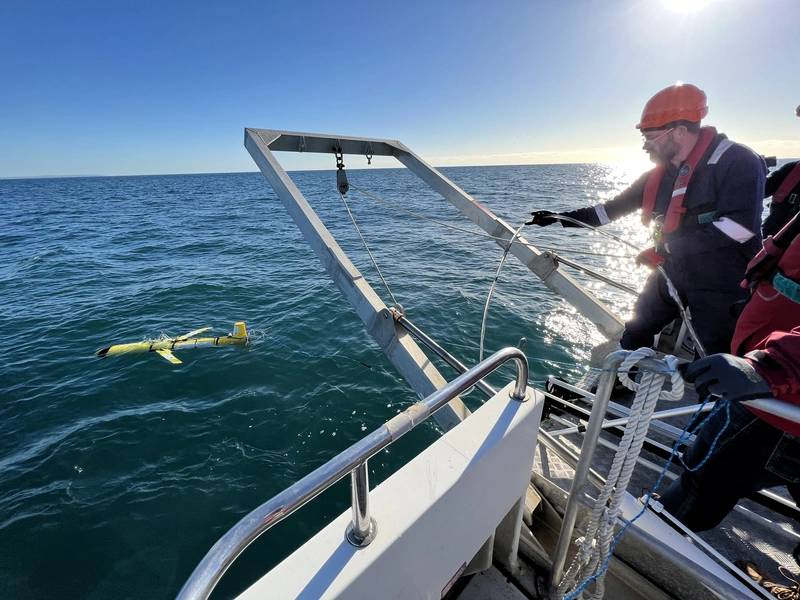 Blue Ocean Marine Tech Systems’ towed array deployment under the Royal Navy’s Project HECLA.