Saturday, April 23, 2011

My Drop of the Ocean : preserve the oceans buying a wave


The world's oceans need to be protected.
My Drop of the Ocean is where you can sponsor your favorite beach and donate your time and skills to the
Surfrider Foundation, a non-profit organisation dedicated to protect our oceans, waves and beaches.

So answer the call of the
Surfrider Foundation Europe to talk about the project My Drop of the Ocean .
Created in Europe in 1990 by 3 time World Surfing Champion Tom Curren, today it gathers more 3500 members and is represented by local chapters across France and Europe.
This site is part of a campaign (for care about environment and protection of beaches) and mobilization (gathering donations and applications for volunteering) : the money raised will go towards preserving the oceans.

The principle is simple: collecting donations offering bits of beach or waves.
They call it the drops (1 drop = 1 euro).

Follow these following steps to get started :
  • choose a destination from the map on your right
  • this is when you'll be asked to create a free account
  • when on the map, use + or - to locate your beach (or you can simply go straight to one on the more popular beaches)
  • zoom down until a grid appears
  • now click on 'select your drop'
  • make your selection then click on 'sponsor this drop of the ocean'.
PS: don't spend too much time to choose your boxes, so consuming electricity (hence the release of CO2)...

Links :

Friday, April 22, 2011

Modern Hydropalooza mapping contradicts seafloor ‘artifact’

The Hydropalooza mapping project in Kachemak Bay used the most recent technology available, a multibeam sonar that sweeps across the ocean floor to faithfully record its features.
>>> geolocalization with the Marine GeoGarage <<<

From HomerTribune

After NOAA’s Hydropalooza survey, Kachemak Bay’s sea floor more faithfully rendered in charts

Oyster farmer Ron Bader found an odd ocean floor formation recently while consulting his global positioning system.
Stretching east to west in
Cook Inlet, a perfect 90-degree angle appeared to map a giant ridge or trench-like formation.
The east-west leg, about 30 miles long, aligned with St. Augustine, while the other leg pointed toward magnetic north.

“After some 20 inquiries, there have been no viable answers to this vexing observation,” Bader said.
Some of these explanations have been an artist touch up on the photo or jet contrail, tide rips, or snow fence effect from cable or pipeline.”

Bader passed the GPS rendition of the trenching to various entities in his quest to find answers.
The mapping experts at NOAA provided some insight after
Kasitsna Bay Director Kris Holderied forwarded it to Anchorage.
Matthew Forney, the navigation manager for the Alaska Region with the NOAA Office of Coast Survey, examined it.
“It looks like what we call an ‘artifact,’ a difference in depths recorded in two actions,” Forney said.
“Two different surveys likely were spliced together, with the ridge indicating its seams. The source of the track line survey is the USGS branch of Pacific Marine Geology conducted in June of 1981. Google Earth may have uploaded the mapping data since that was the source of Bader‘s map.”

The discrepancy between maps all across the globe comes from there being different data of differing periods uploaded onto the Web, Forney explains.
“If this was the USGS survey in 1981, it looks like the L shape is created by the track line of that boat. We didn’t have a NOAA study in that area at the time. Technology now is vastly different,” Forney said.


NOAA’s latest 2008-2009 project mapping Kachemak Bay, called “Hydropalooza,” used a multi-beam sonar rather than the single-beam sonar used in the past when the data for the feature Bader saw was created.
The multi-beam sonar uses a swath out to each side to get full coverage of the ocean floor, with much greater detail than the lines of depth seen by a single-beam sonar.
Single beam works like a typical fishing boat fathometer, while multibeam collects data like a lawnmower.
But the Hydropalooza project boundaries didn’t include the portion of the bay with the apparent L shape formation.
Nonetheless, it provides a good example of where mapping is at nowadays and provides a caution to GPS and navigation aide users of just how outdated some of the accessible data out there may be.

“So much of the data on Alaska is vintage – it really is the last frontier in the science world, even though Alaska accounts for more than 35 percent of all the coast line in the U.S,” Forney said.
The last time the St. Augustine area was mapped was by a crew aboard the
NOAA Ship Rainier in 1983.
Forney gets many questions from people using chart plotters or other navigation aides. Whenever new information is available, he recommends buying the paper chart or updating navigation equipment with new disks.


False ‘L’ shape trench
>>> geolocalization with the Marine GeoGarage <<<

There’s more work to be done on the Kachemak Bay Hydropalooza project, Holderied said. Mapping has been done for the sea floor, but shoreline-mapping is not yet complete.
A NOAA aircraft mapped the coast on the north side of the bay from Fox River Flats to Bluff Point by Anchor River using a
LiDAR (LIght Detection And Ranging) instrument.
The airborne LiDAR sensor provides very high resolution information on coastal land elevations.
“When you think about the shoreline marked on a nautical chart – not many people think how that line gets created. Just like you survey with ship sonars to get accurate information to chart water depths with confidence, you need to do the same on land,” Holderied said.
“Only with LiDAR, that is done with an aircraft-based sensor that uses a laser to bounce light off land, whereas the ocean is mapped by bouncing sound off the bottom.”

Holderied said she is hoping that the south coast of the bay will be mapped if the NOAA plane is back up in Alaska for other missions.
“Hurricanes and the Deepwater Horizon oil spill took priority for aircraft missions the past two summers, so there’s no guarantee, but we still hope to get it done,” she said.
When the NOAA cartographers put together maps, they correct sea floor data for tides and other smaller effects. NOAA uses extensive quality control to prevent “artifacts” from combining data from different sources, Holderied said.
The primary correction is for the tide, which has to be calculated and subtracted from every sonar depth measurement.

“Apparent L-shaped bottom features can happen when two data sets are slightly mismatched along the edges where they meet, perhaps due to a difference in the tide correction.
In NOAA charting, we look for things like this and take them out,” Holderied said.

Within Kachemak Bay, the 2008-2009 Hydropalooza project did not find big changes in ocean depths.
“We didn’t find any thing different in a gross way, as expected, but there were features that were missed, like in the Jackolof trench where we found a previously unmapped, five-story tall bottom feature,” Holderied said.
“Having detailed information on sea floor shape will also significantly improve ocean circulation models used for oil spill response, fishery management and tidal energy studies.”

Some areas do see big depth changes, including Upper Cook Inlet, where big tides and storms shift sediments so much that NOAA sea floor surveys need to be done every three to four years.
Holderied said navigation safety is key for determining how often surveys must be done.
“If you’re in 1,000 feet of water and the depth changes by 30 feet, that doesn’t matter to shipping traffic. But if you’re bringing tankers in the shipping channels of Cook Inlet where the water isn’t that deep, a 30-foot change is a big difference,” she explained.

All of this works to explain mapping challenges and why some data becomes incorrect, but there’s one more piece of information to consider before Bader has all his questions answered.
He may have to ask Google Earth for the source of its data in the area of the apparent mapped trench.
Google does not have to cross-check between different data sets and perform the quality control that goes into data used for NOAA nautical charts.

As Forney wrote in an e-mail, “Google simply brings in all data sets that are available on the Web, including NOAA’s sea floor mapping data.”

Links :

Thursday, April 21, 2011

657 new islands discovered worldwide

A barrier island is a narrow island of sand that lies parallel to a shoreline.
Barrier islands buffer the mainland from storms and large waves formed in the ocean.

The area behind a barrier island— commonly called a lagoon—has relatively low-energy, enabling the formation of important environments such as marshes, flats, seagrass beds, and oyster reefs that could not form under the constant crashing of large waves.

From LiveSciences

Here's something you don't see every day — hundreds of new islands have been discovered around the world.

The Earth has 657 more
barrier islands (or barrier spits) than previously thought, according to a new global survey by researchers from Duke University and Meredith College in Raleigh, N.C.

The researchers identified a total of 2,149 barrier islands worldwide using satellite images, topographical maps and navigational charts.
The new total is significantly higher than the 1,492 islands identified in a 2001 survey conducted without the aid of publicly available satellite imagery.

Barrier islands often form as chains of long, low, narrow offshore deposits of sand and sediment, running parallel to a coast but separated from it by bays, estuaries or lagoons.
Unlike stationary landforms, barrier islands build up, erode, migrate and rebuild over time in response to waves, tides, currents and other physical processes in the open ocean environment.

All told, the world's barrier islands measure about 13,000 miles (21,000 kilometers) in length.
They are found along all continents except Antarctica and in all oceans, and they make up roughly 10 percent of the Earth's continental shorelines.
The northern hemisphere is home to 74 percent of these islands.

Barrier islands help protect low-lying mainland coasts against erosion and storm damage, and can be important wildlife habitats.
The nation with the most barrier islands is the United States, with 405, including those along the Alaskan Arctic shoreline.


The Mississippi - Alabama barrier islands (NASA)
>>> geolocalization with the Marine GeoGarage <<<

"This provides proof that barrier islands exist in every climate and in every tide-wave combination," said study team member Orrin H. Pilkey of Duke University.
"We found that everywhere there is a flat piece of land next to the coast, a reasonable supply of sand, enough waves to move sand or sediment about, and a recent sea-level rise that caused a crooked shoreline, barrier islands exist."

There, but overlooked

The newly identified barrier islands didn't miraculously appear in the last decade, said study team member Matthew L. Stutz of Meredith.
They've long existed but were overlooked or misclassified in past surveys.

Previously, for instance, scientists believed barrier islands couldn't exist in locations with seasonal tides of more than 13 feet (4 meters).
Yet the new survey identifies the world's longest chain of barrier islands along a stretch of the equatorial coast of Brazil, where spring tides reach 23 feet (7 meters).


A NASA image captured during a space shuttle mission in 1997 shows islands in Brazil's Gurupi River delta, along the equatorial coast of Brazil.
>>> geolocalization with the Marine GeoGarage <<<
Long mangrove-covered fingers (dark green in image), up to 25 km long and less than 5 km wide, are tipped with curved, narrow, sandy barrier islands (white strips in photo) and separated by funnel-shaped river mouths.
These islands change rapidly and some have eroded at rates of more than 50 feet per year.

The 54-island chain extends 355 miles (571 kilometers) along the fringe of a mangrove forest south of the mouth of the Amazon River.
Past surveys didn't recognize it as a barrier island coast partly because older, low-resolution satellite images didn't show a clear separation between the islands and mangrove, Stutz says, but also because the chain didn't match the wave-tide criteria used to classify barrier islands in the United States, where most studies have been conducted.

Scientists failed to consider that supplies of replenishing sand are so plentiful along the equatorial Brazilian coast that they can compensate for the erosion caused by higher spring tides.

Under threat

The new findings illustrate the need for a new way to classify and study barrier islands, so that scientists can predict which of today's islands might be in danger of disappearing in the near future, the researchers say.

The potential for significant climate and sea level change this century "underscores the need to improve our understanding of the fundamental roles these factors have played historically in island evolution, in order to help us better predict future impacts," Pilkey said.


Barrier Island cross section view

Barrier islands are under tremendous development pressure, which unfortunately is timed to a period of rising sea levels and shoreline retreat, Pilkey said.
A developed barrier island, held in place by seawalls, jetties or groins, can't migrate and "essentially becomes a sitting duck unable to respond to the changes occurring around it."

The study is detailed in the
March edition of the Journal of Coastal Research.

Links :

Wednesday, April 20, 2011

BP oil spill: the environmental impact one year on

In April 2010, the Deepwater Horizon explosion in the Gulf of Mexico killed 11 people and resulted in 4.9m barrels of oil being discharged, threatening marine life and hundreds of miles of coastline. Yet, one year on, what environmental impact did one of world's largest accidental oil spills have on the region's wildlife and habitats, and has it been as bad as it was feared at the time?

From BBCNews

Scientists have warned that it is too soon to attempt to offer a considered assessment on what impact the Deepwater Horizon oil spill, the largest of its kind, has had on the Gulf of Mexico's wildlife.

In short, they said, nature did not work in such a way that the full picture will present itself within just one year.
Also, they added, more data needed to be gathered in the months and years ahead to gauge the full extent of the incident, which covered such a vast area.

Dr Jane Lubchenco, the administrator of the National Oceanic and Atmospheric Administration (Noaa) - one of the federal agencies leading the clean-up operation - said there were reasons to be optimistic.
In an interview with the AP news agency, she said that the health of the Gulf is "much better than people feared", but the jury was out about what the end result would be.
"It's premature to conclude that things are good. There are surprises coming up - we're finding dead baby dolphins," she observed.

Researchers and conservation groups said it was difficult to access information being gathered as part of an investigation by a federal Natural Resource Damage Assessment (NRDA) process.
The NRDA is a formal framework in which government agencies look at the damage caused by the spill to natural resources and services - such as fisheries, wetlands, protected species, agricultural land - and calculate how much it would cost to repair the "injuries".

"What we know is very sketchy," said Claude Gascon, chief science officer for the National Fish and Wildlife Foundation.
"We have tried, and many others have tried, and it is almost impossible to get any idea what that group of agencies and researchers are actually finding.
"The simple reason for that is that there is going to be so much potential litigation in terms of settlements etc, " Dr Gascon told BBC News.
"So it is very difficult to know at the moment, the scale of the impact has been and will be in the future.
"All of us, including conservation organisations, professionals and academics, are keenly awaiting whatever the federal process will release into the public domain."


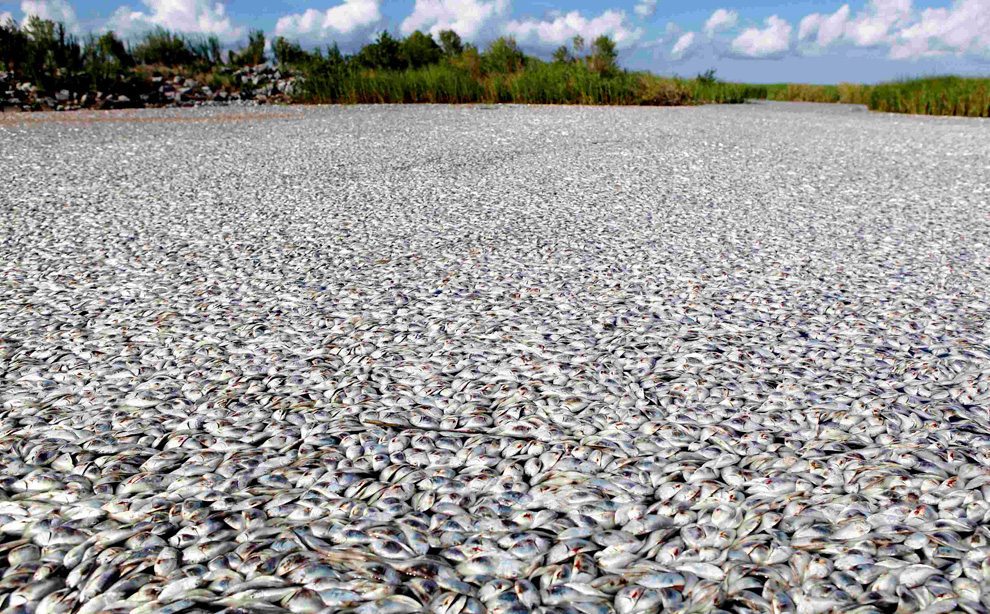
An overall view of a massive fish kill in the Bayou Chaland area of Plaquemines Parish in Louisiana is pictured in this handout photograph taken on September 10, 2010.
The cause of the fish kill has not yet been determined, but the area they were discovered in was impacted by oil from the BP oil spill.
Among the fish dead were pogie fish, redfish, shrimp, crabs and freshwater eels.
(REUTERS/P. J. Hahn/Plaquemines Parish Coastal Zone Management)

There was also agreement that it was too soon for long-term impacts to manifest themselves, such as disruptions to ecosystems' food chains.
This is why it was important for the data collection currently being carried out by the NRDA to continue, even if there was an out-of-court settlement, said Stan Senner, director of conservation science for Ocean Conservancy (testimony).

"It is too soon to draw any conclusions about impacts, especially within the marine environment," he told BBC News.
"We certainly cannot gauge long-term effects just 12 months after the spill.
"For example, there were things like the massive use of dispersants, which was unprecedented. And because the well was so far offshore (50 miles), there were undoubtedly many, many impacts that were out of sight and we may never have the capacity to work out what really happened.
"Right now, there are far more questions than answers."


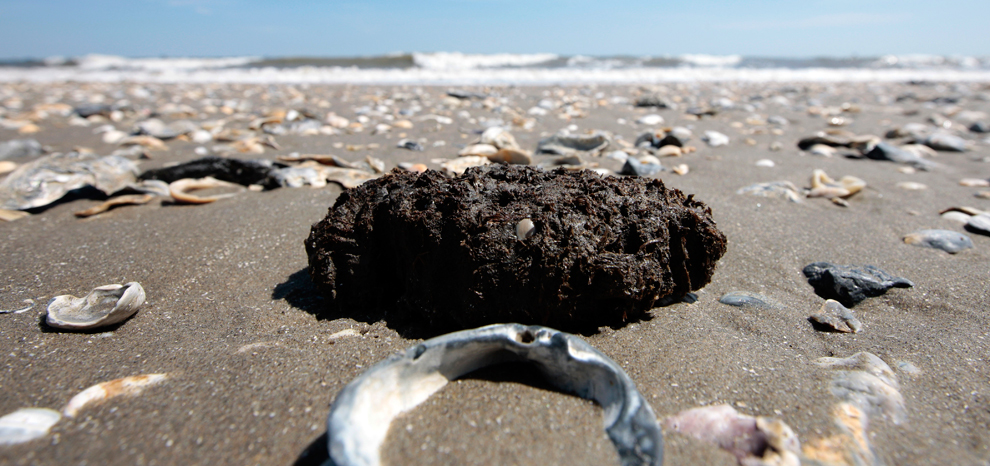
An oil tar ball washes up on Fourchon Beach in Port Fourchon, La. April 13.
Tar balls and oil are still in abundance on the Louisiana coast a year after the Deepwater Horizon oil spill.
(Dave Martin/AP)

Understanding risks

Referring to the NRDA, Dr Senner said: "If the process runs its full course, it could take several years, may be more, to go through the damage assessment studies, then develop a restoration plan and present a claim for the cost of restoration to the responsible parties."

During a similar process following the 1989 Exxon Valdez spill, Dr Senner - at the time - worked for the US government.

"We started that process and did our damage assessment studies," he explained. "But two years after the spill, the government and Exxon settled their claims out of court so that process never had to go through its full course.
"That may or may not happen [in the Deepwater Horizon] case, but one point I want to make very clear is that regardless of whether there is settlement or not, we strongly advocate that the scientific work continues.
"This will help us understand what happened, how long will the impacts last, how long recovery will take etc."

He said that the information would be vital for assessing the risk associated with future oil and gas activities.

The Arctic, with its vast untapped wealth in oil and minerals, has become the focus for a number of nations that are keen to stake their claim to the natural riches.

However, Dr Senner urged caution: "There is simply much less that is known about the Arctic region where oil development is proposed.

"If you look in the Gulf of Mexico, there is a relatively good baseline of environmental information compared with the Arctic.
"Also, there is a lot more capacity to respond to an oil spill in the Gulf; there is no capacity in the Arctic - there is not even a harbour on the Arctic slope of Alaska, which could be a staging base to respond to a spill."
Links :

  • Time : The BP oil spill, one year later: how healthy is the Gulf now?
  • WP : A year after BP oil spill, fate of gulf ecosystem remains murky (photos)
  • TheTelegraph : The Gulf of Mexico is not as clean as they say
  • NationalGeographic : A year after the spill, "unusual" rise in health problems
  • RollingStone : The Gulf Oil Spill, one year later, 'nothing fundamentally has changed'
  • TheIndependant : Deepwater Horizon, this was no Armageddon
  • NOAA : All federal waters of the Gulf once closed to fishing due to spill now open
  • BP video : a year of change

Tuesday, April 19, 2011

Add your local knowledge to the map with Google Map Maker for the US


From GoogleLatlong

Before
Google Map Maker—a product that enables people to add to and update the map for locations around the world—only 15 percent of the world’s population had detailed online maps of their neighborhoods.
Using Map Maker, people have built out and edited the maps for 183 countries and regions around the world, and now, due to the contributions of citizen cartographers, 30 percent of people have detailed online maps of the places they live.

Map Maker users have mapped entire cities, road networks and universities that were never previously recorded online.
These contributions have been incorporated into Google Maps and Google Earth, so the collective expertise of the Map Maker community benefits the millions of people using these products globally.

Today we’re opening the map of the United States in Google Map Maker for you to add your expert local knowledge directly.
You know your neighborhood or hometown best, and with Google Map Maker you can ensure the places you care about are richly represented on the map.
For example, you can fix the name of your local
marine electronic dealer, or add a description of your favorite yacht club.

You can help make the map complete in other ways as well, such as marking the
fishing area or adding all of the buildings on your favorite harbor so they appear in Google Maps.
We’ve seen incredibly detailed contributions from power users worldwide.
We’re eager to see you add the same level of detail to locations in the United States.

To confirm Map Maker user contributions are accurate, each edit will be reviewed.
After approval, the edits will appear in Google Maps within minutes—dramatically speeding up the time it takes for online maps to reflect the often-changing physical world.
To see examples of what people around the world are adding to Map Maker, you can
watch mapping in real-time.

In addition to opening Map Maker for the United States, we’ve added some new features for users globally.
You can now get a street-level perspective on places with Street View imagery directly in Map Maker, see and edit all points of interest, and find exactly what you’re looking for with advanced search options.

To learn more, check out our
getting started site, or start mapping now at mapmaker.google.com.

Links :
  • CNET : Google, map your own neighborhood
  • TED : Lalitesh Katragadda, making maps to fight disaster, build economies

SmartBird robot flaps and flies like the real bird


"It is amazing to watch and all the more amazing when you realize that it flaps its wings and all of the control is via a torsion drive which twists the wings during each flap.
The whole thing depends on the constant intervention of the software to keep it under control."

From
Wired

This beautiful, swooping bird is actually a robot. It’s called the
SmartBird, and it is made by Festo.

The wonders of this robot bird are manifold, not least the bird’s outward design, which looks like a King of the Rocketmen-era spacecraft.

The bird weighs just 450g, or around one pound, and has an ingenious drive mechanism. Inside, a motor controls the up/down movement of the wings by spinning two wheels inside the torso.
These are connected, like the wheels on a steam-train, by rods that produce the periodic up-down movement.
The complex rod design uses levers to make the wing tips flap faster.

The second part uses “torsional motors” to adjust the angle of the wings.
On the up-stroke, the front edge of the wing points up.
This reverses as the wing pushes down, forcing the bird forward.

Steering is done by moving the tail, and the eery, is-that-thing-alive? effect is achieved by moving the head from side to side, as if it can see you.

The light weight and sophisticated, yet simple design let the bird almost glide, and it can even take off and land unassisted.
You can control it with a Zigbee radio, or you can just let it glide through the skies alone.

But the most striking thing is just how much like a real bird this SmartBird moves.
Until you get a closeup of its cyberman-like exterior, it could easily pass for the real thing.
The military surely has its eye on this, although adding much in the way of a payload may mess up the power-to-weight balance.
But imagine a flock of these all gliding quietly and gracefully towards you, you unsuspecting dolt, and then raining down fire and death from above.

I would be fine.
Ever since a dream I had as a child, I have never, ever trusted evil seagulls.
I actually plan to catch a few of these SmartBirds and make a real-life Angry Birds right up on my roof terrace.

Links :

Monday, April 18, 2011

Humpback whale song spreads to other whales


From BBC

Recordings of male humpback whales have shown that their haunting songs spread through the ocean to other whales.

Researchers in Australia listened to hundreds of hours of recordings gathered over more than a decade.
These revealed how a specific song pattern, which originated in Eastern Australia, had passed "like Chinese whispers" to whale populations up to 6,000km away in French Polynesia.
The findings are reported in the journal
Current Biology.

Cultural ripples

The research team, led by
Ellen Garland from the University of Queensland, say the findings show the animals transmit such "cultural trends" over huge distances.

"Within a population, all males sing the same song," Ms Garland explained.
"But that song is constantly changing. So we wanted to look at the dynamics of songs throughout an ocean basin."
To do this, she and her colleagues studied recordings of 775 humpback whale songs, taken by scientists from the
South Pacific Whale Research Consortium.
"Lots of different sounds make up each song," Ms Garland explained.
"There are low frequency moans, groans and growls then higher cries and shrieks and all variations of ascents and descents."

Repeating the verse

Patterns of these sounds make up phrases, and the whales repeat the phrases - like repeated verses - for up to 30 minutes.
Using sound analysis software, Ms Garland and her colleagues discovered that four new songs that had emerged in a population in Eastern Australia gradually spread westwards.

Within two years of this new song being invented, whales in French Polynesia were singing this same "version".
"It's a culturally-driven change across a vast scale," said Ms Garland.
The researchers think the whales in the South Pacific may hear and learn songs during their annual migration to their feeding grounds in Antarctica.
"The East Australian population is the largest in the region with over 10,000 humpbacks," Ms Garland explained. Since there are more of them singing, these whales may have more influence on what songs "catch on".
Peter Tyack, a biologist from Woods Hole Oceanographic Institution in Massachusetts, US, said the results showed "a new way to look at culture in these animals".

The mammals produce the sounds by forcing air through their nasal cavity
"These are very mobile animals; they can swim hundreds of kilometres in a day... and their song carried very well underwater," he said.
"So all it takes is a few roving males acting as cultural ambassadors to spread their songs [from population to population]."

Singing giants

Although there is still some debate whether male humpbacks' songs are directed at females or each other, most scientists agree that the song plays a role in reproduction.
Dr Tyack explained: "We have good behavioural observations of singers competing with each other and of females moving to join the singers, so we think it's associated with mating."
Dr Patrick Miller from the Sea Mammal Research Unit at the University of St Andrews, UK, said that this study suggested that "some large-scale, previously undetected, factors drive the year-to-year changes in humpback song".
"We can only begin to speculate what those factors might be, but exploring this will certainly open a new understanding into the lives of these truly cosmopolitan, singing giants."

Links :
  • Wired : Listen Humpback whale songs that swept the Pacific

Sunday, April 17, 2011

Extreme Sailing Series : A major collision, 4 capsizes, 1 broken mast in one day


Check out this dramatic compilation of the four dramatic capsizes from Act 2 Qingdao, day 3.

The Wave, Muscat (OMAN), Red Bull Extreme Sailing (AUT), Team GAC Pindar (GBR) and Oman Air (OMAN) .

It was the very gusty conditions that tested some of the world's best sailors to their limits, and beyond, with 3 to 23 knots, and up to 30 knots by the final race.
Never in four years of the Extreme Sailing Series has there been so much drama in one day.