Saturday, April 14, 2018

Mullet mania

 Drone footage highlights the spectacle of hunters and mullet
converging in the shallows off Singer Island.

A school of mullet dances in synchronicity off Singer Island.

From Hakai Magazine by Michael Patrick O’Neill

As the striped mullet rebounds in Florida, the fish’s fall migration sparks an increasingly spectacular frenzy of activity.

September in southeast Florida is one of the hottest, stickiest months, yet there are subtle clues the season is changing.
Mirroring the dark clouds that unleash late summer downpours along the coastline, massive schools of baitfish suddenly appear along the beaches, sparking a torrent of activity.


Each fall, migrating mullet form dense schools along the coast of Florida.
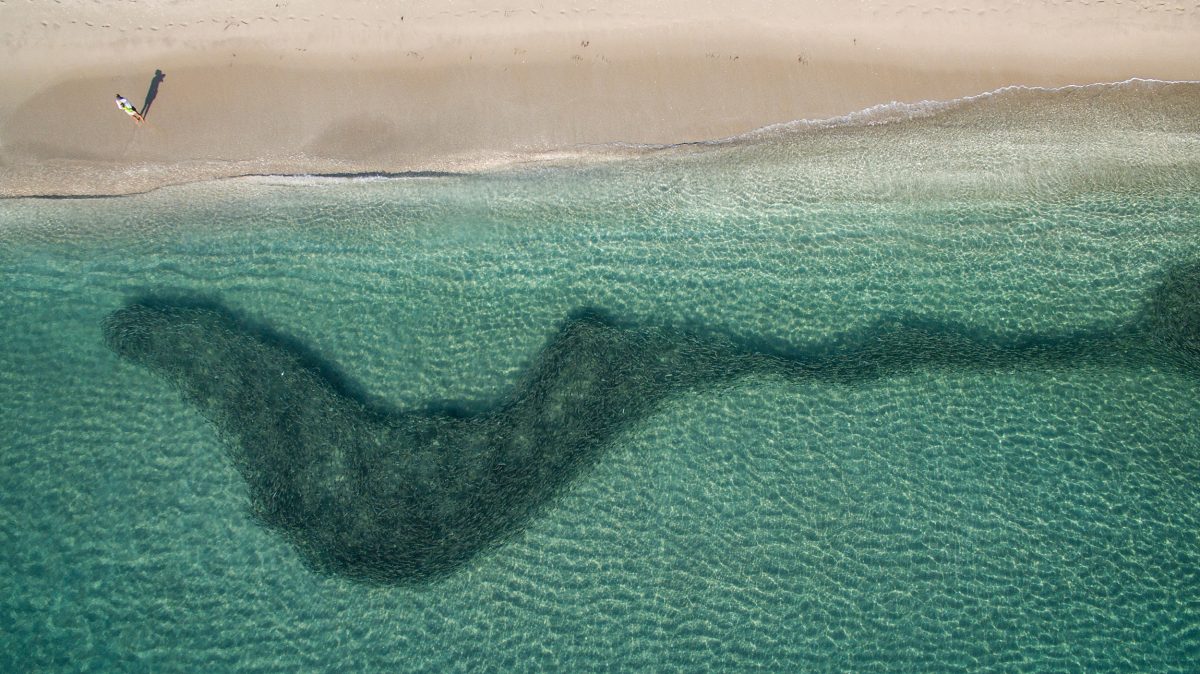
Viewed from above, a school of mullet snakes through the clear shallows of Singer Island, as a single beachgoer looks on.
Photo by Michael Patrick O’Neill

The fish—striped mullet—abandon coastal rivers, tidal creeks, bays, and estuaries all along the Florida coastline where they spend the majority of the year, responding to triggers scientists still don’t fully understand, explains ichthyologist and fisheries biologist George Burgess from the Florida Museum of Natural History.
The cues might include dropping water temperatures, or shorter days.
The enormous schools the fish form resemble oil slicks as they pulsate slowly along the coast before eventually heading offshore to spawn.

These tight schools, known as bait balls, are protein-rich, all-you-can-eat swimming buffets for finned and feathered predators.
Sharks, tarpon, jack, bluefish, and birds discover them and follow in hot pursuit, day and night.
When attacked, the banana-sized mullet launch themselves out of the water like fireworks.
The spectacle is a flashy example of a conservation success story.
Mullet, which are targeted for food and for bait and can be found in warm waters around the globe, have made a resurgence here in the past two and a half decades.
Every year, the abundance of mullet and the marine life it attracts gets more impressive; I’ve never seen anything quite like it in 25 years of wildlife photography.

Resembling an oil slick, a school of mullet over one kilometer long makes its way south past Singer Island, one of the best locations in Florida to observe the natural phenomenon.

One day during the migration, lifeguards and tourists gave me funny looks when I waded into the chocolate-colored surf with my underwater camera to photograph the chaos.
Around me, desperate baitfish leapt out of the water to evade predators and landed on the hot sand.
Those that escaped marauding birds and didn’t suffocate were thrown back into the fray by well-intentioned Samaritans.

To get to clearer water where I could safely document the activity, I had to cross a 20-meter band of murky runoff from recent storms where shark fins were carving figure eights through a boiling mass of fish.
These medium-sized sharks, all blacktips, are abundant and love to hunt in the shallows.
While they’re strictly fish eaters, they occasionally bite swimmers and surfers, especially in a feeding frenzy.
One of the cardinal rules for swimming with them is to cover yourself in black neoprene, but I had forgotten my wetsuit at home.
My long-sleeved T-shirt and loud, lime-green shorts would have to do.
My bare legs must have looked like giant drumsticks underwater as I kicked furiously toward the clear water.
Finally safe, I caught my breath and could see sharks and tarpon—giant silver game fish reaching up to two meters in length—corralling an enormous bait ball and attacking it.
It turned into an exhilarating 12-hour day that capped off a three-year personal project filming and photographing the migration.

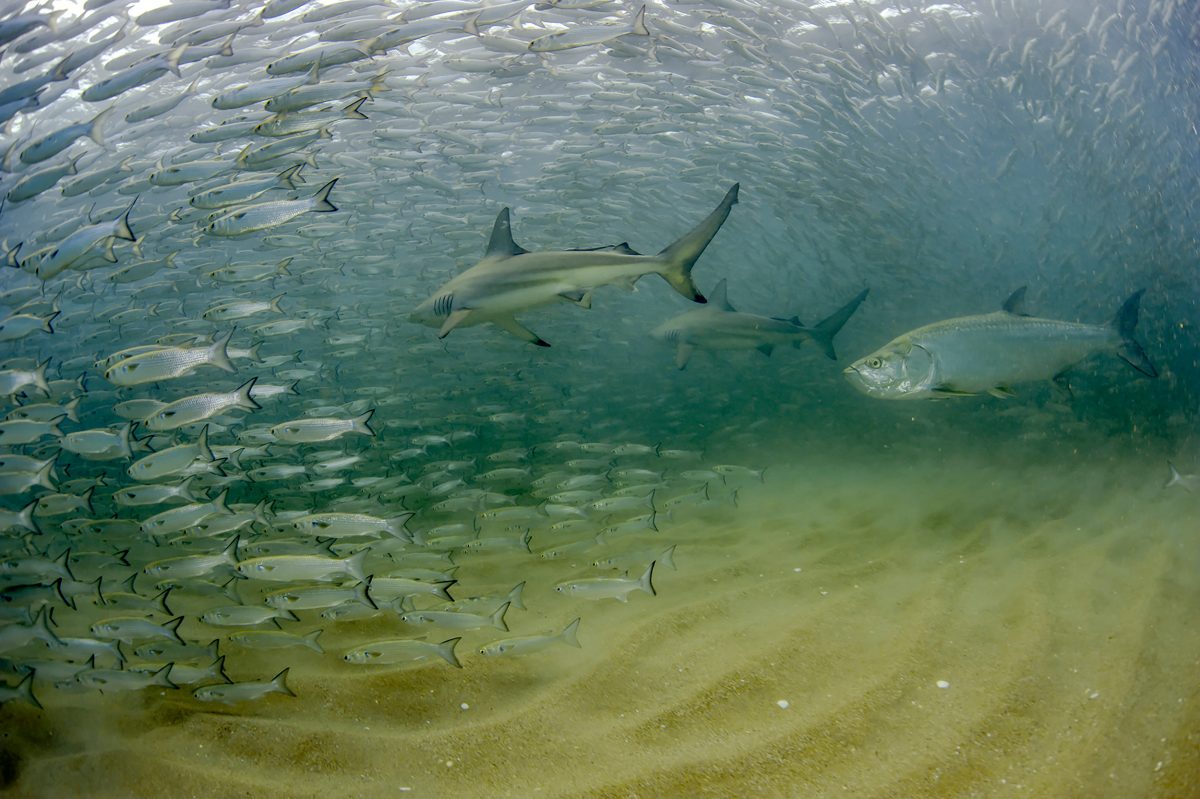
Two blacktip sharks and a tarpon hunt a massive mullet bait ball near the beach on Singer Island, Florida.
The predators’ strategy involves trapping the baitfish in the shallows in a tight school and then striking at the formation.

In 1994, Florida voters concerned about their fish stocks opted to implement a net ban.
It prohibits the use of gill and entangling nets, and blocks the use of large seine nets within the nearshore area, which has given striped mullet and other species a chance to recover from overfishing.

Commercial fishermen complained loudly, claiming the decline in stocks was the result of environmental degradation and habitat loss, not overfishing.
For generations, those nets had sustained them.
While many faced hardship and left the trade, some adapted and switched to smaller cast nets, or turned to aquaculture.

Twenty-three years after the net ban, the mullet is back.
Burgess and spokespeople from the Florida Fish and Wildlife Conservation Commission say the ban was not a panacea, but it did have a positive impact overall and also helped minimize by-catch of non-targeted sea life.

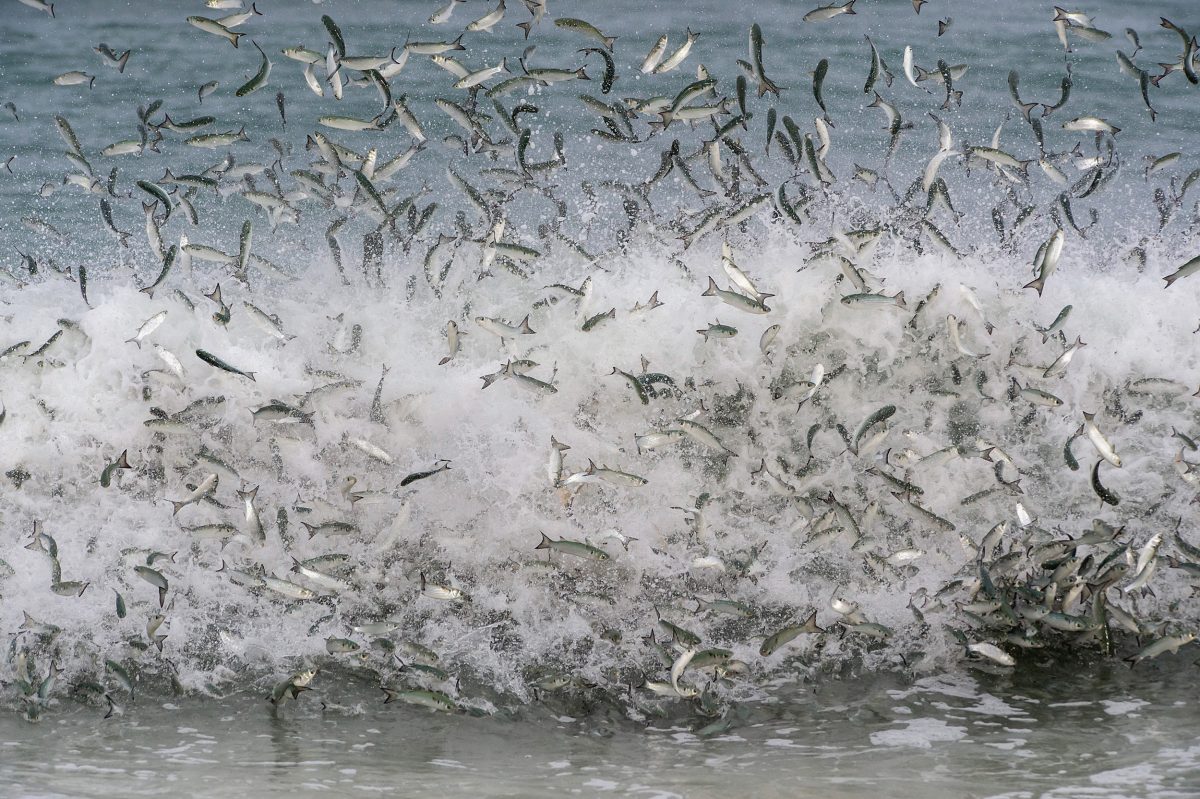
Mullet explode out of the surf like nature’s fireworks in an attempt to escape predators.

Now, one of the most pressing issues for those who care about the future of Florida’s fish is water quality.
To prevent flooding and preserve aging dikes, the US Army Corps of Engineers flushes billions of liters of fetid, contaminated agricultural runoff from Lake Okeechobee into estuaries on both coasts nonstop for months during the rainy season.
Images of putrid water and algae covering once-pristine estuaries—home to various types of mullet and many endangered species like manatees, sea turtles, and sawfish—have become commonplace on the local evening news, as have angry citizens protesting and politicians promising change that never comes.

By late fall, Florida’s schooling mullet eventually set course for the open ocean.
Prolific spawners, they release millions of fertilized eggs into powerful currents like the Gulf Stream, and the little ones that survive eventually settle in the same neighborhoods as their parents to repeat the life cycle.

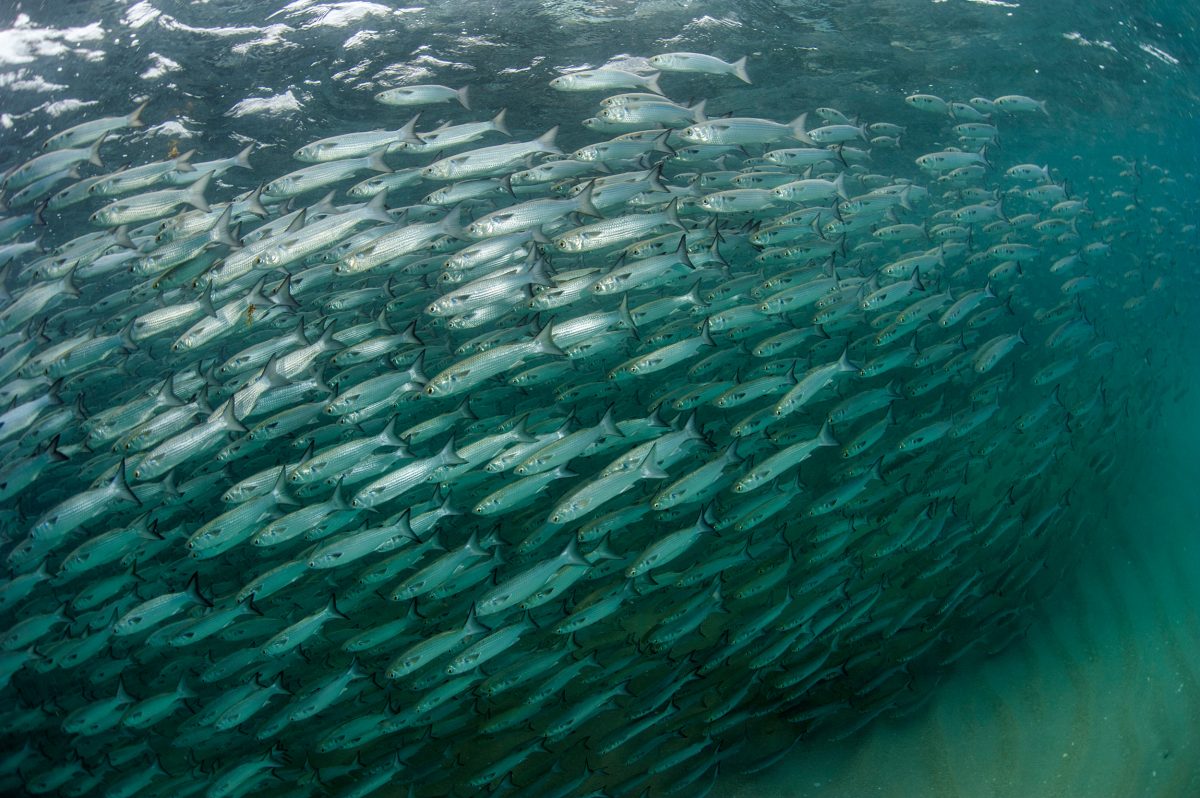
A school of mullet swims in a tight, synchronized formation as it is pursued by blacktip sharks and tarpon.

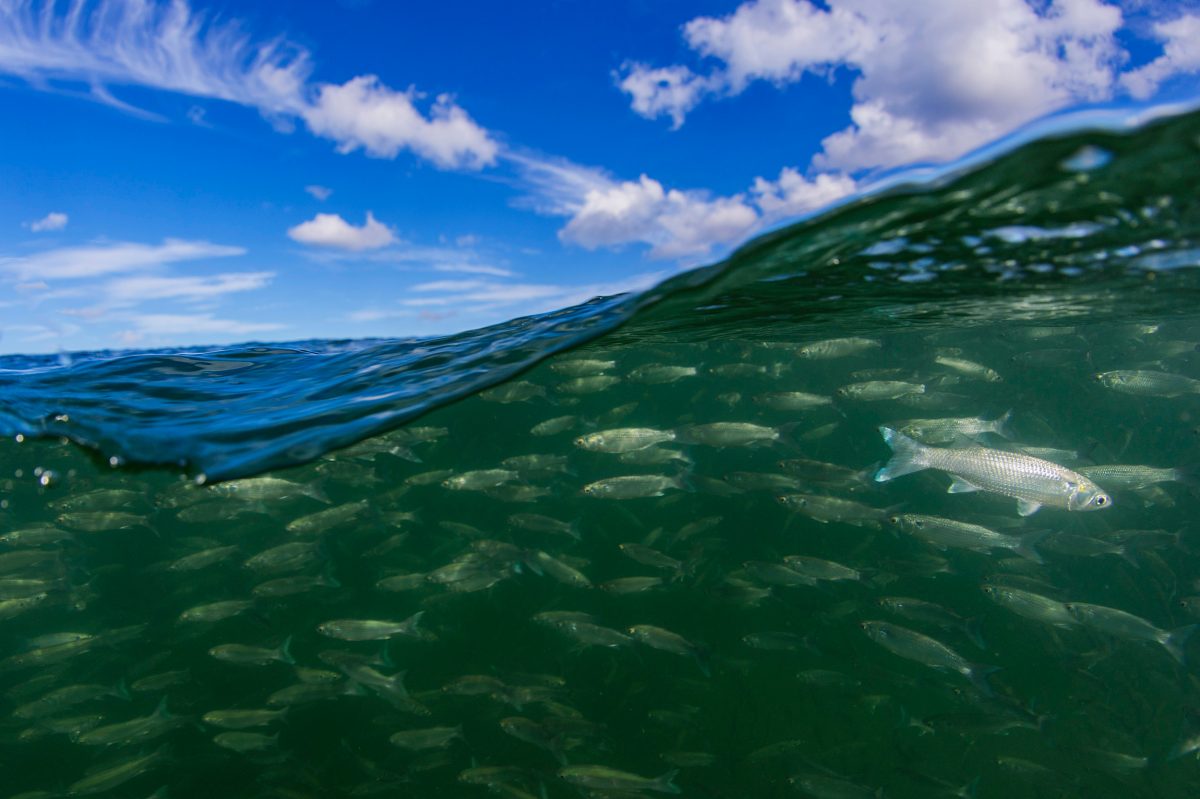
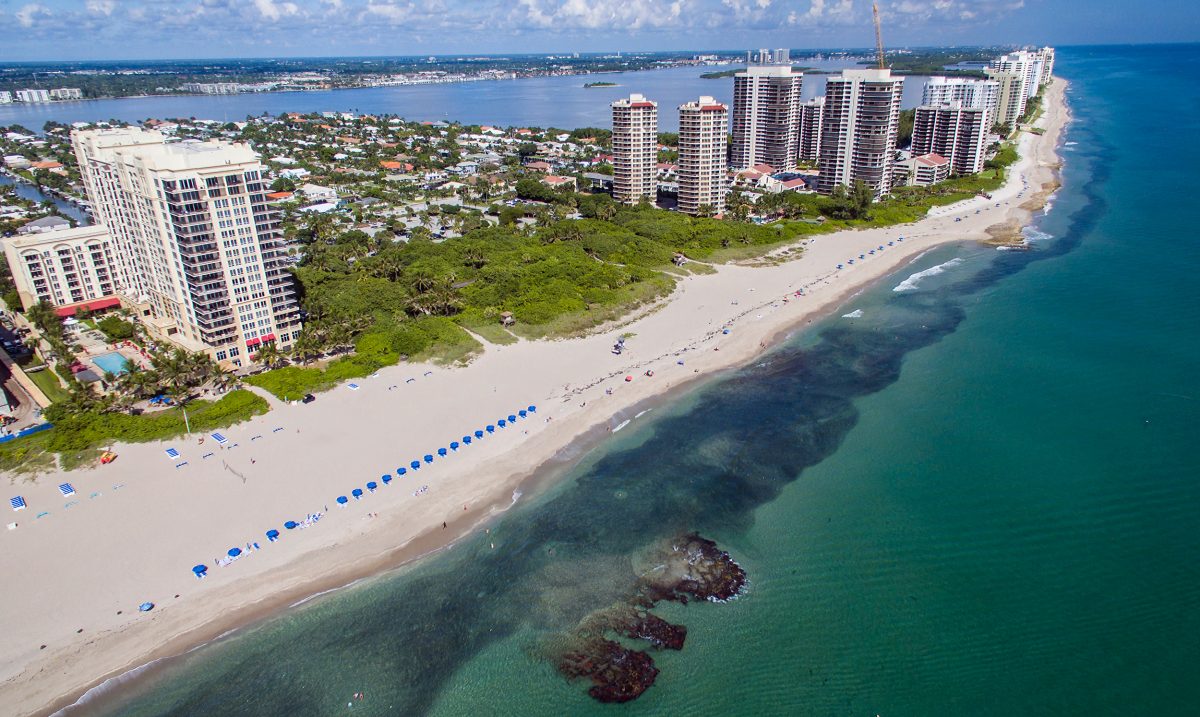
Mullet loiter near the surface in Palm Beach Shores, Florida, during the fall migration.

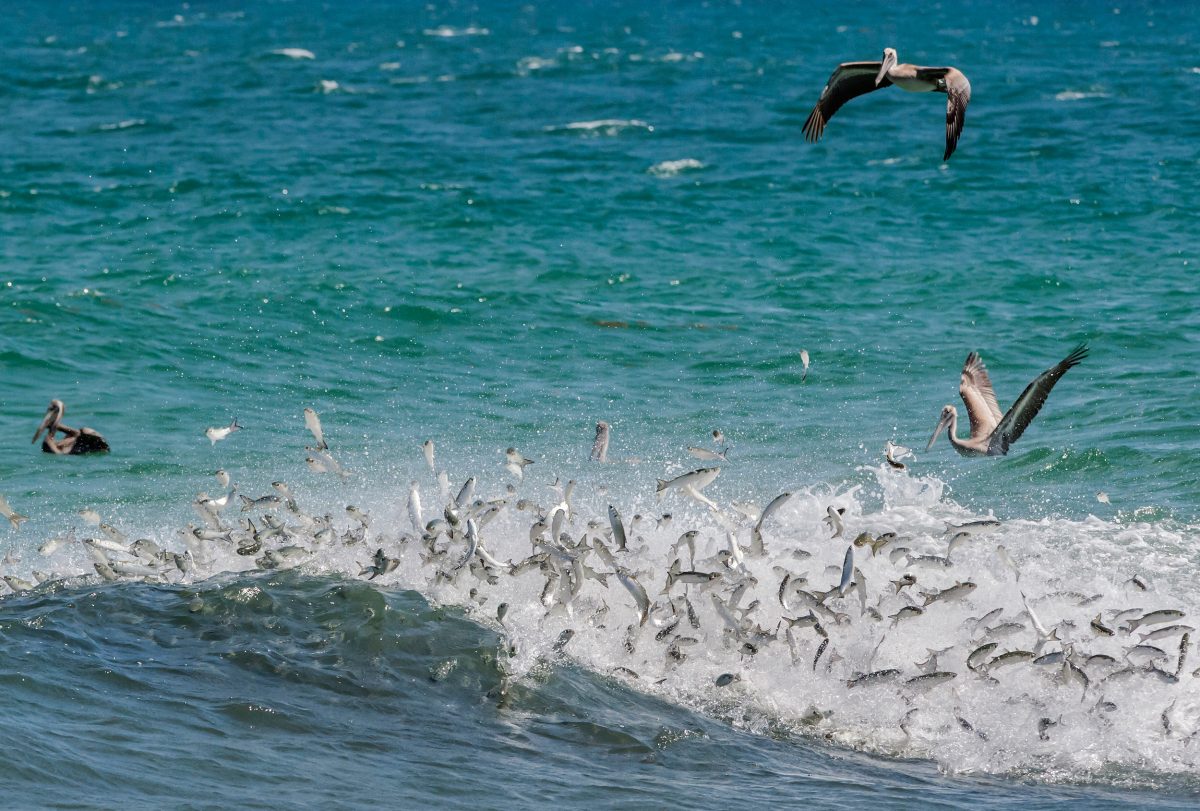
Brown pelicans chase after a school of mullet while predatory fish, most likely jack and tarpon, attack the baitfish from below, making them launch into the air.

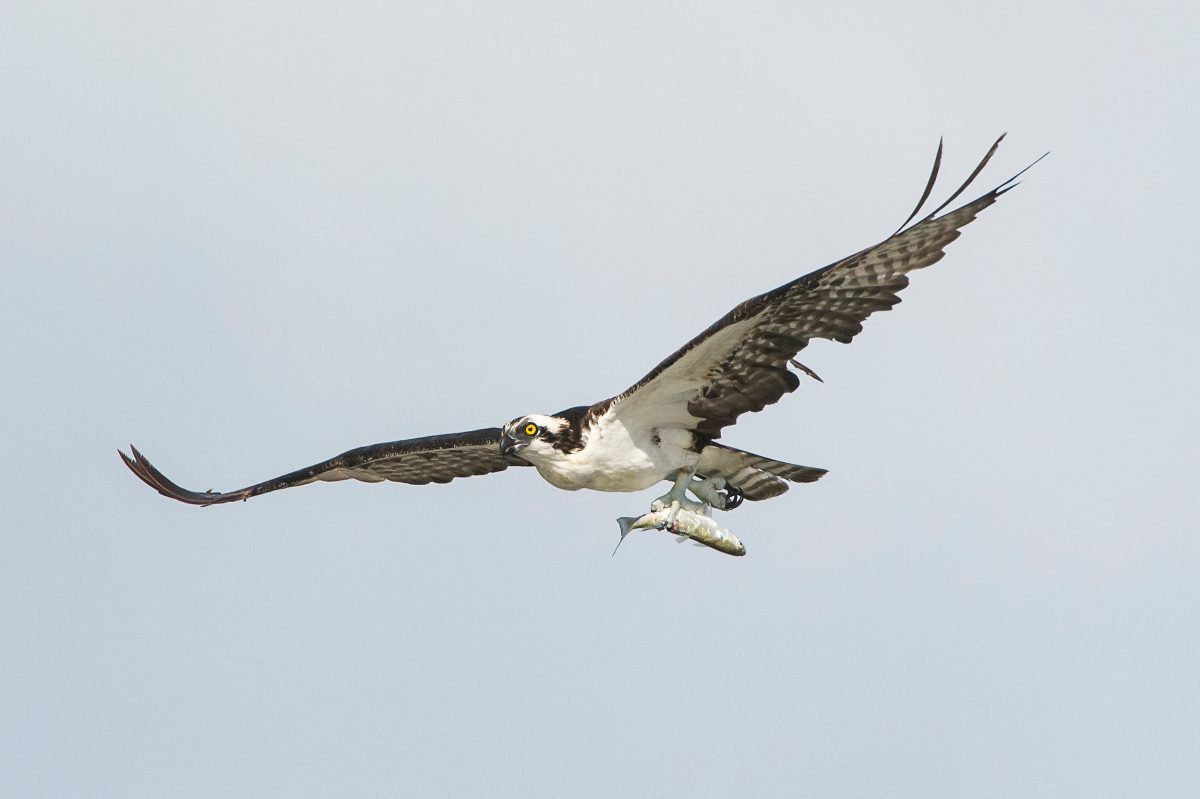
An osprey carries a mullet back to its nest after a successful hunt.
With an incredible abundance of prey, osprey and other coastal birds gorge themselves during the migration, making multiple trips from their nests to the ocean to catch dinner.

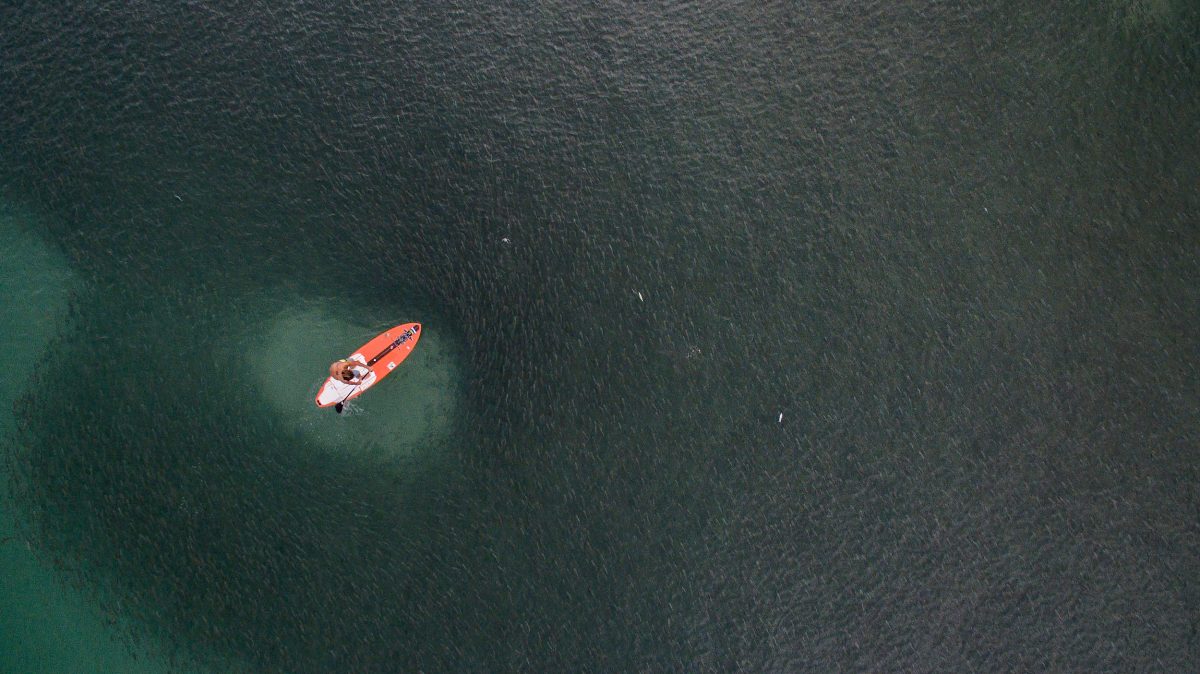
A stand-up paddleboarder works his way over a carpet of mullet, squeezed together for protection from the numerous blacktip sharks nearby.

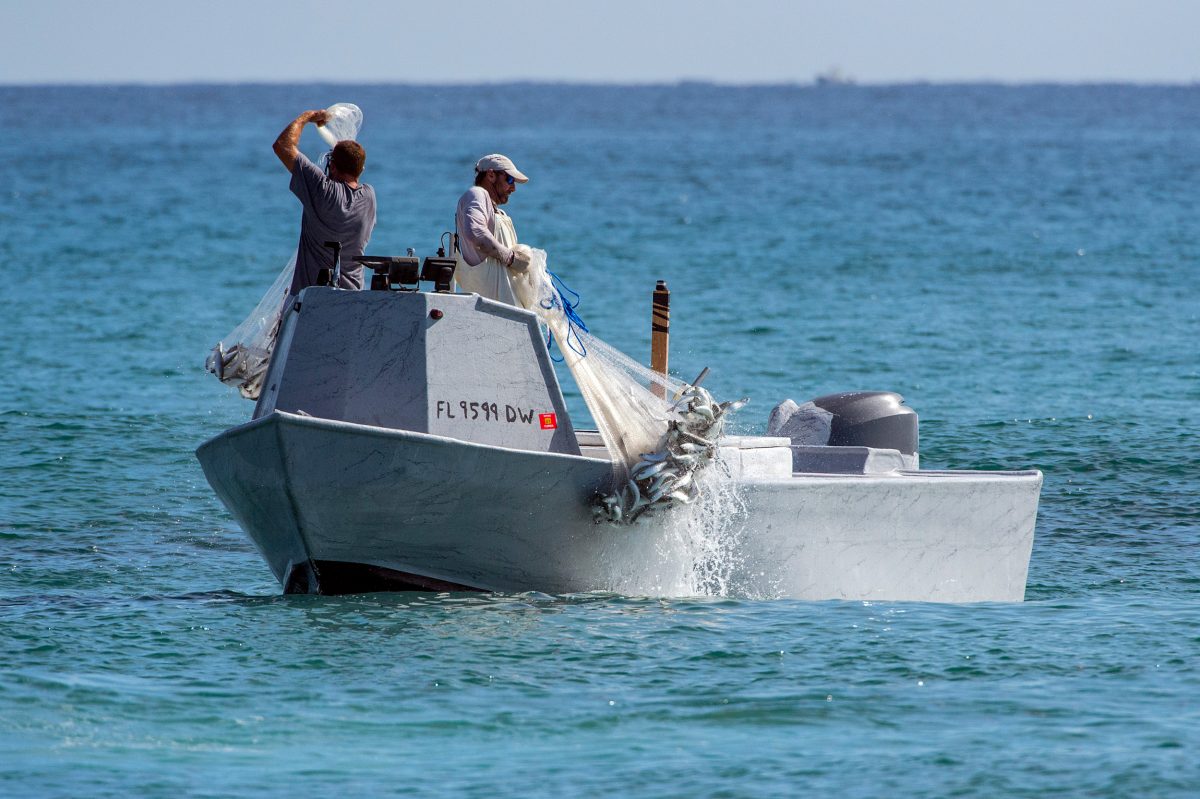
While fishermen are no longer allowed to catch mullet with large gill nets, they use small cast nets effectively.
They follow the schools in small boats and throw their nets with pinpoint accuracy to catch hundreds of thousands of kilograms of baitfish every year.

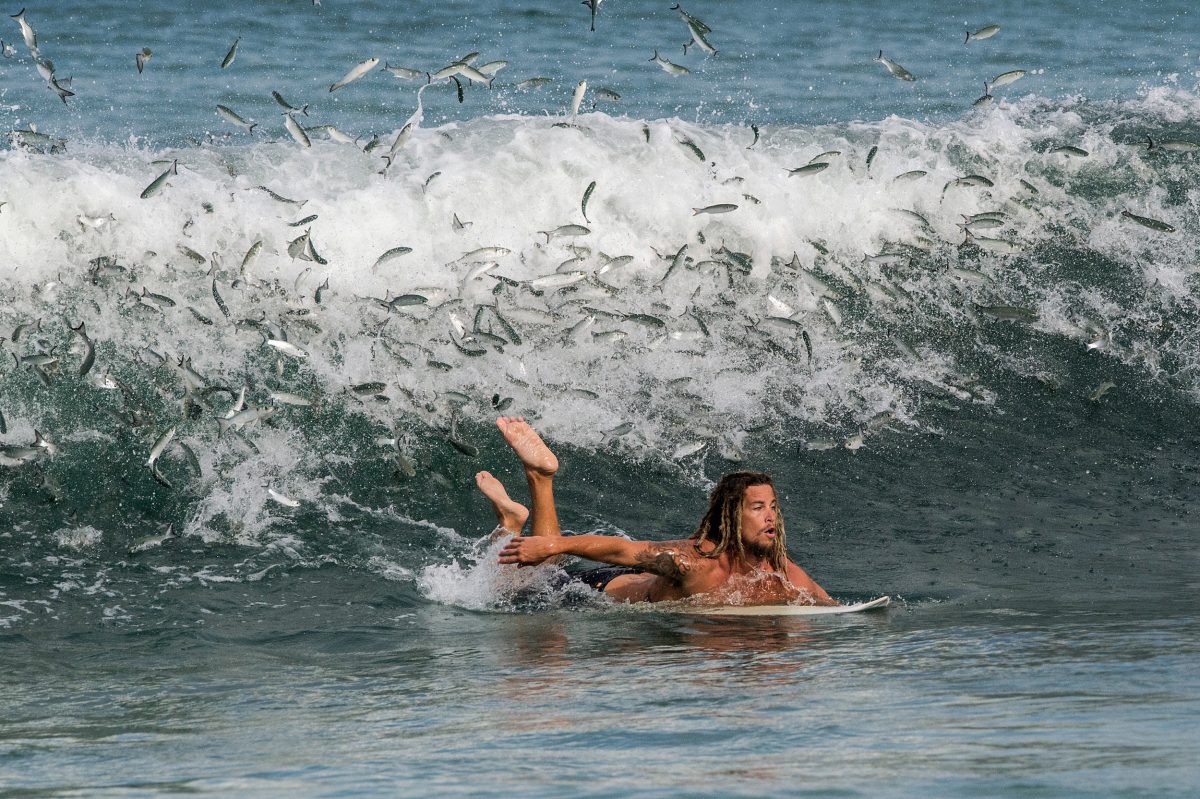
A surfer hurriedly paddles for shore as predatory fish attack a school of mullet right behind him.
The chances of an accidental shark bite increase during the mullet migration because of the abundance of excited sharks very close to the beach.

Friday, April 13, 2018

How blockchain will impact on navigation

Distributed ledger technology involve the sharing of ledgers
between different people and organisations.
(Source: The Cabinet Office's Open Innovation Team, UK)

From Hydro by Gert Büttgenbach

Blockchain technology can potentially change the process of compiling sea charts.
Since not all of us are acquainted with terms like ‘blockchain’ and ‘distributed ledger technology’ (DLT), this article first explores the inner workings of this technology by giving an example and then discusses foreseeable implications of blockchain and the sea chart.

You can proceed to the next subtitle without missing the point if you already know about DLT.
The captain’s logbook is a legal document – it is not to be tampered with.
Although it is hard to hide, a forger can potentially modify it.
The simplest way is to remove a page or two which will not go unnoticed but information will be lost forever.
Should there be even one copy of the logbook to prevent inconsistencies, and if the records were always identical, and done at exactly the same time, a forgery would be impossible.

However, all copies would still be held in one and only one location, i.e. on board of the ship whose name the logbook carries.
If the ship sinks and no crew member can save a copy of the logbook the information within is lost forever.
Another case is when the logbook is locked away to withhold information from the public.
This centuries old problem can be now solved by a combination of state of the art technologies – computing, digital communication and the ‘blockchain’.

DLT Demonstrated – a Familiar Example

A ‘blockchain’ is nothing else than a public ledger (a logbook openly accessible to anyone) that exists in multiple copies spread over the internet, and of which each copy has identical content.
In addition, the records are no longer done with a pen but digitally.

Nowadays, a vessel equipped with a computational device and access to the internet by, for example, satellite can send encrypted logbook entries to servers worldwide where a copy of the logbook will be held and each entry will be verifiable by the captain’s digital signature.

To ensure that no information goes missing the logbook servers are in constant communication with each other to synchronise the content of their logbook copies.
The servers close a page in the ship’s logbook (the equivalent of a ‘block’) if a majority of them agree that they hold identical copies.
Diverging copies are ignored.
An encrypted checksum of the verified ‘block’ page is computed, so that later modifications can be detected.
Next, a link to the following page is added as the ‘chain’ of ‘blocks’ grows.

The ship’s logbook has been now turned into a volume of indestructible and non-modifiable copies held in a blockchain by means of DLT (see figure above); nobody can tamper with its contents, and only a global disaster would destroy all of its copies.

The logbook example demonstrates the potential of the DLT technology.
In fact, DLT is already applied in container handling and it will revolutionise shipping in general.
In navigation, however, it is less obvious why and how to employ the blockchain.

The Blockchain and the Sea Chart – Foreseeable Implications

Sometimes, mother nature has to open our eyes for us to see what is needed.
As two hurricanes in a row devastated the Caribbean Sea in the autumn of 2017, it became clear that the profession of hydrography is at a crossroads.

Until now, it was not easy to assess the reliability of a chart, one had to rely on the word of the Hydrographic Offices (the reliability diagrams for example) or of a chartmaker in general.
But the situation is about to change.
Blockchain has appeared.

How Blockchain works.
 
In essence a public ledger, or public track record, the blockchain records every action (or ‘transaction’), and everyone who has access to the internet can verify it (see figure above.
The Distributed Ledger Technology (DLT), as the blockchain construct is often called, will change the way of operation of industries as well as the organisation of whole countries.
The HOs of the world will have to accept this technology too.
The users will require every single operation on data in chart production to be documented.
Looking further into the future, ships will soon be fully automatic, self-navigating and the artificial intelligence that controls them will rely on the full documentation of charts.

The use of DLT when compiling a chart will lay open the originator of the survey data which went into the chart, its time stamp, the identity of the chart compiler, and the means of the generalisation used.
Mariners will be able to check the reliability and usability of any chart, whether produced by the HOs or by private entities, and chose one that is most accurate and appropriate for their needs.
Furthermore, it is to be expected that independent, private chartmakers will adopt this technology much faster than the HOs.
This will create a completely new situation by making commercial charts certifiable and classifiable.
An independent and neutral network of servers (or ‘nodes’) that maintain ’the sea chart blockchain’ had to be setup to initiate such verification services but this appears to be only a matter of motivation since the technology is readily available and is in public domain.

‘Unofficial charts’ on the Horizon?

It is a known, albeit ignored, fact that private chartmakers are more than capable of producing charts of high quality and reliability.
Modern standards such as IHO S-44/S-57/S-100/S-102 have made it possible to produce digital charts of unparalleled precision that can easily be distributed without the need to run a printing plant that requires heavy investment.
Speaking of the Caribbean, modern cruise ships would not be able to enter small ports without tailor-made charts that have not been available from the relevant HOs and were contracted out to private chartmakers.
But, again - these ships have to take legal risks using such charts because of the SOLAS regulations that stipulate charts by HOs, ignoring the fact that the very same ships would run a risk of running aground using them exclusively.

This will place the IMO, the HOs, and all bodies whose services rely on the IMO rules, like the insurance and the certification industry, in a predicament.
The justification for the monopoly of the official charts is likely to be challenged.

Financing More Surveys

Shortly before Irma and Maria swept the approaches to the Virgin Islands and way up to Florida, the umbrella organisation of the HOs, i.e. the International Hydrographic Organization (IHO), had called out for crowdsourcing of bathymetric data.
Their Crowdsourced Bathymetry Working Group (CSBWG) is examining ‘how best to incorporate, manage and use bathymetric data acquired by other than conventional means’.
To collect these data the IHO set up its Data Centre for Digital Bathymetry (DCDB).


In parallel, the International Harbour Master Association (IHMA) has asked its members to comment on the IHO initiative.
It goes without saying that the IHMA itself is interested in the production of better approach charts to meet the demands of the ever larger vessels, and increasing traffic.
Some ports are even making their own charts, and pilots are using ‘unofficial’ i.e. not IMO-backed ENCs compiled by services other than their local HO.
As a rule, port ENCs are more accurate and more up to date than the official ones.

Bathymetric + ENC
courtesy of QPS

Where is this leading to? Asking for freely available bathymetry is one thing, but financing it is another.
Although installing a data recording device onboard a commercial vessel or a pleasure craft that collects single beam bathymetry while going in and out of ports can be seen as a contribution to the safety of shipping, it also means an investment, even if relatively small.
In addition, this type of bathymetric data can be used to confirm or otherwise the actuality of an existing chart, but it is not enough to make a new chart.
For this we need serious, professional, multibeam, in other words expensive, bathymetry (Figure 4) to be done.
Funding and organising a survey campaign by national authorities is a major task and takes time, time that disaster areas such as the Caribbean do not have.

Conclusion

Production of the navigational charts has been an exclusive domain of the national Hydrographic Offices (HOs) for a long time.
The International Maritime Organisation (IMO), an organ of the United Nations, stipulates in their Safety Of Life At Sea (SOLAS) regulations that only the charts made by the HOs meet the carriage requirements for commercial shipping.
Every ship has to meet these requirements to be considered seaworthy by the port control, coast guards, seafarer unions, and the insurance industry.

So, doesn’t calling out for more accurate and up-to-date bathymetry in reality mean asking for crowdfunding rather than crowdsourcing?
Which leads us directly to the question: why should private capital invest in a survey of a fairway, let alone the vast coastal areas when it is made clear that this is the domain of national HOs, which are often run by governments that are not used to sharing their data, not to mention the income from the sales of charts?

Offering return on investment is essential when asking for private capital.
Though one can think of a world where the HOs pay license fees to commercial entities for their bathymetric data in a private-public-partnership (PPP) arrangement, it is not likely to happen any time soon on a big scale.
There must be other ways.

It is firmly believed that the time has come to start trusting the privately produced/ commercial nautical charts, to put them on the same level as the official ones and to clarify the relevant liability issues.
Technology is available and in place.

 Multibeam 3D data (ESRI)

If the private sector is to pour money into the production of nautical charts to help out the HOs in their task to ascertain the safety of navigation and the international shipping then we need a new basis for mutual trust.
The DLT technology offers a way forward for a renaissance of the profession of private chartmakers working shoulder to shoulder with HOs who are free to join the effort on the same basis.

This will be of great benefit to international shipping.
Navigators, captains and pilots will be able to use the best nautical data available, no matter whether it is of ‘official’ or ‘private’ origin.
IMO regulations should follow suit.

What truly matters is that charts be reliable, accurate and up to date.

Links :

The internet's worst-case scenario finally happened in real life: An entire country was taken offline, and no one knows why

A map of undersea internet cables showing Mauritania's single link to the global infrastructure.TeleGeography/Business Insider

From Business Insider by Jim Edwards

  • Mauritania was taken offline for two days late last month after a submarine internet cable was cut.
  • No one knows why or how it was cut, though Sierra Leone's government appears to have interfered with its citizens' internet access around that time.
  • Undersea web cables are uniquely vulnerable to sabotage.
  • UK and US military officials have previously indicated that Russia is capable of trying something like this, though there is no indication that it was involved in this break.
News and data being produced and managed by the Kingfisher division of Seafish.
* Please note that pipeline routes have been thinned for use on this website. Whilst still representing the true position, this enables a suitable refresh rate for viewing over the internet. The images used to display the various surface and subsea objects on the map are shown for information purposes only and are not a true representation of the surface or seabed structures

For years, countries have worried that a hostile foreign power might cut the undersea cables that supply the world with internet service.

As of early 2018, there are approximately 448 submarine cables in service around the world.
The total number of cables is constantly changing as new cables enter service and older cable are decommissioned.
As of 2018, there are over 1.2 million kilometers of submarine cables in service globally.
Some cables are quite short, like the 131 kilometer CeltixConnect cable between Ireland the United Kingdom.
In contrast, others are incredibly long, such as the 20,000 kilometer Asia America Gateway cable.

Late last month, we got a taste of what that might be like.
An entire country, Mauritania, was taken offline for two days because an undersea cable was cut.
The 17,000-kilometer African Coast to Europe submarine cable, which connects 22 countries from France to South Africa, was severed on March 30, cutting off web access partially or totally to the residents of Sierra Leone and Mauritania.

It also affected service in Ivory Coast, Senegal, Equatorial Guinea, Guinea, Guinea Bissau, Liberia, Gambia, and Benin, according to Dyn, a web-infrastructure company owned by Oracle.


It is not clear how the cable was cut. But the government of Sierra Leone seems to have imposed an internet blackout on the night of March 31 in an attempt to influence an election there.

There had not been a significant outage along the cable in the past five years.

Loss of service to Mauritania was particularly severe, as the Dyn chart below shows.
"The most significant and longest-lasting disruption was seen in Mauritania, with a complete outage lasting for nearly 48 hours, followed by partial restoration of connectivity," David Belson wrote in a Dyn research blog on Thursday.


The international cable system has several levels of built-in redundancy that allowed providers such as Africell, Orange, Sierra Leone Cable, and Sierratel to restore service.

But the break shows just how vulnerable the worldwide web is to the simple act of cutting a cable. About 97% of all international data is carried on such cables, according to the Asia-Pacific Economic Cooperation forum.


Here's a map from the telecom analytics company TeleGeography of the cables in Europe:


And those connecting the US:


UK and US military intelligence officials have repeatedly warned that relatively little is done to guard the safety of the cables and that Russia's navy continually conducts activities near them.

In 2013, three divers were arrested in Egypt after attempting to cut submarine web cables.

"In the most severe scenario of an all-out attack upon undersea cable infrastructure by a hostile actor the impact of connectivity loss is potentially catastrophic, but even relatively limited sabotage has the potential to cause significant economic disruption and damage military communications," James Stavridis, a retired US Navy admiral, said in a 2017 report for the think tank Policy Exchange.

"Russian submarine forces have undertaken detailed monitoring and targeting activities in the vicinity of North Atlantic deep-sea cable infrastructure," he added.

There is no indication that Russia was involved in the ACE breakage.
But military strategists are likely to study the Mauritania break as an example of the effect of knocking a country off the web by cutting its cables.

Links :


Thursday, April 12, 2018

Canada (CHS) layer update in the GeoGarage platform

40 nautical raster charts updated & 1 new chart added

Slow-motion ocean: Atlantic’s circulation is weakest in 1,600 years

(Levke Caesar/Potsdam Institute for Climate Impact Research)

From Scientific American by Andrea Thompson

If hemisphere-spanning currents are slowing, greater flooding and extreme weather could be at hand

In recent years sensors stationed across the North Atlantic have picked up a potentially concerning signal: The grand northward progression of water along North America that moves heat from the tropics toward the Arctic has been sluggish.
If that languidness continues and deepens, it could usher in drastic changes in sea level and weather around the ocean basin.

This visualization shows one of the major regions where this pumping occurs, the North Atlantic Ocean around Greenland, Iceland, and the North Sea.
The surface ocean current brings new water to this region from the South Atlantic via the Gulf Stream and the water returns to the South Atlantic via the North Atlantic Deep Water current.
The continual influx of warm water into the North Atlantic polar ocean keeps the regions around Iceland and southern Greenland generally free of sea ice year round.
The visualization also shows another feature of the global ocean circulation: the Antarctic Circumpolar Current.
The region around latitude 60 south is the only part of the Earth where the ocean can flow all the way around the world with no obstruction by land.
As a result, both the surface and deep waters flow from west to east around Antarctica.
This circumpolar motion links the world's oceans and allows the deep water circulation from the Atlantic to rise in the Indian and Pacific Oceans, thereby closing the surface circulation with the northward flow in the Atlantic.
credit : NASA

That northward flow is a key part of the larger circulation of water, heat and nutrients around the world’s oceans.
Climate scientists have been concerned since the 1980s that rising global temperatures could throw a wrench in the conveyor belt–like system, with possibly stark climatic consequences.
Sea levels could ratchet upward along the U.S. east coast, key fisheries could be devastated by spiking water temperatures and weather patterns over Europe could be altered.

Such concerns had been quelled over the last decade as climate models suggested this branch of the ocean’s circulatory system was not likely to see a rapid slowdown, which would slow any consequences.
But two new studies, published Wednesday in the journal Nature, suggest the recent weakening spotted by ocean sensors is not just a short-term blip, as some had thought.
Rather, it is part of a longer-term decline that has put the circulation at its weakest state in centuries.
The results imply climate models are missing key pieces of the puzzle, and that ill effects could be on their way.

Which pieces might be missing, though, could determine how worrying this trend is.
If models are not sensitive enough to the changes going on in the North Atlantic, “that sort of puts the warning flag a little higher,” says Thomas Delworth, an ocean and climate modeler at the National Oceanic and Atmospheric Administration who was not involved in the research.

The Atlantic meridional overturning circulation (AMOC) and the subpolar gyre, where ocean waters cool when the AMOC weakens.
Credit: Nature

Running AMOC

The warm, salty waters of the tropical Atlantic cruise northward along the eastern U.S.
before darting toward northwestern Europe (giving the British Isles a climate far balmier than Newfoundland at a similar latitude).
As that segment of ocean flow, known as the Gulf Stream, pushes north, it cools and becomes denser and eventually sinks, forming the so-called deepwater that flows back southward along the ocean floor toward Antarctica.


Copernicus Marine Service
Major Global Ocean Currents at the surface (red) and bottom of the ocean (blue)

This cycle, called the Atlantic Meridional Overturning Circulation (AMOC), plays a key role in moving heat around the planet as well as nutrients throughout the ocean.
It also helps draw carbon dioxide from the atmosphere into the sea.
In the Pacific Ocean equatorial heat is transported north and south toward both poles.
But in the Atlantic “the heat is moving northward throughout the whole Atlantic Ocean,” says David Thornalley, a paleo-oceanographer at University College London and co-author of one of the new studies.
The resulting heat imbalance between the Northern and Southern hemispheres determines several large climatic features, such as the latitude at which a key tropical rain belt is located, which impacts water supplies, precipitation for agriculture and the health of tropical ecosystems.

As global temperatures rise with the levels of heat-trapping gases in the atmosphere, the AMOC could be disrupted by an influx of freshwater from increasing precipitation in the North Atlantic and the melting of sea ice and glaciers on land.
The added freshwater lowers the water density in the zone where deepwater forms, backing up and weakening the overall flow of the AMOC like a clogged sink.
That slowdown means less heat is transported northward, leading to cooler ocean temperatures in a region below Greenland, and warmer temperatures off the U.S.
east coast.
That warming leads to higher sea levels along the coast and raises sea temperatures where economically valuable cold-loving species like cod and lobster live.

The North Atlantic is a key juncture in the world ocean circulation system that has impacts on our climate. The Gulf Stream carries warm, salty water to the Labrador Sea and the Nordic Seas, where it releases heat to the atmosphere and warms Western Europe.
The cooler, denser water then sinks to great depths to propel currents around the world and eventually circulate water back up to the Gulf Stream.
In the mid-19th century, a long period of cooler climate, known the Little Age, came to an end.
Sea ice, ice sheets, and glaciers that had formed around the Arctic region began to melt, creating a huge natural tap of fresh water that gushed into the North Atlantic.
This huge influx of fresh water diluted seawater on the ocean surface, making it lighter and less able to sink deep.
That weakened the sinking of cold water and the amount of heat released to the atmosphere in the region.
Today, Earth's climate is warming, and even though sea ice in the region has diminished, the ocean circulation remains weak—possibly because Greenland's Ice Sheet is thawing and releasing fresh water to the North Atlantic.
Illustration by Natalie Renier, Woods Hole Oceanographic Institution

There are some indications the cold spot below Greenland can alter atmospheric patterns in a way that channels warm air over Europe, increasing the likelihood of sustained summer heat waves, says Levke Caesar, a PhD student at the Potsdam Institute for Climate Impact Research (PIK) and co-author of the other new study.
The changing ocean temperatures from an AMOC slowdown could also potentially help lock in colder winter conditions over the eastern U.S., PIK’s Stefan Rahmstorf, a co-author of the same research, has posited, although the evidence there is not clear.

Until a little more than 10 years ago scientists did not have any direct measurements of the AMOC to see how it was actually responding to climate change.
The deployment of the RAPID array of instruments (short for the U.K and U.S.–sponsored Rapid Climate Change program) across the Atlantic Basin has allowed that data to slowly trickle in, and “they’ve been revealing it is undergoing weakening,” Thornalley says.
But the brief window of data offers no longer-term perspective.
When that first data came in, scientists thought the weakening could be a temporary change resulting from the natural ups and downs of the climate, but were aware it could be part of a much longer decline.

Oregon State University climate scientist Andreas Schmittner reconstructs past ocean circulation patterns to understand how our climate changed and may change again.

Clues from the past

To help resolve the uncertainty, the teams involved with the new studies turned to what are called paleoclimate markers, which capture past changes in Earth’s climate to see how these recent changes fit in.
Thornalley and his colleagues used sediment cores collected from the ocean floor along the U.S.
east coast to reveal how deep ocean currents linked to the AMOC have changed over time; stronger currents deposit larger grains of sediment.
They also looked at tiny creatures fossilized in sediment cores—some of which had thrived in colder conditions, others in warmer ones—to see how ocean temperatures changed as the AMOC waxed and waned in strength.
Caesar and Rahmstorf’s study used direct measurements of ocean temperatures going back to the late 19th century.

The two studies came to broadly similar conclusions: The AMOC is in a very weakened state—the most anemic it has been in the last 1,600 years, according to Thornalley’s results.

The studies differ on the timing of when that weakening began.
Thornalley’s record, which spans those 1,600 years, suggests it started at the end of the little ice age, a period from about A.D.
1350 to 1850, when solar and volcanic influences depressed temperatures across the Northern Hemisphere and glaciers and ice sheets expanded.
As the little ice age ended and temperatures warmed, ice melted and freshwater flooded into the North Atlantic.
The results suggest the current state of the AMOC is the weakest it has been over that whole long record.
Whether today’s state is just a continuation of that reaction or whether global warming has also started to chip in is not clear, he says.
Caesar, meanwhile, put the turning point toward a weaker AMOC in the mid-20th century, suggesting it is due to the influence of human-caused warming.
Her team’s record, however, does not extend as far back.

When it comes to regulating global climate, the circulation of the Atlantic Ocean plays a key role. The constantly moving system of deep-water circulation, sometimes referred to as the Global Ocean Conveyor Belt, sends warm, salty Gulf Stream water to the North Atlantic where it releases heat to the atmosphere and warms Western Europe.
The cooler water then sinks to great depths and travels all the way to Antarctica and eventually circulates back up to the Gulf Stream.
Credit: Intergovernmental Panel on Climate Change

The two results are not mutually exclusive.
Both records show broadly similar patterns in decline.
“We think it’s quite remarkable that all the evidence is converging,” Thornalley says.
But pinpointing the timing of the weakening trend would give better clues as to what is driving it as well as how quickly it is happening and how rapidly we might expect to see some of the resulting climate impacts.

Already, Thornalley says, it is clear the Gulf of Maine has its warmest temperatures in the last 1,600 years.
There are also “tantalizing glimpses” of more rapid sea level rise along the U.S., he says.

The researchers are curious why climate models seem to be missing something in the AMOC process.
They do not capture this past behavior and significant weakening.
If the results of these studies bear out, Delworth says, it is possible the models are not sensitive enough to the changes in ocean freshwater that are happening or they are not factoring in all of the important changes that have impacted the circulation.
A 2017 study that looked at what would happen if climate models did factor in that melt saw it caused a sharper response from the AMOC than had otherwise been suggested.

The greater cause for concern would be if models are incorrectly capturing the sensitivity of the system, Delworth says, because it means scientist have been underestimating how quickly the AMOC might respond.
“It really depends on why the models don’t match the paleo results,” he says.

While modelers work to figure that out, Thornalley and others are trying to expand the paleoclimate record to see if the pattern they found shows up at other sites throughout the Atlantic and if they can extend it farther back in time.
They are also looking for signs of how much freshwater may have triggered the weakening at the end of the little ice age.

Moving forward, the RAPID instruments will slowly help tease out the AMOC’s behavior.
“It’s just that we have to wait a couple of years,” Caesar says, by which time some impacts may already be happening.

Links :

Wednesday, April 11, 2018

ESA scientists celebrate discovery of weird magnetism of Earth’s oceans

 Simulations of Earth’s magnetic field.
Image: ESA/Planetary Visions

From Silicon Republic by Colm Gorey

Scientists assembling for an ESA scientific conference have been amazed by new findings on how our oceans influence our planet’s magnetic field.

There are many, many mysteries left to be solved about our planet, but arguably the biggest one – from the perspective of scale – is our planet’s magnetic field.

 The most detailed map ever of the tiny magnetic signals generated by Earth’s lithosphere compiled after four years of measurements from ESA’s trio of Swarm satellites.
Image: ESA/Planetary Visions

While we have a firm understanding of the basics, how it changes over time and why has continued to elude us – at least until a new discovery made by a trio of Swarm satellites operated by the European Space Agency (ESA).

 Artwork: The Swarm satellites fly a few hundred km above the Earth's surface
Photo: ESA

Launched in 2013, the satellites were designed to, from orbit, peer beneath our planet’s surface and analyse its core dynamics and core-mantle interaction as well as the magnetism of the lithosphere and its geological context.

The results presented to this year’s European Geosciences Union meeting in Vienna focused on how the magnetic field is influenced by our planet’s oceans.

 Magnetic tides 3D model
When salty ocean water flows through Earth’s magnetic field, an electric current is generated, and this in turn induces a magnetic signal.
However, the field generated by tides is tiny – and extremely difficult to measure, but ESA’s Swarm mission has done just this in remarkable detail.
Swarm has been used to measure the magnetic signals of tides from the ocean surface to the seabed, which offers a global picture of how the ocean flows at all depths.
The magnetic tidal signal measured by Swarm is important for ocean and climate modelling, and is used to determine the electrical properties of the Earth’s lithosphere and upper mantle.
courtesy of ESA

While the magnetic field is created largely by an ocean of superheated, swirling liquid iron in the planet’s outer core, other factors – such as magnetised rocks in the crust and the flow of the ocean – also affect the field.

Hunting for that elusive magnetic signal.
Credit: European Space Agency

Extremely accurate measurements

When interacting with the magnetic field, the salty oceans of our planet produce an electric current, which in turn produces a magnetic field.


 The drift of the magnetic north pole is towards Russia :
There is one observation got from a bounty of Swarm results that will certainly have more general interest - that of the position of the north magnetic pole.
Most people know that it is not aligned with the geographic north pole and instead drifts around.
Recent decades have seen it shift in a direction that is taking it away from Canada towards Russia. Swarm is watching this movement closely.
"This year we are in a rather special situation because in 2018 the magnetic pole will be at its closest to the geographic pole. There is a separation of only 390km. The magnetic pole moves at a speed of about 55km per year," said Prof Olsen.
The expectation is that the gap between the two versions of the pole will widen again from next year.

However, because the field generated by this process was so small, it was extremely difficult to measure its influence until the introduction of Swarm.
“We have used Swarm to measure the magnetic signals of tides from the ocean surface to the seabed, which gives us a truly global picture of how the ocean flows at all depths – and this is new,” said Nils Olsen from the Technical University of Denmark, who was involved in the latest findings.
“Since oceans absorb heat from the air, tracking how this heat is being distributed and stored, particularly at depth, is important for understanding our changing climate.”
He continued: “In addition, because this tidal magnetic signal also induces a weak magnetic response deep under the seabed, these results will be used to learn more about the electrical properties of Earth’s lithosphere and upper mantle.”

Links :

Tuesday, April 10, 2018

The crystals that may have helped vikings navigate Northern Seas

Ancient Vikings used crystals to navigate in a surprisingly legitimate way.
Sunstones are unexpectedly accurate natural compasses. 

From NYTimes by Steph Yin

A depiction of Erik the Red arriving at Greenland in the 10th century.
Researchers theorize that crystals called sunstones aided Viking navigation, even in overcast weather.
Creditvia Alamy

When the Vikings left the familiar fjords of Norway for icy, uncharted territories, they were at the mercy of weather.
They had no magnetic compasses, and no way to ward off stretches of heavy clouds or fog that made it difficult to navigate by sun.
How the explorers traversed open ocean during these times is a mystery that has long captivated scholars.

This "Iceland spar" is another type of sunstone researchers hypothesize vikings use.

Norse sagas refer to a sólarstein or “sunstone” that had special properties when held to the sky.
In 1967, a Danish archaeologist named Thorkild Ramskou suggested these were crystals that revealed distinct patterns of light in the sky, caused by polarization, which exist even in overcast weather or when the sun dips below the horizon.

Multiple translucent crystals fit the bill, namely calcite, cordierite and tourmaline.
None have ever been found at Viking archaeological sites, but a calcite crystal was discovered in the wreck of a British warship from the 1500s, indicating it might have been a tool known to advanced ocean navigators.


A study published Wednesday in Royal Society Open Science advances this idea, suggesting the Vikings had a high chance of reaching a destination like Greenland in cloudy or foggy weather if they used sunstones and checked them at least every three hours.

“This study is an important step forward because it addresses the issue of cloudy conditions in a systematic way,” said Stephen Harding, author of the book “Science and the Vikings” and a biochemistry professor at the University of Nottingham who was not involved in the study.

If Vikings oriented their ship with calcite, according to the researchers, they had a 92 to 100 percent chance of getting within sight of Greenland.

Dénes Szás and Gábor Horváth, authors of the new study and physicists at Eötvös Loránd University in Hungary, are part of a research group that has spent years scrutinizing the possibility that Vikings employed sunstones.


How to use the Viking Uunartoq sun compass,
plus how to make a simple version in the forest if your lost

In 2014, the group suggested a medieval artifact called the Uunartoq disc was part of a sun compass that the Vikings used in conjunction with sunstones.

Their latest work uses a computer model that simulated 3,600 three-week trips from Norway to Greenland under varying cloud cover at two dates, spring equinox and summer solstice, which are marked on the Uunartoq disc.

If the Vikings oriented their ship with calcite, cordierite or tourmaline at least every three hours, the model showed, they had a 92 to 100 percent chance of getting within sight of Greenland.
These are “surprisingly large success rates” for navigating in overcast conditions, the authors noted.

The key to sunstone navigation is polarization, a process that filters light rays so they can only move in one plane.
Sunlight starts out oscillating in multiple planes, but atmospheric particles create concentric rings of polarized light around the sun, even on cloudy days.
Though some animals, like ants and crickets, can detect these patterns, polarization is practically indiscernible to the naked human eye.

Crystals can help.
When polarized light passes through calcite, it splits into two beams.
By rotating a calcite crystal against the sky and noting changes in brightness between these beams, one can find the atmosphere’s polarization rings and figure out where the sun is.
(Cordierite and tourmaline work a bit differently, but the principle is similar.)

The Vikings may have calibrated crystals in sunny weather, then used them to navigate on gray days, Dr. Horváth said in an email.

Amit Lerner, an animal vision researcher based in Israel, wonders if navigation by sunstone would have been too cumbersome for the Vikings to pull off.
“Small mistakes in navigation — even by a fraction of an angle — can lead to enormous diversions” in long-distance trips, he said.

Dr. Harding said we shouldn’t be quick to dismiss the Vikings, who “were brilliant” despite popular perception of them as brutes.

The study’s authors hope to settle the score with the ultimate test: a round-trip voyage between Norway and Greenland, navigated by sun compass and sunstones.

Links :

Monday, April 9, 2018

Tracking ocean plastic pollution from space

We wanted to see if we could visualize the so-called ocean garbage patches.
We start with data from floating, scientific buoys that NOAA has been distributing in the oceans for the last 35-year represented here as white dots.
Let's speed up time to see where the buoys go...
Since new buoys are continually released, it's hard to tell where older buoys move to.
Let's clear the map and add the starting locations of all the buoys...
Interesting patterns appear all over the place.
Lines of buoys are due to ships and planes that released buoys periodically.
If we let all of the buoys go at the same time, we can observe buoy migration patterns.
The number of buoys decreases because some buoys don't last as long as others.
The buoys migrate to five known gyres also called ocean garbage patches.
We can also see this in a computational model of ocean currents called ECCO-2.
We release particles evenly around the world and let the modeled currents carry the particles.
The particles from the model also migrate to the garbage patches.
Even though the retimed buoys and modeled particles did not react to currents at the same times, the fact that the data tend to accumulate in the same regions shows how robust the result is.
The dataset used for the ocean buoy visualization is the Global Drifter Database from the GDP Drifter Data Assembly Center, part of the NOAA Atlantic Oceanographic & Meteorological Laboratory.
The data covered the period February 1979 through September 2013.
Although the actual dataset has a wealth of data, including surface temperatures, salinities, etc., only the buoy positions were used in the visualization.

From NewsDeeply by Matthew O. Berger

The European Space Agency is developing technology to allow satellites to identify the concentration, movement and origin of plastic debris across the world’s oceans.

Paolo Corradi and Luca Maresi had the same idea: tracking plastic trash from space.
Corradi, an engineer with the European Space Agency’s (ESA) optics division in the Netherlands, had been hearing about plastic marine litter from a friend at a nonprofit working on the issue.
Maresi, Corradi’s boss, had seen the problem firsthand during sailing trips.
“We actually had the same study idea independently and inspired by different reasons,” Corradi said.

 Remote sensing of marine plastic litter

The men figured that deploying satellites to monitor marine litter on a global scale could give researchers working on plastic pollution data about its abundance, concentrations and movement.
But it remains to be seen whether such satellite tracking will be possible and whether it will be useful in the effort to combat a huge and growing problem that has spawned “gyres” of plastic trash in the world’s oceans.

ESA began the effort in September.
For now, Corradi says, the goal is to demonstrate the feasibility of remote sensing of plastic litter with satellites.
Eventually, the scientists would like to be able to provide data that could produce a map of global concentrations of the plastic debris.

 A floating plastic bottle photographed at the US Cordell Bank National Marine Sanctuary in the Pacific, off the US West Coast. (NOAA)

That data, the researchers said at a conference last month, could be a way to validate current models and increase certainty about how ocean plastic pollution is accumulating and moving – and its origin.
That would potentially lead to more targeted actions to combat it.
“And in that sense, the time evolution of such a concentration map would also provide a tool to monitor the effectiveness of the measures put in place to solve the problem,” Corradi said.

The project, called OptiMAL (Optical methods for Marine Litter detection), is initially focused on detecting microplastics on or near the surface of the ocean as well as larger pieces of plastic along shorelines.
So far the researchers have used images from the satellite Sentinel-3 and checked them against ground and aerial surveys.

Now they’re trying to develop ways of identifying marine debris using “optical reflectance properties in the visible and infrared light spectrum,” Corradi said.
In other words, whether plastics can be identified in the ocean from the way floating debris reflects different wavelengths of sunlight.
He noted that satellites detect phytoplankton in a similar way.

Plastic Accumulation in the Mediterranean Sea
(see Plos)

If all goes according to plan, the scientists will collect the spectral signals of plastic at sea for different types of material in varying states of degradation and concentrations.
The signals would then be entered into computer models that would simulate how those signals would look through the atmosphere, which would indicate whether it’s possible for a satellite orbiting the Earth to detect those signals and, if so, how.
“We should be able to report our first results by the end of this year,” Corradi said.

It could mean using existing satellites or even being able to detect plastics in current satellite images.
But Corradi notes that “none of these (existing) orbiting instruments was designed with the goal to look for plastic marine litter and it is still not clear what to look for in the data.”
If all works out and the researchers receive strong enough signals to be able to detect plastics, they can start to build algorithms that might be able to detect and quantify concentrations of plastic litter.
If so, they’ll be breaking new ground in the fight against plastic pollution, though cleanup advocates are uncertain the gains will be worth the effort.

It’s not the first project to map marine plastic pollution on a global scale.
German researchers put together an interactive map last year, for instance, by compiling the data from more than a thousand studies.

 Global map with each country shaded according to th estimated mass of mismanaged plastic waste
(millions of tonnes -MT- fenerated in 2010 by populations living within 50 km of the coast, considering 192 countries (countries not included in the study are shaded white)

Marcus Eriksen, cofounder of the 5 Gyres Institute, which works to combat “the global health crisis of plastic pollution,” says he’s seen other efforts to aerially monitor ocean plastic pollution.
But those have been aerial inspections conducted by a plane or drone and typically focus on a single region, such as a survey of plastic in Hawaiian waters last year.
“No one has been able to do it from outer space,” Eriksen said.
“I’ve heard a lot of talk, but haven’t seen anyone make a valiant effort.”

But he sees several challenges with the satellite strategy.
Most ocean plastic is covered in algae and other marine life, and much of it would be widely dispersed, making it harder to detect.

The Great Pacific Garbage Patch is the largest accumulation of ocean plastic in the world and is located between Hawaii and California.
Scientists of The Ocean Cleanup Foundation have conducted the most extensive analysis ever of this area.
courtesy of the Ocean Cleanup

There could be another problem even if researchers overcome those issues, though.
Eriksen imagines satellites would only be able to see what’s on the sea’s surface.
“To be honest, what’s on the surface isn’t the bulk of the issue,” he said.
“What’s below the surface is really impossible to tell.”
In 2014, Eriksen estimated that there was 250,000 metric tons of plastic floating on the surface of the ocean.
(That survey was visualized on a map made by New Zealand designers last year.)

But a 2015 study estimated the amount of plastic waste making its way from cities into the oceans at 4.8 to 12.7 million metric tons.
That could mean at least 4.5 million metric tons are beneath the ocean’s surface, likely out of the reach of satellite sensors.

Eriksen does think surveys from the air – or space – could be useful in quantifying fishing gear debris as good data could allow policymakers and industry to address so-called “ghost gear.”
“The more data we have on that, the easier it is to make a case,” he said.
But Eriksen said tackling the ocean plastic pollution crisis also requires understanding the flow of debris from land to sea.
“We have so little river data,” he said.

Links :

Sunday, April 8, 2018

New Zealand (Linz) layer update in the GeoGarage platform

6 nautical raster charts updated

Greece’s island of despair

The Fishermen of Lesbos from Hakai Magazine
The Greek island of Lesbos is at the forefront of the refugee crisis as boatload after boatload of men, women, and children fleeing conflict in Syria, Iraq, Afghanistan, and elsewhere arrive on its shores.
While citizen volunteers, NGOs, and governments claim much of the spotlight for rescue and recovery efforts, local people—especially those most experienced on the water—play a vital role, even at risk to their livelihoods and, perhaps, personal health.
Greek video journalist Nikolia Apostolou introduces us to Lesbos fishermen on the front lines.

 The flotation devices used by migrants who crossed from Turkey to Greece near Eftalou Beach on Lesbos. 
Credit Mauricio Lima
see NYTimes : Greece’s Island of Despair