Saturday, March 22, 2025

Russia: World’s most powerful, 120 MW nuclear icebreaker vessel gets funding boost


From InterestingEngeneering by Jijo Malayil
 
Russia is going ahead with its plan to develop its flagship nuclear icebreaker vessel.

To that extent, its proposed federal budget has allocated almost $1 billion over the next three years for the completion of Rossiya, its largest nuclear icebreaker.

According to an online news publisher, the ship, likely named Rossiya, is set to be the lead vessel of the Leader-class and may be the only one of its kind.

The ship is scheduled to have a 120 MW power plant, which will make it twice as powerful as any prior nuclear icebreaker. 


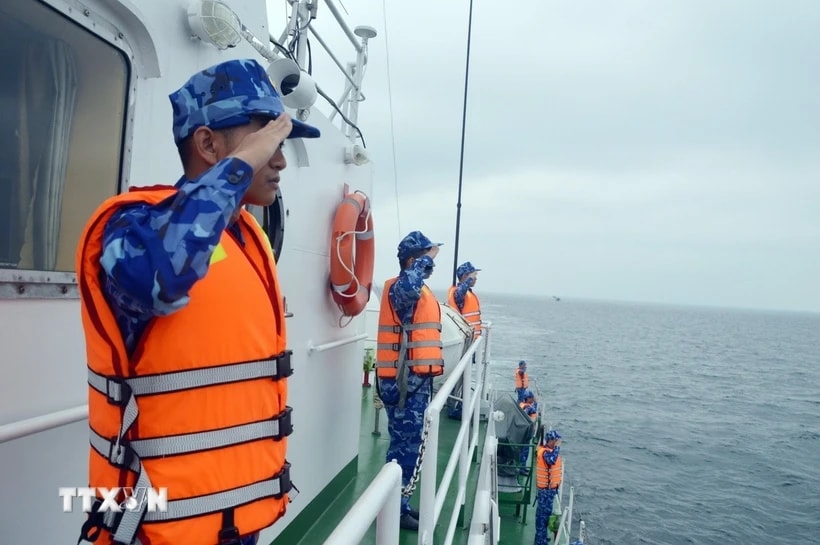
A representational image of a icebreaker vessel.

Advancing maritime trade

A nuclear-powered icebreaker features an onboard nuclear power plant that generates energy for the vessel’s propulsion system.

While operating costs are higher, these icebreakers offer significant advantages over diesel-powered ones, particularly along the Northern Sea Route.
The heavy power demands of icebreaking, the limited refueling options along the Siberian coast, and the endurance required make diesel vessel operations difficult in this region.

As of now, Russia is the sole nation constructing and operating nuclear-powered icebreakers, having developed several vessels since the Soviet era to facilitate shipping along the Northern Sea Route and support Russian Arctic outposts.

According to gCaptain, weighing 69,700 tons, Rossiya will be powered by two RITM-400 reactors.
This will allow it to break through ice up to 13 feet (four meters) thick—nearly double the capacity of the current Arktika-class nuclear icebreakers.
This advanced capability positions Rossiya as a pivotal asset in enhancing maritime logistics in the Arctic region.

The Rossiya nuclear icebreaker is set to play a crucial role in facilitating year-round shipping across the Arctic.
With a beam of 157 feet (48 meters), the vessel is engineered to carve wide channels in the ice.
This can facilitate the safe passage of LNG carriers and oil tankers through the most challenging sections of Russia’s Northern Sea Route, particularly in the East Siberian and Chukchi Seas.

As China seeks to establish regular container shipping routes in the Arctic, Rossiya may also escort a fleet of cargo ships in the future.
 
Nuclear fleet expansion

Construction of the Rossiya icebreaker began at Russia’s Zvezda shipyard in July 2020 but has faced significant setbacks, resulting in a revised delivery timeline pushed from 2027 to 2030.
Currently, approximately 15-20 percent of the vessel is complete.

According to gCaptain, the planned budget of 90 billion rubles, allocated evenly across 2025, 2026, and 2027, marks a substantial investment in the project.
With Western sanctions limiting access to European markets for Russian oil and LNG, the Leader-class icebreaker is expected to play a crucial role in exporting resources to Asia, particularly China, during the winter months.

By 2030, Atomflot, which operates Russia’s primary icebreaker fleet, aims to deploy 17 icebreakers along the Northern Sea Route, consisting of 13 nuclear and four new conventional vessels.
Currently, Atomflot has seven nuclear icebreakers in operation, with an additional four under construction and one more on order.

To optimize resources, the company plans to utilize non-nuclear icebreakers in the less demanding bays of the Ob and Yenisey Rivers, thereby allowing all nuclear icebreakers to focus on the more challenging eastern sectors.

Friday, March 21, 2025

Scientists uncover a massive gravity hole in the Indian Ocean—and its origins are more disturbing than expected


The researchers discovered that ‘low-density anomalies’—the presence of lighter materials in the upper to mid-mantle beneath the IOGL—caused the gravity low in this region.
(CREDIT: International Centre for Global Earth Models / Wikimedia, CC BY 4.0)

From MSN by Lydia Amazouz

Beneath the vast expanse of the Indian Ocean, a strange phenomenon has puzzled scientists for decades—a massive gravitational anomaly where the ocean surface dips an astonishing 106 meters lower than surrounding areas.
Known as the Indian Ocean Geoid Low (IOGL), this region experiences weaker gravitational forces than anywhere else on Earth, and until now, its origins remained a mystery.

New research, published in Geophysical Research Letters, suggests that the anomaly may be linked to mantle convection processes dating back over 140 million years.
This groundbreaking study, which used advanced computer simulations, provides the clearest explanation yet for this gravitational oddity—and in doing so, challenges our understanding of how Earth’s deep interior evolves over time.
This shows the area chosen for calculating the regional geoid correlation. (b) and (c) Temperature profiles taken along AA’ and BB’ for Case 1. (d) and (e) 3D views of temperature profiles in and around the IOGL for Case 1.
(CREDIT: Geophysical research Letters) 
 
The Earth Is a “Lumpy Potato”: Why Gravity Isn’t the Same Everywhere

Despite appearing as a smooth blue sphere from space, Earth is anything but uniform.
Its shape is constantly influenced by gravitational variations, which result from uneven mass distribution beneath the surface.
These distortions, known as geoid anomalies, create areas where gravity is either stronger or weaker, causing sea levels to rise or fall in response.

“The existence of the Indian Ocean geoid low is one of the most outstanding problems in Earth Sciences,” says Prof.
Attreyee Ghosh, an Assistant Professor at the Centre for Earth Sciences, Indian Institute of Science, Bangalore.
“It is the lowest geoid/gravity anomaly on Earth, and so far, no consensus existed regarding its source.”

Unlike other geoid lows, which are often linked to well-understood tectonic and mantle processes, the IOGL’s origins have remained elusive.
Some scientists previously speculated that it was caused by a subducted tectonic plate sinking into the mantle, but no existing theory fully explained the scale of the anomaly—until now.

In their study, researchers used geodynamic models to reconstruct the region’s geological past, running simulations that tracked mantle activity over the last 140 million years.
Their findings revealed a surprising culprit: hot, low-density material rising from deep within the mantle, likely stemming from the African superplume, which extends eastward and terminates beneath the IOGL
Contour plot of the predicted Indian Ocean geoid low (IOGL) superimposed over predicted temperature anomalies in Case 1. (c) Contour plot of the observed IOGL superimposed over temperature anomalies in S40RTS. Both are plotted at 200 km depth. The contour intervals are 10 m.
(CREDIT: Geophysical research Letters)
 
A Hidden Force Beneath the Indian Ocean
 
To uncover the origins of the Indian Ocean Geoid Low, researchers turned to seismic tomography data and high-powered computer models.
These tools allowed them to peer deep into the Earth’s interior and trace the movement of materials beneath the ocean floor.

They discovered that the gravity low is linked to anomalous mantle activity—specifically, the presence of lighter, hotter material stretching from a depth of 300 km to nearly 900 km beneath the Indian Ocean.
“A geoid low or a negative geoid anomaly would be caused by a mass deficit within the deep mantle,” explains Prof.
Ghosh.
“Our study explains this low with hotter, lighter material stretching from a depth of 300 km up to ~900 km in the northern Indian Ocean, most likely stemming from the African superplume.”

This mantle activity is not a random occurrence.
The study suggests that the IOGL’s origins may be linked to the disappearance of an ancient ocean as India’s landmass drifted northward over the last tens of millions of years.


A map showing how water elevation and distribution would change due to gravity if the effects of tides and currents were removed.
(Image credit: European Space Agency)
 
The Lost Ocean That Created a Gravity Hole

The Indian tectonic plate wasn’t always connected to Asia.
140 million years ago, a vast ocean separated the two landmasses.
Over time, India drifted north, closing the gap and causing the oceanic plate beneath it to sink into the mantle.
This subduction event likely triggered mantle plumes, bringing low-density material closer to the Earth’s surface—ultimately leading to the formation of the IOGL.

“The Earth is basically a lumpy potato,” said Ghosh.
“Technically, it’s not a sphere, but what we call an ellipsoid, because as the planet rotates, the middle part bulges outward.” This irregular shape, combined with mantle convection processes, helps explain why gravity behaves differently across different regions of the planet.

To test this theory, the researchers ran 19 different simulations, replicating tectonic shifts and mantle dynamics over the last 140 million years.
In six of these models, a geoid low similar to the one in the Indian Ocean appeared—with the key factor being the presence of mantle plumes around the anomaly.

Links :


Thursday, March 20, 2025

The Northwest Passage has the potential to disrupt global trade. But there’s a catch


From Arctic Today by Christopher Wright

Thanks to global warming, the Northwest Passage is increasingly being seen as an alternative to traditional trade routes such as the Suez Canal. While Arctic seas will certainly become more navigable, there will be challenges and limitations on the types of vessel that can reap the benefits.

What exactly is the NWP? 
R.K. Headland of the Scott Polar Research Institute in Cambridge defines seven routes or combinations.

While global warming is rapidly eroding sea ice in the Arctic Ocean, all of the routes have variable draft and seasonal access constraints.
That hasn’t stopped Arctic pundits and the media in general from expressing their optimism for a flood of commercial shipping taking a short cut between the Pacific and Atlantic oceans.

These predictions are based solely on perceived sailing distance reductions and the loss of ice cover. However, in logistics, it is time rather than distance that matters.
The Arctic is not an open water region, where ship speed is up to an operational directive; prudence is essential, given the consistent presence of ice.

The following photograph shows the result of travelling too fast in the Arctic – even when it appears to be open water.
In this case, the damage to the vessel was probably the result of a glancing blow with a growler (a piece of ice about the size of a grand piano that’s usually awash and difficult to see).
 
 
Photograph courtesy of Andrew Kendrick

There are many other considerations. First and foremost are the basic economics of the route. For many potential cargos, the new Panama Canal has eliminated what opportunities there were for maximizing cargo lift – and thus minimizing freight rates.

The “Nordic Orion“, which sailed the route in 2013 with 73,500 tonnes of coal from Vancouver to Pori in Finland, had about a $6.00/tonne margin compared with routing via the old canal.
With the new canal, the margin is only $2.00/tonne.
The Northern Sea Route (NSR) shows similar margins. Another complication for both the NWP and the NSR is that there are relatively few bulk commodities for which a viable case can be made for an Arctic routing.

Margins for bulk commodities are usually considered relative to landed cost, rather than transit time. After all, what is a day here or there with the delivery of a cargo of coal?

The situation is somewhat different for container shipping, where transit time from factory to user does matter.
Hofstra University looked at transit times from Shanghai to key destinations in the U.S. Prince Rupert in British Columbia had the least time to New York: 19 days via ship and rail.
More importantly, it was only 16 days to the Midwest distribution hub of Chicago.
Estimated time via the all-water NWP to New York was 27 days – one day more than via the Panama Canal.

While ice is a constant in any transit of the NWP, seasonality also plays a role.
The route may never be ice free year-round, and at present the window to transit the different choke points is at best six weeks
(The most opportune period is probably the first three weeks of September).

It also has to be considered, with climate change, that storms are more frequent and there are ports or other places of refuge.
Temperatures are well below freezing from November through April, and in Lancaster Sound, one can expect three months of continuous darkness.

In the absence of bulk cargoes and container shipping, what traffic can one expect to benefit from the NWP?
Wagenborg, the Dutch project cargo specialist, has been moving quite a few of its ice class vessels east and west via the Arctic.
Eastbound from China, cargoes are primarily carbon anodes for Canadian aluminium smelters; westbound it has been mainly wood pulp from the St Lawrence to the Far East, although they recently shipped several cargoes of lumber from the U.S. Eastern Seaboard to China.

Eight Wagenborg ships used the NWP in 2024, some of which made back-to-back transits.
One tanker delivered a fuel cargo from Washington state to a mine site in the western Arctic, and then continued to the Atlantic.
 
 
Map showing the different choke points that have to be negotiated

Drawn by the history of the route, the spectacular scenery and exceptional wildlife, expedition cruise ships have been frequent travellers, and eight ships made transits in 2024.

However, the most consistent sailors in the NWP are small craft. Last year, 20 “adventurers” made the trip, some of which were quite large and, technically, small cruise ships (there were three of these mega-yachts in 2024).

Is this the future of the NWP?
Or will the route become a genuine game-changer for global trade?
Only time will tell.

Links :

Wednesday, March 19, 2025

The silent struggle: countering China’s Gray Zone operations in the South China Sea

China’s Expanding Power in the Asia-Pacific Beijing is increasing its grey zone tactics—using military and civilian tools to expand influence without direct conflict.
 
From SeaLight by Ariana L.

Two recent RAND reports serve as a wake-up call: integrating resilience, capacity, and coordinated efforts isn’t just beneficial for combatting China's gray-zone warfare, it’s absolutely imperative for long-term regional stability.

SeaLight Director Ray Powell and Jim Carouso recently sat down with RAND's Todd Helmus to talk through these reports on the Why Should We Care About the Indo Pacific? podcast

Recently, I had the opportunity to dive into two pivotal RAND reports that tackle one of the most pressing challenges in the Indo-Pacific today: China’s gray zone operations.
Both papers offer a detailed examination of China’s multifaceted approach to coercion, as well as strategic recommendations for how regional partners and the United States might effectively respond.


Unpacking the Mechanics of Gray Zone Warfare

Understanding and Countering China’s Maritime Gray Zone Operations provides a deep dive into China’s use of ambiguity as a strategic tool.
The report explains how Beijing employs a range of tactics—from maritime harassment (using water cannons, lasers, and even ramming maneuvers) to the deployment of maritime militia vessels that masquerade as ordinary fishing boats.
These methods are intentionally designed to exploit the “gray area” between peace and full-scale war.

What’s particularly striking is the emphasis on ambiguity.
The report argues that by operating below the threshold of conventional conflict, China is able to gradually erode the security of its neighbors without triggering a robust military response.
This strategic ambiguity forces policymakers to reexamine traditional deterrence models since there isn’t a clear point at which the situation escalates into overt warfare.
For example, the report notes, “China’s gray zone operations enable it to impose costs on its adversaries without provoking a conventional military response,” highlighting how the subtlety of these tactics complicates effective countermeasures.


Strategic Importance of the South China Sea

The South China Sea is described not merely as a disputed maritime boundary but as a critical artery for global trade and a reservoir of natural resources.
Understanding and Countering China’s Maritime Gray Zone Operations stresses that any destabilization in this region could have cascading effects on international commerce and energy security.

The militarization of disputed features—such as through the construction of artificial islands equipped with radar, airstrips, and missile batteries—is a deliberate move by China to reshape regional power dynamics.
By asserting control in this way, China not only threatens the sovereignty of neighboring nations but also challenges the rules-based international order.
The potential economic fallout of such a destabilization could be enormous, making it imperative for the international community to pay attention to these developments.

“If you look at China’s coast guard and its maritime militia over the last three years—you would see a dramatic increase in the number of ships and the depth of the penetration,” said Ray Powell, director of SeaLight, a U.S.-based research initiative focused on gray-zone activities. 
“It’s taken on the character of a maritime occupation.”
 
The Role of Regional Partners: Varied Responses to a Common Threat

How the United States Can Support Allied and Partner Efforts to Counter China in the Gray Zone shifts focus to how regional players are responding to China’s coercive tactics.

The report details a mosaic of responses across Southeast and East Asia:

Vietnam:
Vietnam has adopted a dual approach that blends military readiness with strategic diplomacy.
Hanoi has maintained a relatively robust naval presence in the South China Sea and frequently issues formal protests against Chinese incursions.
Beyond traditional military measures, Vietnam leverages its historical mistrust of Beijing and deepens strategic alliances—most notably with the United States and India—to bolster its security posture.
However, limited resources and constrained naval capacity mean that Vietnam’s resistance is often reactive, highlighting the need for external support to sustain long-term deterrence.

Malaysia:
Malaysia’s strategy is characterized by a preference for quiet diplomacy combined with incremental defensive enhancements.
Kuala Lumpur has traditionally avoided overt confrontation with China, opting instead for behind-the-scenes negotiations and diplomatic protests.
In recognition of the growing threat to its sovereignty, Malaysia has begun investing in its maritime defenses by acquiring new patrol vessels and upgrading its surveillance capabilities.
This measured approach aims to balance its economic relationship with China against the imperative of safeguarding its territorial claims.

Taiwan:
Taiwan faces unique challenges given its limited diplomatic recognition and geographical proximity to China.
In response, Taipei has focused on strengthening its naval capabilities and pursuing strategic diplomatic engagement to counteract Beijing’s isolation efforts.
Despite resource constraints, Taiwan has prioritized modernizing its maritime defenses and actively cultivating international partnerships.
These initiatives are designed to fortify Taiwan’s security without provoking overt escalation, ensuring it remains a resilient actor in the gray zone.

Japan:

Japan’s response has been multifaceted, emphasizing both enhanced maritime security and regional cooperation.
The country has increased its naval patrols and participated in joint exercises with allies to project a stronger security presence in the region.
Moreover, Japan has invested in intelligence-sharing networks and bolstered bilateral relations with key regional partners, thereby reinforcing collective deterrence.
Japan’s strategic recalibration is not only about hard power; it also involves diplomatic efforts aimed at building a united front against coercion, ensuring that regional security architecture remains robust.

The diversity in these responses illustrate that there is no “one-size-fits-all” solution.
Each nation’s strategy is a product of its unique geopolitical context, resource capabilities, and economic dependencies.
Yet, the varied approaches complicate efforts to form a unified response but also demonstrate regional resilience.
The report clearly argues that tailored U.S. support is essential for addressing these specific vulnerabilities and fostering greater overall coordination among partners.
 

Fromthe East China Sea to the South Pacific :
China's evolving risk tolerance and Gray-Zone operations 
 
The U.S. Strategy: Supporting Allies and Countering Gray Zone Tactics

The United States recognizes the need for a robust strategy to counter China’s gray zone operations, particularly in the maritime domain of the South China Sea.
A key component of this approach is empowering regional allies to resist coercion, defend sovereignty, and uphold the rules-based international order.

Both RAND reports stress the importance of a robust U.S. strategy, built on four key pillars:Presence Operations and Deterrence:
The use of Freedom of Navigation Operations (FONOPS) and continuous maritime patrols is vital.
As emphasized, a sustained U.S. naval presence directly challenges China’s expansive claims and reassures regional allies of America’s commitment .

Enhancing Transparency:
Publicizing China’s coercive actions—via embedded journalists and advanced surveillance—damages Beijing’s international reputation.
This transparency not only informs the global community but also bolsters the morale of affected nations.

Building Regional Capacity:
Given that many Southeast Asian countries lack adequate maritime defense assets, U.S. support in the form of surveillance systems, reconnaissance tools, and patrol vessels is critical.
Joint exercises and improved information-sharing can enhance interoperability.

Deploying Non-Lethal Deterrence Tools:
Utilizing non-lethal options like water cannons and sonar devices offers a controlled method to counter Chinese coercion without escalating conflict.
Research and joint exercises can further refine these capabilities.

This integrated U.S. strategy represents a significant evolution from traditional military approaches.
It acknowledges the complexity of gray zone operations and combines hard power with diplomatic, informational, and technological measures.
Such a holistic framework is designed to empower regional partners, ensuring that responses are both flexible and effective against China’s multifaceted tactics.

Challenges and Barriers to Countering China’s Gray Zone Operations

Despite these clear strategies, the reports identify several challenges:

Economic Leverage:
Many regional nations have deep economic ties with China, making them reluctant to adopt aggressive stances.
Reducing this dependency through economic diversification is key.

Limited Naval and Surveillance Capabilities:
The lack of advanced maritime assets in many Southeast Asian countries hinders effective defense and rapid response.

Risk of Escalation:
The ambiguous nature of gray zone operations means that even measured responses can inadvertently provoke larger conflicts.

Coordination Challenges:
The diverse strategies among regional players complicate the development of a unified response, necessitating enhanced regional institutions and intelligence-sharing mechanisms.
These challenges are not insurmountable but do require a careful, calibrated approach that not only addresses the immediate threats but also lays the groundwork for long-term stability in the region.

A Path Forward: Resilience, Capacity, and Coordination

To counter China’s gray zone operations, the U.S. and its allies must pursue three interlinked lines of effort:

Building Regional Will and Resilience:
Increasing public awareness of China’s tactics strengthens political resolve.
Economic diversification reduces reliance on Chinese trade and investment, allowing for more assertive responses.

Strengthening Maritime Capacity:
Providing critical assets such as patrol vessels, surveillance drones, and radar systems enhances defensive capabilities.
Training programs improve readiness and coordination among maritime forces.

Fostering Multilateral Cooperation:
Strengthening ASEAN and developing shared intelligence networks improve maritime domain awareness and facilitate rapid, coordinated responses to gray zone activities.

This path forward is not merely about immediate deterrence—it is about building a sustainable and adaptive security architecture in the Indo-Pacific.
By focusing on resilience, capacity, and coordination, U.S. policymakers can help create an environment where regional states are better prepared to counter coercive tactics, ensuring that the international rules-based order remains intact.
 
Conclusion

Understanding and Countering China’s Maritime Gray Zone Operations and How the United States Can Support Allied and Partner Efforts to Counter China in the Gray Zone lay out a detailed roadmap for tackling one of today’s most complex security challenges.
These reports reveal that China’s gray zone tactics aren’t just about military maneuvers—they’re an intricate mix of economic, diplomatic, and informational warfare.

For those of us keeping an eye on the Indo-Pacific, it’s clear that a comprehensive U.S. strategy is essential.
Think sustained naval presence, crystal-clear transparency, robust capacity building, and smart use of non-lethal deterrence.
Together, these elements serve as the building blocks for keeping the region free and open.

In many ways, these RAND reports serve as a wake-up call: integrating resilience, capacity, and coordinated efforts isn’t just beneficial; it’s absolutely imperative for long-term regional stability.

Links :

Tuesday, March 18, 2025

Plastic pollution leaves seabirds with brain damage similar to Alzheimer’s, study shows

Researchers have discovered that healthy-looking sable shearwater chicks, pictured, are experiencing brain damage through ingesting plastic.
Photograph: Southern Lightscapes Australia/Getty Images
 
From The Guardian by Patrick Greenfield
 
Blood tests on migratory chicks fed plastics by their parents show neurodegeneration, as well as cell rupture and stomach lining decay

Ingesting plastic is leaving seabird chicks with brain damage “akin to Alzheimer’s disease”, according to a new study – adding to growing evidence of the devastating impact of plastic pollution on marine wildlife.

Analysis of young sable shearwaters, a migratory bird that travels between Australia’s Lord Howe Island and Japan, has found that plastic waste is causing damage to seabird chicks not apparent to the naked eye, including decay of the stomach lining, cell rupture and neurodegeneration.


Dozens of the chicks – which spend 90 days in burrows before making their first journey – were examined by researchers from the University of Tasmania.
Many had mistakenly been fed plastic waste by their parents and built up high levels of plastic in their stomachs.

Blood tests indicated that the plastic pollution had left the chicks with severe health issues, disrupting the stomach, liver, kidneys and brain, according to the study published in the journal Science Advances.

“Plastic ingestion in seabirds is nothing new. We’ve known about it since the 1960s, but a lot of plastic research focuses on the birds that are really emaciated: they’re starving, they’re washing up on beaches and not doing too well. We wanted to understand the condition of birds that have consumed plastic but look visibly healthy,” said Alix de Jersey, a PhD student from the University of Tasmania’s School of Medicine, who led the study.
 
Previous studies have shown that shearwaters, pictured, are particularly susceptible to plastic pollution. Photograph: Denise Hardesty/AP

“[In blood tests], we found patterns of the proteins that were very similar to those in people that have Alzheimer’s or Parkinson’s disease. It’s almost equivalent to a small child having Alzheimer’s. These birds are really suffering the impacts from plastic, especially on their neuronal brain health,” she said.

Shearwaters are among the bird species most affected by plastic pollution.
Previous studies have found more than 400 pieces of plastic in a single shearwater chick, with plastic sometimes accounting for 5-10% of their total bodyweight.

While chicks are able to vomit up some of the plastic before they migrate, researchers said the sheer quantity meant it was unlikely that all birds could clear it.
The young birds that were examined in the study had their stomachs pumped, meaning that they were able to start their migrations to the Sea of Japan without any plastic waste inside.

“It’s almost a death sentence for these chicks, which is unfortunate because they do look really fit and healthy. But knowing the condition which their body is in before they’re starting their migration, it’s quite challenging to imagine that they would make it to the other end,” said de Jersey.

Previous research has found that fewer than 60 multinationals are responsible for more than half of the world’s plastic pollution, with six responsible for a quarter of that.
 
Links :

Monday, March 17, 2025

Electronic charts officially replace paper


Comparison of Traditional NOAA Charts to NOAA Custom Charts (NCC)

From SoundingsOnline by Kim Kavin

The digital charts need work, and critics want to see improvement right away.

For the past half dozen years, the National Oceanic and Atmospheric Administration has been telling boaters that it plans to sunset its paper and raster nautical charts.
That process was completed this past December when the last of NOAA’s paper charts was canceled.

Now, if boaters want printed-out charts from the government, they have to use the electronic NOAA Custom Chart program.
Instead of boaters being able to order an updated paper chart by number—say, NOAA Chart 13230 for Buzzards Bay, Massachusetts—the Custom Chart program creates paper charts from the agency’s Electronic Nautical Chart database.
This method satisfies regulations for larger ships, while recreational boaters can click on a defined area and then print out a chart based on their request.

But this new way to get corrected, printed-out charts is causing frustration.
 
NOAA Custom Chart of Pensacola Bay, Florida
 
CATZOC & notes
Separate 8.5-by-11-inch PDF pages contain notes and a zone of confidence or ZOC diagram, similar to the survey source diagrams seen on traditional nautical charts.

 
Lee Estes, owner and president of Maptech, says the Custom Chart program delivers a lot of the traditional information, but sometimes displays it incorrectly.

“They do have NOAA symbols on them, like the buoy symbols, so that’s good,” Estes says. 
“And they have, from 2 feet away, the look and feel of NOAA charts, which is also good. They are all the same colors as a NOAA chart for the land, the marshes, all of that. Where the wheels start to come off the wagon is when you create a chart from the NCC. It has problems displaying chart information—and sometimes it’s a lot, depending on the chart you’re making.”

NOAA acknowledges these issues and says the next big fix for the system will happen in November.
“We are aware of those labeling issues, and we are actively engaged with our software vendor who produces the engine on fixing those engines,” Julia Powell, chief of the marine chart division at NOAA, told Soundings.
“I have had countless phone calls with them.”

To be clear, there don’t appear to be any major concerns using NOAA Custom Charts on multifunction displays where boaters can zoom in and click to see details.
The problems happen when the charts are printed out.

In the past, to provide clarity and prevent clutter on a chart, a label might have been rotated sideways so it wouldn’t overlay on top of something else.
The way the new NOAA program works, some information, like bridge heights, is being printed on top of other information or being presented in some other way that makes it impossible to read.

“A human being with traditional charts would say, ‘Let’s put this label here and rotate it here and make sure nothing is covering it up so you could understand it,’” Estes says. 
“This program just takes the bridge information and throws it on top of everything. You can’t read anything but the top one, and that’s hard to read because of all the other stuff.”

Powell says most of the complaints NOAA is receiving are not from recreational boaters, who often rely on multifunction displays where the Custom Charts allow skippers to zoom in.
The concerns are from companies that use NOAA charts to make things like printed-out, spiral-bound chart books.
“One of the reasons why NOAA opted to disband its traditional paper chart program is that we had sales figures,” Powell says.
The number of people purchasing paper charts “really was a very small bit of the market, whereas the electronic navigational chart is just really that primary market.”

Maptech is one of those companies that’s having problems, Estes says.
From his perspective, there are no issues with boaters using electronic charts in general, but when boaters eventually want updated printed-out versions, they may be frustrated about what it takes to get them.
For instance, he says, companies like his will need to take more time to publish new editions while making all kinds of corrections.

“Not too many people have noticed this because not too many people have used a custom chart yet,” Estes says.
“We, on the other hand, are looking at this much closer than the average person because we want to use this to correct our charts going forward, and we don’t want to find out after we print 5,000 books that people can’t read any of this information.”

Estes says NOAA should make fixing the problem more of a priority, since this system is now the only way to get corrected charts from the government.
“I would like some urgency in getting this corrected,” he says. 
“If people go to this government-sanctioned place to get government-sanctioned information, it’s not right. They owe us correct data that’s displayed correctly.”

Powell says that right now, the technology is not where NOAA wants it to be either, but the agency is continuing to work with its software vendor while also making improvements internally.
“Unfortunately, it’s never going to be like the old handwork, but we are trying to get it to where it is an acceptable solution,” Powell says. 
“We continue to focus on that, and we hope with the next big software release, we should have significant improvement on navigation labeling sometime in November 2025.”

Links :


Vietnam registers Tonkin Gulf sea boundaries with the UN under UNCLOS

source : https://www.un.org/Depts/los/
Chart_Vietnam_Baseline_Gulf_Bac_Bo
 
The UN confirms Vietnam has submitted its nautical chart and baseline coordinates for the Tonkin Gulf, reinforcing its maritime boundaries under the 1982 UNCLOS.
The United Nations Secretary-General has officially announced that Vietnam has completed the registration of its nautical chart and geographic coordinates related to the baseline used to determine the breadth of its territorial sea in the Tonkin Gulf.

 
Vietnam's baseline registration at the UN
In a March 12 notification to UN member states, the Secretary-General confirmed that on March 7, the Government of Vietnam, in accordance with Article 16(2) of the 1982 United Nations Convention on the Law of the Sea (UNCLOS), submitted a nautical chart along with a list of geographic coordinates defining straight baselines for its mainland territory in the Tonkin Gulf and the outer limits of its territorial sea in this region.

On March 14, the United Nations website officially published detailed information on Vietnam’s baseline submission.

Additionally, the notification stated that Vietnam’s official declaration on February 21, 2025, regarding the baseline used to determine the breadth of its territorial sea in the Tonkin Gulf, will be included in an upcoming edition of the UN’s official publication, "Law of the Sea Bulletin".

Vietnam Coast Guard patrols the northern waters of the gulf of Tonkin
 
Links :


China suddenly building fleet of special barges suitable for Taiwan landings

Artist's impression of the special barge being used as a pier to land tanks and troops across an otherwise unsuitable beach. The tanks are transported by civilian roll-on roll-off (RORO) ferries.
China is building at least five new special purpose barges which appear tailor made for amphibious assault. The barges may provide the PRC (People's Republic of China) with a unique way to offload large numbers of tanks directly onto Taiwanese roads.


From NavalNews by H I Sutton


https://x.com/CovertShores

Anyone wondering what an invasion of Taiwan might look like now has a fresh visual clue. Defence analysts watching Chinese shipyards have noticed an increase in a particular type of vessel.

 
A number of special and unusual barges, at least 3 but likely 5 or more, have been observed in Guangzhou Shipyard in southern China. 
These have unusually long road bridges extending from their bows. This configuration makes them particularly relevant to any future landing of PRC (People’s Republic of China) forces on Taiwanese islands.

Naval News has seen multiple sources confirming their construction, and has shared information with naval experts to validate our preliminary analysis.
The consensus is that these are most likely for amphibious landings.

China is building a new and innovative type of landing barge which can only be explained by a planned amphibious assault.
Unscripted & unedited, just a defence analyst sharing knowledge
 
Unusual Barges Similar To D-Day Mulberry Harbours

Each barge has a very long road span which is extended out from the front.
At over 120 meters (393 ft) this can be used to reach a coastal road or hard surface beyond a beach.
At the aft end is an open platform which allows other ships to dock and unload.
Some of the barges have ‘jack up’ pillars which can be lowered to provide a stable platform even in poor weather.
In operation the barge would act as a pier to allow the unloading of trucks and tanks from cargo ships.

The Guangzhou Shipyard International (GSI) on Longxue Island has been a key part in China’s naval expansion.
It is particularly associated with construction of unusual vessels including a very large uncrewed surface vessel and a light aircraft carrier.

The barges are reminiscent of the Mulberry Harbours built for the allied invasion of Normandy during World War Two. Like those, these have been built extremely quickly and to novel designs.
Although there appears to have been a smaller prototype as early as 2022, the batch of these barges have appeared only recently.

A Possible Indication Of Readiness To Invade?

The construction of specialist barges like this is one of the indicators defense analysts watching to provide early warning of a potential invasion.
It is possible that these ships can be explained away as having a civilian role.
But the construction of so many, much larger than similar civilian vessels seen before, makes this implausible.
There are several distinct designs of these barges which also points away from a commercial order. These vessels are only suited to moving large amounts of heavy equipment ashore in a short period of time.
They appear greatly over-spec for civilians uses.

Dr Emma Salisbury, Sea Power Research Fellow at the Council on Geostrategy, told Naval News that “Any invasion of Taiwan from the mainland would require a large number of ships to transport personnel and equipment across the Strait quickly, particularly land assets like armoured vehicles”. These mobile piers appear particularly suited to an invasion.
Dr Salisbury continues “As preparation for an invasion, or at least to give China the option as leverage, I would expect to see a build-up of construction of ships that could accomplish this transportation”.

Damien Symon, a respected defence analyst who reviewed material shared, noted their suitability for docking with China’s large fleet of civilian ferries.
China’s roll-on/roll-off (RORO) ferries are built to carry military vehicles including heavy main battle tanks. They are exercised in this role regularly.

Dr Salisbury agreed: “China is constructing a huge fleet of dual-use ships – commercial vessels that could be easily requisitioned for military use when needed.
These include in particular roll-on/roll-off ships that would be perfect for transporting military vehicles – and have indeed been built with military specs in mind.”

What This Means For Taiwan

The traditional view is that there are only a small number of beaches on the main island of Taiwan which are suitable for amphibious landings.
And these could be heavily defended.
The PRC could seize fishing villages or a port for larger scale landings.
But the view has been that any attempt to take the islands by force would mean landing in predictable places.
These new barges change that.

The extreme reach of the Bailey Bridges means that the PRC could land at sites previously considered unsuitable.
They can land across rocky, or soft, beaches, delivering the tanks directly to firmer ground or a coastal road.
This allows China to pick new landing sites and complicate attempts to organize defences.
Instead of relying on Taiwanese ports, China can now sail its own mobile port across the straits.

The first photos of China’s ‘invasion barges’ have surfaced today:


Damien Symon on X was able to pin point the location where the barges were spotted:

Links :