For the Moken people of Southeast Asia, the sea provides nearly everything a person might need.
It offers food to eat, a comfortable place to live (assuming one owns the appropriate vessel), and, sometimes, love.
Members of this ocean-faring ethnic group – often called “Sea Gypsies” – roam the Andaman Sea off the coasts of Thailand and Myanmar.
The Moken travel on small, handcrafted wooden boats called kabangs, from which they skillfully procure fresh meals of fish, scallops, and clams, using nothing more complicated than a simple spear and a remarkable ability to hold their breath.
To see the full story: junglesinparis.com/stories/49
This film was edited exclusively for Jungles in Paris using footage from the feature "Sailing a Sinking Sea"(2015), which premieres at SXSW March 2015..
Feature film website: cargocollective.com/sailingasinkingsea
A new study published by Science and led by Scripps Institution of Oceanography at UC San Diego researchers has revealed that the thickness of Antarctica’s floating ice shelves has recently decreased by as much as 18 percent in certain areas over nearly two decades, providing new insights on how the Antarctic ice sheet is responding to climate change. Data from nearly two decades of satellite missions have shown that the ice volume decline is accelerating.
Melting of floating ice shelves around the continent is accelerating,
potentially unlocking extra sea level rise from larger ice sheets jammed
behind them
The ice around the edge of Antarctica
is melting faster than previously thought, potentially unlocking metres
of sea-level rise in the long-term, researchers have warned.
A team of US scientists looked at 18 years’ worth of satellite data
and found the floating ice shelves that skirt the continent are losing
310km3 of ice every year.
One shelf lost 18% of its thickness during the period.
The loss of ice shelves does not contribute much directly to sea
level rise.
But they act like a cork in a bottle at the point where
glaciers meet the sea – jamming the flow of ice from the massive ice
sheets of east and west Antarctica.
Satellite view of a large iceberg separating from Antarctica’s Pine Island Glacier, where ice loss has doubled in speed over the last 20 years.
Photograph: MODIS/Aqua/NASA
Professor Andrew Shepherd, director of the Centre for Polar
Observation and Modelling at the University of Leeds, said the rates of
ice loss were unsustainable and could cause a major collapse.
This is
already occurring at the massive Pine Island glacier, where ice loss has
doubled in speed over the last 20 years as its blocking ice shelf has
melted.
“This is a real concern, because such high rates of thinning cannot
be sustained for much longer, and because in the places where Antarctic
ice shelves have already collapsed this has triggered rapid increases in
the rate of ice loss from glaciers above ground, causing global sea
levels to rise,” he said.
Changes to the thickness and volume of Antarctica's ice shelves between 1994 and 2012.
Credit: Paolo, et al./Science
The new research, published in the journal Science on Thursday, discovered for the first time that ice shelf melt is accelerating.
Dr Paul Holland, a climate scientist at the British Antarctic Survey
(BAS), said the loss of the shelves would speed the complete collapse
of the west Antarctic ice sheet, which would eventually cause up to 3.5m
of sea level rise.
But he said it was highly unlikely this would occur
this century.
He said the “worst case scenario” for 2100 was that ice
sheets would contribute an additional 70cm to the sea level rise caused
by the warming of the ocean.
Antarctica's Brunt Ice Shelf.
Credit: Michael Studinger/NASA.
The UN’s climate science body has not previously included the ice sheets of Antarctica and Greenland in its predictions for future sea level rise because scientists are not certain how fast they will slide into the ocean.
Pine Island Glacier on Sentinel-1A’s radar
This image combining two scans by Sentinel-1A’s radar shows that parts of the Pine Island glacier flowed about 100 m (in pink) between 3 March and 15 March 2015.
Light blue represents stable ice on either side of the stream. Pine Island is the largest glacier in the West Antarctic Ice Sheet and one of the fastest ice streams on the continent, with an average of over 4 km per year.
About a tenth of the ice sheet drains out to the sea by way of this glacier. With its all-weather, day and night radar vision, the Sentinel-1 mission is an important tool for monitoring polar regions and the effects that climate change has on ice.
Holland said: “What humanity needs to know is what’s the sea level
rise in 2100 and the biggest source of uncertainty in that is what’s
going to happen to the ice sheets.”
Over the past decade the loss of ice shelf volume in Antarctica increased from 25km3 to 310km3 every year.
It is unclear whether the loss of ice is directly related to man-made
climate change or a cyclical change in ocean currents.
But the extra
sea level rise from ice sheets will exacerbate the rise caused by the
expansion of oceans as the world warms.
Professor David Vaughan, director of science at BAS, said the
findings would help scientists to make more accurate predictions about
future sea level rise.
“The rate of ice loss, especially when considered in terms of the
percentage of ice lost in the last two decades, is dramatic. This
research is a significant step towards improving our ability to predict
the future of the Antarctic ice sheet and its contribution to global sea
level rise.”
Schematic diagram of an Antarctic ice shelf showing the processes causing the volume changes measured by satellites.
Ice is added to the ice shelf by glaciers flowing off the continent and by snowfall that compresses to form ice.
Ice is lost when icebergs break off the ice front, and by melting in some regions as warm water flows into the ocean cavity under the ice shelf.
Under some ice shelves, cold and fresh meltwater rises to a point where it refreezes onto the ice shelf.
The western coast ice shelves contributed the majority of the ice
loss.
The rate of loss increased by 70% in the last decade.
Two shelves
in this region could completely disappear within a century.
Conversely,
there were some areas in east Antarctica where the shelves stayed stable
or grew slightly. Vaughan said the regional variations were predicted
by previous studies.
Holland said it was important not to confuse floating ice shelves,
which can be up to 2km thick, with the much thinner sea ice.
The one
metre thick layer of sea ice around Antarctica has been expanding in recent decades, which some scientists think is because of increasing polar winds, which push the ice further out.
Links :
Climate Central : Antarctica’s Icy ‘Doorstops’ Thin; Rising Seas At Risk
Drifting blocks of ice detached from the Antarctic glaciers, frozen cubes of a couple of metres – or even tens of kilometres.
They are a polar symbol, an environmental marker – and a huge hazard for the Volvo Ocean Race teams, sailing across the Southern Ocean from Auckland to Itajaí.
Abu Dhabi Race Team talk us through the iceberg updates they receive on the boat
and Phil Harmer's less technical approach to iceberg detection.
“So far, we’ve detected about 20 of them for the race,” says Franck Mercier of CLS.
The French company has been contracted by the organisers to deliver ice analysis and data that Alicante Race Control then uses to place the ice limits* for Leg 5.
So how exactly do you find an iceberg?
Well, it’s a tiny bit technical, and CLS has to use a lot of different data and up to four satellites for that.
First, the sea temperature.
The colder the water, the more likely they are to find drifting ice.
Currents have an effect, too, pushing it all around the Southern Ocean.
Secondly, the historical data CLS has gathered these past few years – they’ve been assisting several sailing races including the Vendée Globe and the Barcelona World Race.
And finally, the radar techniques.
Now we’re talking.
The brown and red squares are potential icy areas; the green and blue stars are detected icebergs.
CLS is working with space agencies, using their satellites to scan the sea surface in search of ice. They use altimetry techniques to draft a first exclusion zone, and SAR imagery to target the areas identified as potentially dangerous and scan them thoroughly.
Altimetry only spots the biggest icebergs, that is, ones bigger than
300m.
SAR imagery is much more precise, every standard image covering a
500km x 500km area.
SAR satellite sensors can detect smaller bits of ice
– up to 50m in the case of a high-resolution picture. That’s as
accurate as it gets, and it’s pretty expensive.
“Remember it’s not an exact science,” adds Franck, a French
researcher who knows the icebergs by name.
“We’re contributing to
decrease the risks, but we don’t suppress it.
“The idea is to detect the biggest icebergs to anticipate the
position of the smaller ones, which are still very dangerous for the
boats, all of this part of the ocean dynamic.”
Their biggest catch this time around?
A 1km long iceberg, first
spotted because of a cold water plume, then “photographed” three times.
Franck and his colleagues have done the calculations – it’s 150m
wide, 300m high, underwater part included, and it weighs 25 millions
tons, the equivalent of 50 super tankers.
And the current was pushing it north at 1.1 knot, straight towards the fleet’s predicted position.
So they’ve warned Race Management, who moved the ice limits north.
They can change one of the points of this virtual line no later than 30
degrees of longitude before the first boat reaches it.
“There’s definitely plenty of ice around,” comments Simon Fisher. Picture : Guo Chuan / Green Dragon Racing
Abu Dhabi Ocean Racing’s navigator is sat at the chart table and
looks at a satellite picture of the area, wearing a nervous grin.
His
boat is currently 2,000 nautical miles away from land – they simply
cannot afford to run into drifting ice.
In 2001-02, News Corp sailed through ice and it's not something the sailors recall fondly.
“All the blue dots are icebergs that have been picked up by the
various radars," adds Simon.
"So far they’re doing a good job at keeping
us out of it.”
It’s a matter of safety – but it goes way beyond that.
“There is very little scientific literature about Antarctic drifting
icebergs.
The existing data only goes back 10 years or so, when sailing
races took an interest.
“Because there is no record yet, we cannot really link the ice
activity in the area to the global warming theme.
We see more of these
icebergs, that’s true, but that’s also due to our improved techniques.
“The icebergs of the northern hemisphere come from the Artic polar
icecap and are studied more. They’re directly linked to the climate
change - and the quantity of sea ice decreases indeed.
“But in Antarctica, there is little change. In fact, the southern ice
field tends to increase in winter… it could be one of the consequences
of the global warming that causes an increase in the precipitations.
These are only hypotheses.”
(picture courtesy of volodiaja)
* Ice limits:A virtual
line the fleet must leave to starboard, it can be modified by Race
Management depending on the movement of the ice in the southern part of
the globe. An imaginary point has been placed every five degrees,
drawing a precise contour that can be adapted.
Ice limit changes on March 25:Leg 5
Sailing Instructions Amendment 8 has been posted and communicated to
the boats – waypoints 11 and 12 have been moved further north after the
detection of a new iceberg close to the ice limit line had been
confirmed, between 95 W and 100 W.
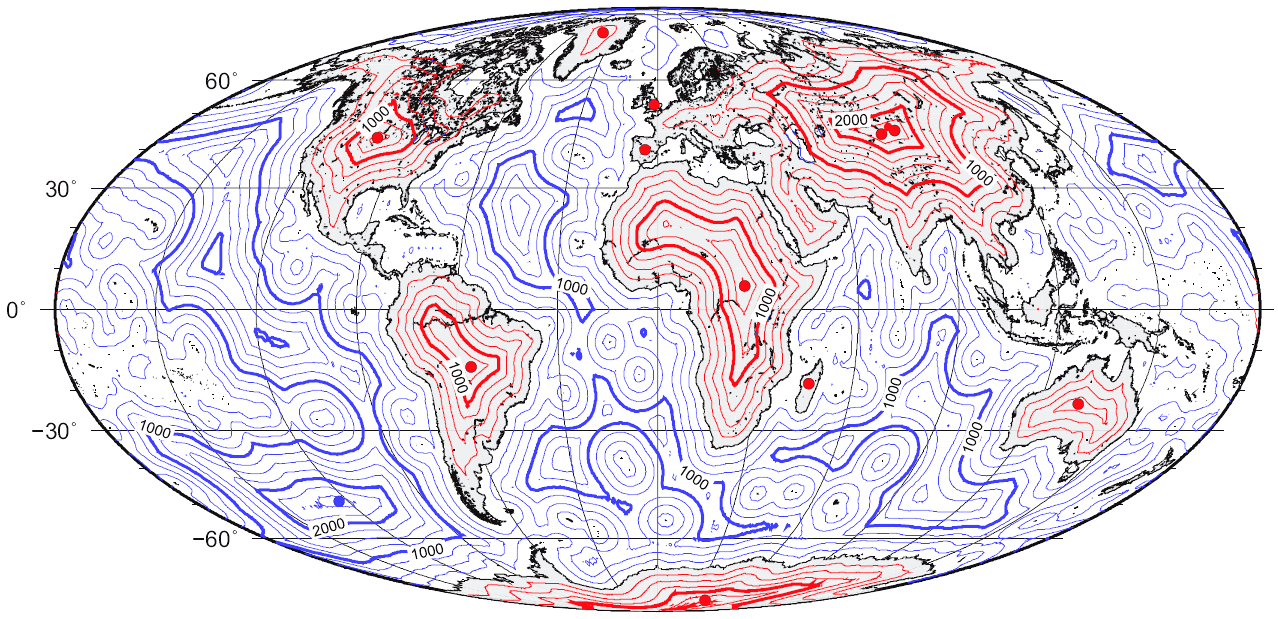
Map of distance to the nearest coastline (including oceanic islands, but not lakes) with red spots marking the poles of inaccessibility of main landmasses, Great Britain, and the Iberian Peninsula. Thin isolines are 250 km (160 mi) apart; thick lines 1,000 km (620 mi).
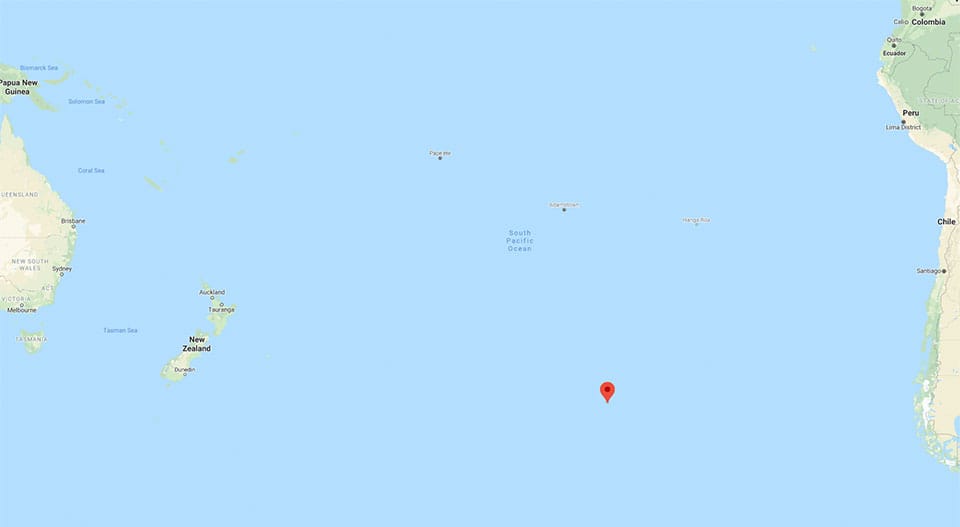
On Google Earth, a circle with the text "NEMO" printed next to it,
slightly darkened on the actual map itself, can be seen at this point.
By the way, in the The Mysterious Island (L'Île mystérieuse in French) another novel by Jules Verne, there is a reference to a "Lincoln Island", unknown (and fictitious) island also located in the Pacific no and so far (about 1500 Nm) NW from the Nemo Point at 34°57′S150°30′W
Map of the fictional Lincoln Island (The Mysterious Island).
This image originally drawn by Jules-Descartes Férat (1819–1889?) was originally featured
in the Hetzel edition of Mysterious Island, and has also been featured in more recent editions
(this particular instance was scanned from a recent edition).
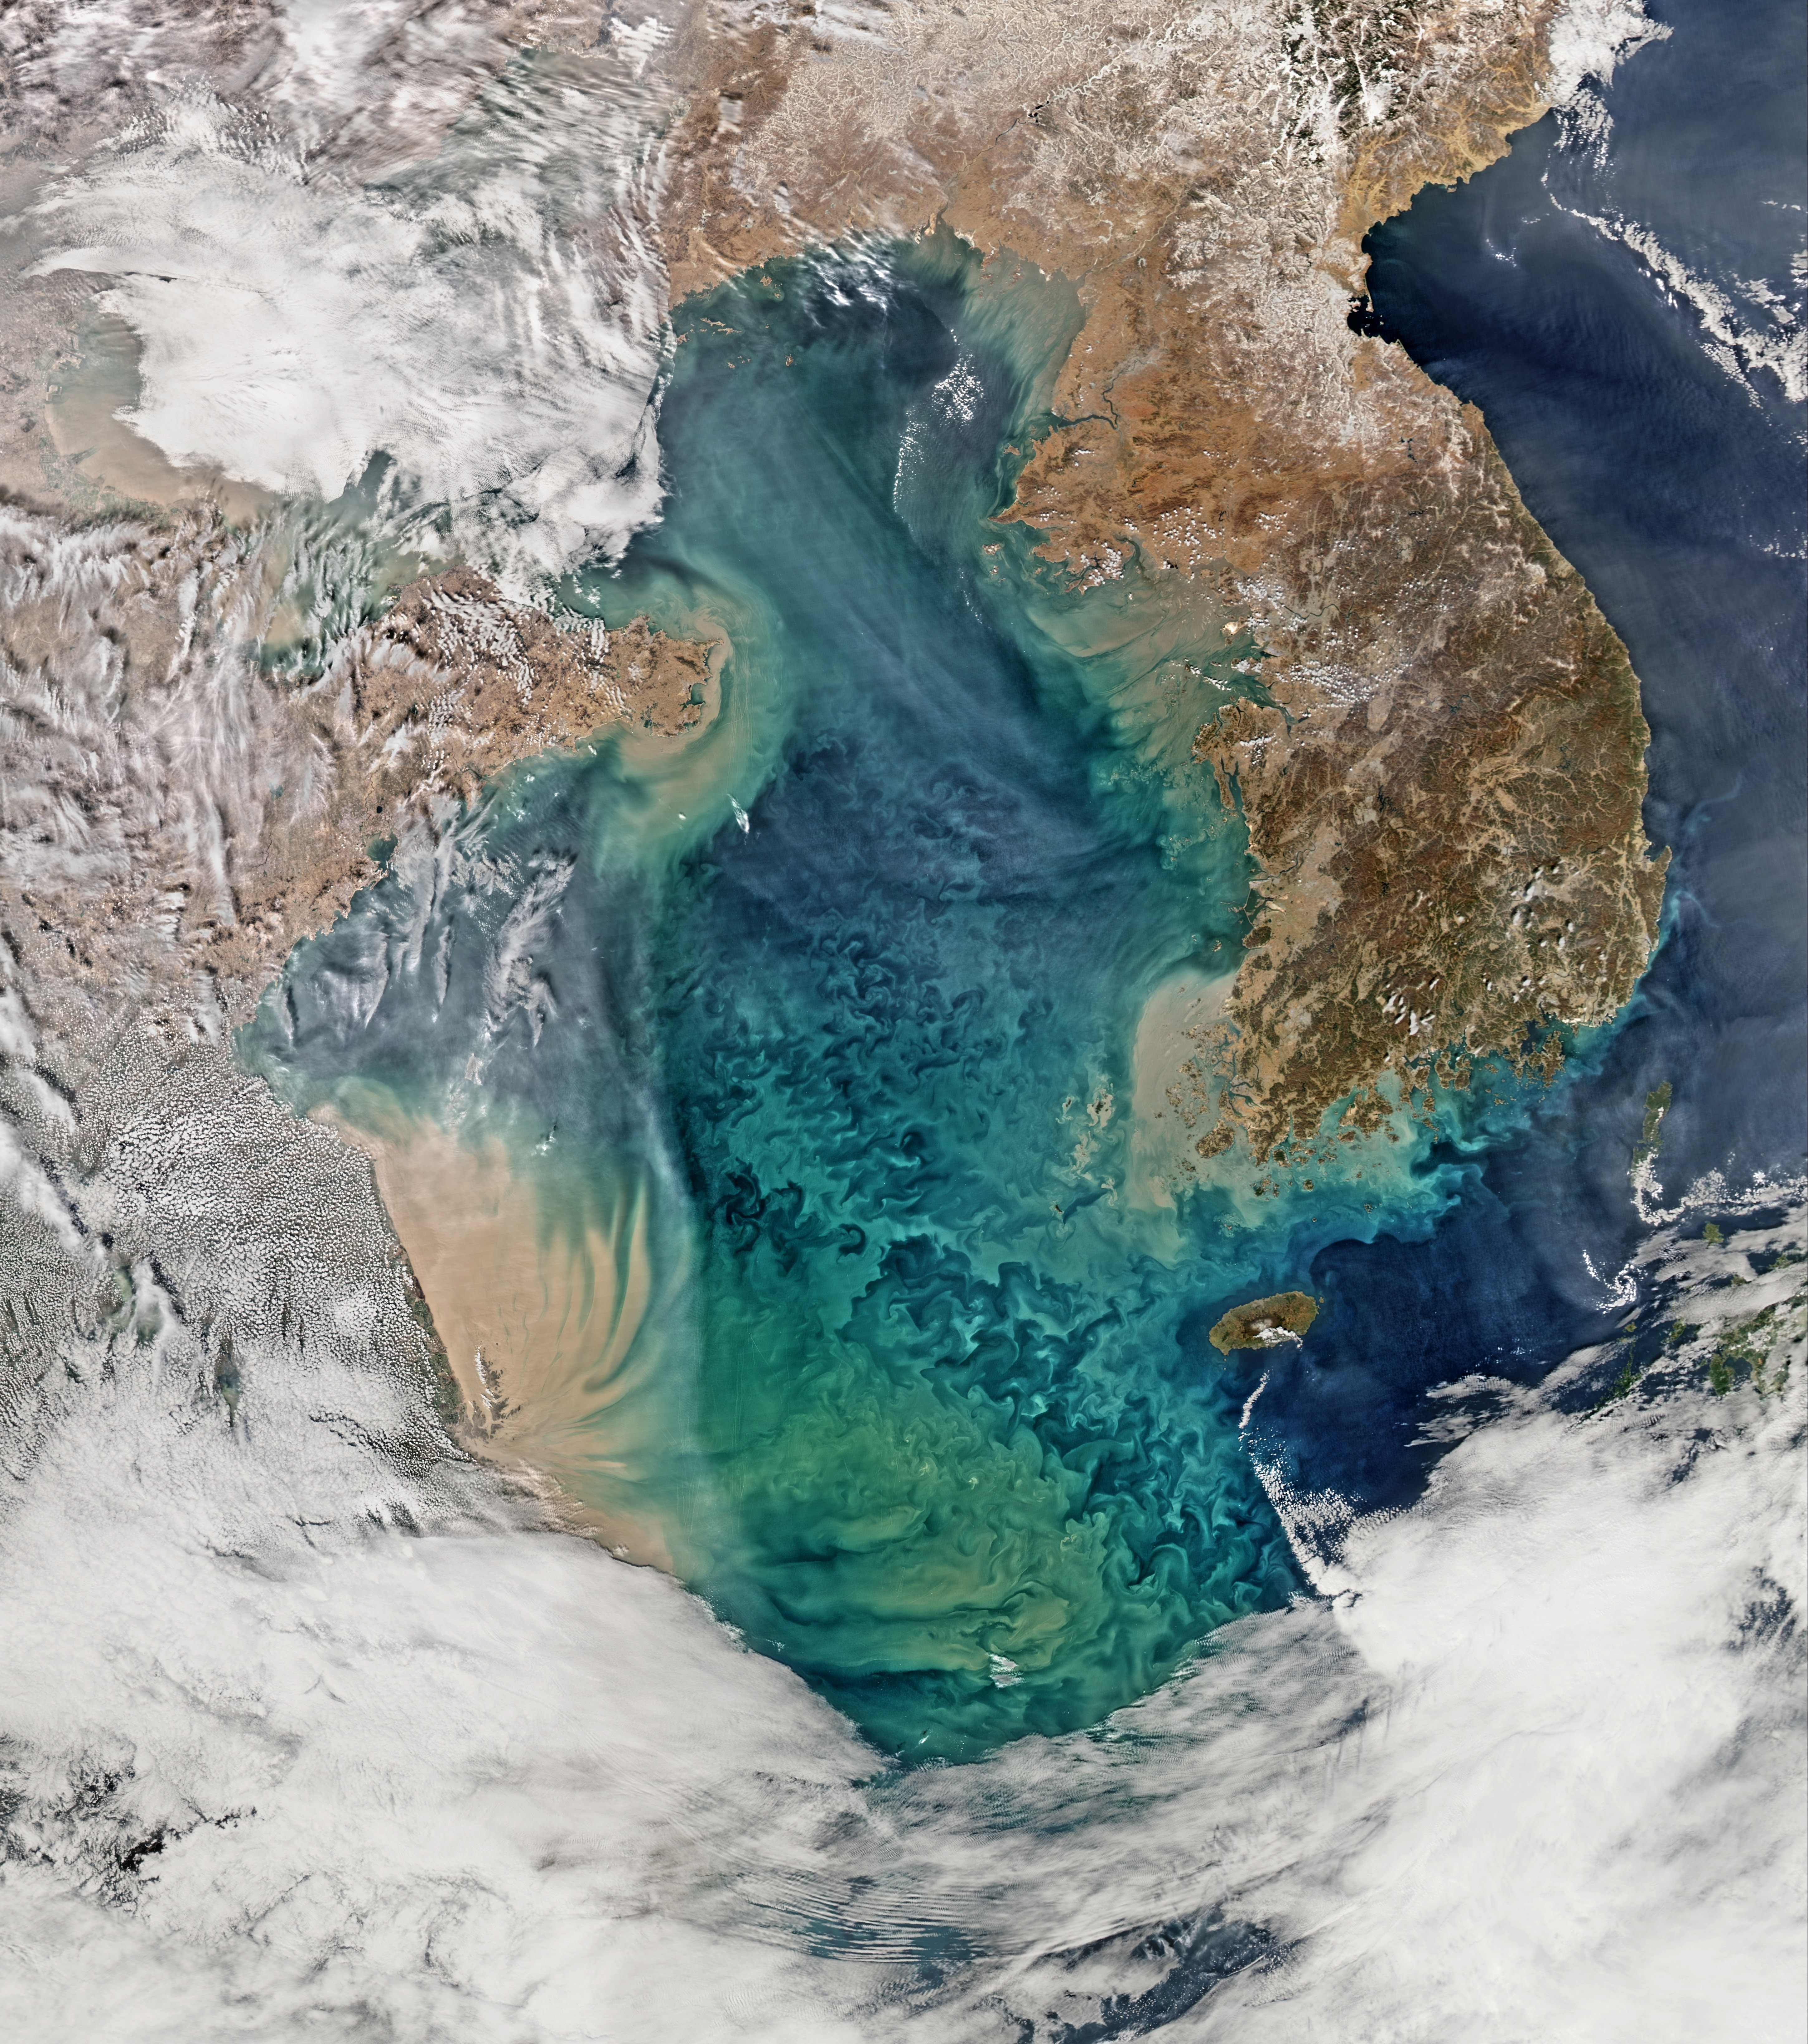
Water covers 71 percent of Earth’s surface, giving rise to the
nickname “the Blue Marble” or “the Blue Planet.”
Satellites that observe
ocean color, however, show that it’s not that simple.
Materials in the
water—living or otherwise—are often stirred and mixed until the surface
swirls with hints of blue, green, tan, white, and brown.
One area where this is extremely apparent is the Yellow Sea, pictured here in an image acquired on February 24, 2015, by the Moderate Resolution Imaging Spectroradiometer (MODIS) on NASA’s Aqua satellite.
“The region of Bohai Sea, Yellow Sea, and East China is one of the
most turbid and dynamic ocean areas in the world,” said ocean color
expert Menghua Wang of the National Oceanic and Atmospheric Administration.
In the image, the brown area along China’s Subei Shoal is turbid
water commonly seen in coastal regions.
According to Wang, shallow water
depths, tidal currents, and strong winter winds likely contributed to
the mixing of sediment through the water.
Some of the swirls in the image might be due to the Yellow Sea Warm
Current, which intrudes into the Yellow Sea in wintertime.
This branch
of the Kuroshio Current changes the temperature of the sea surface and
brings instability that could be the cause of the relatively dark swirls
in the lower-middle part of the image.
Interpreting satellite images of ocean color can be a challenge,
especially in complex regions like the Yellow Sea.
Upcoming missions
such as the Pre-Aerosol, Clouds, and ocean Ecosystem (PACE) should help scientists to better distinguish the particles and materials in the atmosphere and ocean.
As our public viewer is not yet available (currently under construction, upgrading to a new viewer as Google Maps API v2 is officially no more supported), this info is primarily intended to our universal mobile application users (Marine USiPhone-iPad on the Apple Store & Weather 4D Android -App-in- on the PlayStore) and also to our B2B customers which use our nautical charts layers in their own webmapping applications through our GeoGarage API.
NOAA raster chart coverage
16 charts have been updated in the Marine GeoGarage
While information provided by this Web site is intended to provide updated nautical charts, it must not be used as a substitute for the United States Coast Guard, National Geospatial-Intelligence Agency, or Canadian Coast Guard Notice to Mariner publications
Welcome to this week’s installment of “Don’t Mess with Geophysics.”
Last week, we learned about
the possible destabilization of the Totten Glacier of East Antarctica,
which could unleash over 11 feet of sea level rise in coming centuries.
And now this week brings news of another potential mega-scale perturbation.
According to a new study just out in Nature Climate Changeby
Stefan Rahmstorf of the Potsdam Institute for Climate Impact Research
and a group of co-authors, we’re now seeing a slowdown of the great
ocean circulation that, among other planetary roles, helps to partly
drive the Gulf Stream off
the U.S. east coast.
The consequences could be dire – including
significant extra sea level rise for coastal cities like New York and
Boston.
The Gulf Stream system is one of Earth's most important heat transport systems.
Now, though, scientists have found evidence for a slowdown of this system, which could have major implications for climate.
(Photo : Gulf of Mexico, NASA/GSFC/Aqua MODIS)
A vast, powerful, and warm current, the Gulf Stream transports more water than “all the world’s rivers combined,”
according to the National Oceanic and Atmospheric Administration.
But
it’s just one part of a larger regional ocean conveyor system
– scientists technically call it the “Atlantic meridional overturning
circulation” — which, in turn, is just one part of the larger global “thermohaline” circulation (“thermohaline” conjoins terms meaning “temperature” and “salty”).
For
the whole system, a key driver occurs in the North Atlantic ocean.
Here, the warm Gulf Stream flows northward into cooler waters and splits
into what is called the North Atlantic Current.
This stream flows still
further toward northern latitudes — until it reaches points where
colder, salty water sinks due to its greater density, and then travels
back southward at depth.
This “overturning circulation” plays a
major role in the climate because it brings warm water northward,
thereby helping to warm Europe’s climate, and also sends cold water back
towards the tropics.
Here’s a helpful visualization, from Rahmstorf and
the Potsdam Institute, of how it works:
Graph of the Atlantic Meridional Overturning
Circulation by Stefan Rahmstorf from the Potsdam Institute for Climate
Impact Research.
Red colors are surface currents, blue colors are below
the surface. “NADW” stands for North Atlantic Deep Water.
And here’s a wonderful video from NASA that visualizes the thermohaline circulation for the entire globe. Rahmstorf also has a blog post up at RealClimate.org explaining his research.
The day after fiction
The
system above has a key vulnerability.
What keeps everything churning in
the North Atlantic is the fact that cold salt water is more dense than
warm water — so it sinks.
However, if too much ice melts in the region —
from, say Greenland — a freshening of the cold salt water could occur.
If the water is less salty it will also be less dense, reducing its
tendency to sink below the surface.
This could slow or even eventually shut down the circulation.
In the
scientifically panned 2004 blockbuster film “The Day After Tomorrow,” it
is precisely such a shutdown that triggers a New Ice Age, and utter global disaster and chaos.
That’s not going to happen, say scientists.
Not remotely.
Nonetheless,
the new research finds that global warming does indeed seem to be
slowing down the circulation. And while hardly catastrophic, that can’t
be good news.
Among the very real effects, notes the Potsdam Institute’s
Rahmstorf, could be a possible increase in U.S. sea level if the whole
circulation were to break down — which would be seriously bad news for
cities like New York and Boston.
As more and more fresh water is released into the ocean by melting glaciers, the Atlantic's most powerful current, the Gulf Stream, is likely to slow down even more
The study uses a reconstruction
of sea surface temperatures in the North Atlantic to find that starting
in around 1970 or 1975, the overturning circulation started to weaken —
an event likely triggered by an unusual amount of sea ice traveling out
of the Arctic ocean, melting, and causing freshening.
The circulation
then started to recover in the 1990s, but “it seems this was only a
temporary recovery, and now it’s actually further weakened,” says
Rahmstorf.
Despite all the warming that’s taken place since 1970, one little blip of the North Atlantic (shown here in green) has begun to actually cool.
The hypothesized reason for further declines presented
by the paper is that the massive Greenland ice sheet may now be losing
enough freshwater due to melting to weaken the circulation.
And indeed,
it appears that a particular ocean region of the North Atlantic south of
Greenland and between Canada and Britain is becoming colder — an
indicator of less northward heat transport.
Rahmstorf points to a recent release
by the National Climatic Data Center of the National Oceanic and
Atmospheric Administration, finding that the winter of December 2014
through February 2015 was the warmest on record for the globe as a
whole.
However, there were several anomalies — not just a cold winter
for the eastern U.S., but also record cold temperatures in the middle of the North Atlantic:
According to the National Climatic Data Center,
the world just saw its warmest winter ever…except for in one spot in
the north Atlantic ocean (the deepest blue color above), which set a
record for cold. Which is not good. (NCDC)
“These new NOAA data got me quite worried because they indicate that
this partial recovery that we describe in the paper was only temporary,
and the circulation is on the way down again,” says Rahmstorf.
So
far, the study finds, we’re looking at a circulation that’s about 15 to
20 percent weaker.
That may not sound like much, but the paper suggests
a weakening this strong has not happened at any time since the year
900. Moreover, this is already more weakening than scientifically
expected — and could be the beginning of a further slowdown that could
have great consequences.
The U.N.’s Intergovernmental Panel on Climate Change, in 2013, said
it was “very likely” that the Atlantic overturning circulation would
weaken over the course of this century, but gave a gigantic range of
from 1 to 54 percent, with best estimates at 11 and 34 percent.
We’re
already in that window, suggests the new study, and it’s only 2015.
So
what would happen if the circulation weakens even more substantially or
even shuts down?
Why the U.S. suffers from a Gulf Stream system slowdown
One thing that will not happen
from a shutdown of the circulation is a sudden, dramatic freezing of
Europe.
It will certainly cool, relative to a world in which the
circulation remains robust — but that will be offset by rising average
temperatures due to global warming, says Rahmstorf.
The “Day After
Tomorrow” scenario will not come to pass.
However, there are many
other effects, ranging from dramatic impacts on fisheries to, perhaps
most troubling of all, the potential for extra sea level rise in the
North Atlantic region.
That may sound surprising, but here’s how it works.
We’re starting out from a situation in which sea level is “anomalously low”
off the U.S. east coast due to the motion of the Gulf Stream.
This is
for at least two reasons.
First, explains Rahmstorf’s co-author Michael
Mann of Penn State University, there’s the matter of temperature
contrast: Waters to the right or east of the Gulf Stream, in the
direction of Europe, are warmer than those on its left or west.
Warm
water expands and takes up more area than denser cold water, so sea
level is also higher to the right side of the current, and lower off our
coast.
“So if you weaken the ‘Gulf Stream’ and weaken that
temperature contrast…sea level off the U.S. east coast will actually
rise!” explains Mann by e-mail.
But there’s another factor, too, involving what is called the “geostrophic balance
of forces” in the ocean.
This gets wonky, but the bottom line result is
that “sea surface slope perpendicular to any current flow, like the
Gulf Stream, has a higher sea level on its right hand side, and the
lower sea level on the left hand slide,” says Rahmstorf.
(This would
only be true in the northern hemisphere; in the southern it would be the
opposite.)
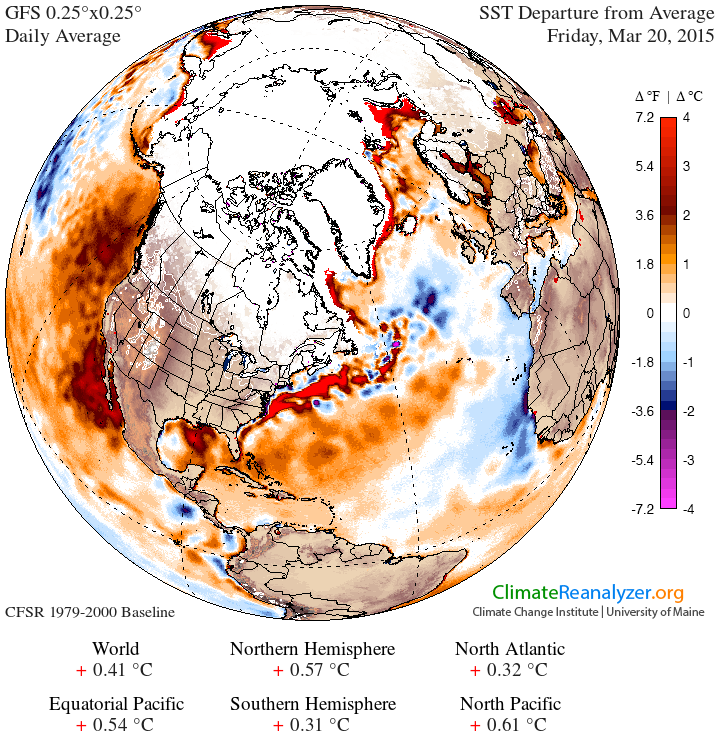
Sea surface temperature anomaly on 20 March 2015.
Note that this is relative to a baseline 1979-2000, which is already a cold period in the subpolar Atlantic.
We’re on the left hand side of the Gulf Stream.
So weaken the flow,
and you also raise the sea level.
(For further explanation, see here and here.)
Indeed, researchers recently found a
sudden, 4-inch sea level rise of the U.S. East Coast in 2009 and 2010,
which they attributed to a slowdown of the Atlantic overturning
circulation.
Rahmstorf says that “for a big breakdown of the
circulation, [sea level rise] could amount to one meter, in addition to
the global sea level rise that we’re expecting from global warming.”
Shutting
down the circulation would also almost certainly have effects on global
weather — changing around major planetary heat transport processes
tends to do that — though scientists don’t know yet what those would
look like.
So in sum: It appears that we’ve just seen yet another
surprise from the climate system — and yet another process, like the
melting of Antarctica, that seems to be happening faster than previously
expected.
And indeed, much like with that melting, the upshot if the
trend continues is an especially bad sea level rise for the United
States — the country more responsible than any other on Earth for the global warming that we’re currently experiencing.
Links :
Climate Central : Atlantic Circulation Weaker Than In Last Thousand Years
New Zealand and American scientists will use one of the world’s most
sophisticated unmanned submarine vehicles during the next three weeks to
investigate two seafloor volcanoes in the Kermadec Arc, northeast of
Bay of Plenty.
The project is a collaboration involving GNS Science, the Royal New Zealand Navy, and US-based Woods Hole Oceanographic Institution, which owns and operates the autonomous underwater vehicle Sentry.
The
multi-purpose 18-day voyage, scheduled to leave Auckland on March 3, is
built around a regular Navy supply trip to Raoul Island on HMNZS Wellington. This particular voyage will support GNS Science, the Department of Conservation, and the Meteorological Service. Sentry -
the autonomous underwater vehicle - will be deployed from the Royal New
Zealand Navy patrol vessel for its day-long missions to skim over the
seafloor and gather data.
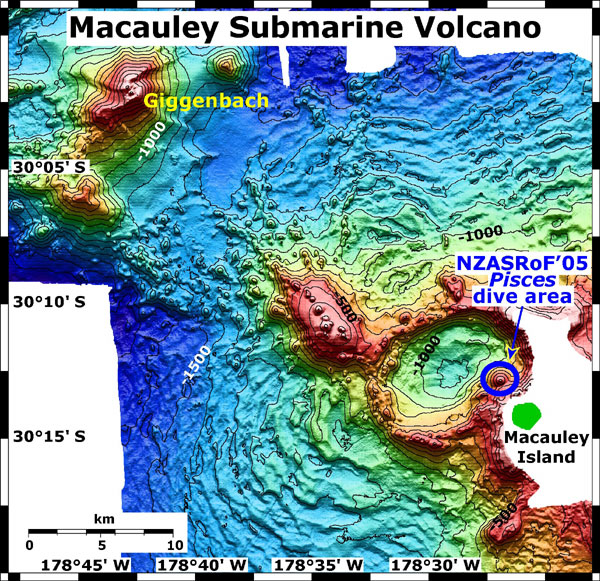
The target seafloor volcanoes – Macauley
Caldera and Giggenbach - are actively venting hot water and gases on
the seafloor and are within 100km of Raoul Island.
Both volcanoes have
been investigated by surface ships on previous voyages, but this will be
the first time they have been explored extensively at close range. Sentry will
travel over the volcanic structures at walking speed and at a
pre-determined height above the seafloor.
It will build detailed
three-dimensional maps and measure up to 12 different chemical and
physical parameters of the ocean and seabed.
It will return to the
ship after each mission to download terabytes of data, have its
batteries recharged, and to be programmed for its next deployment.
It is
scheduled to make eight dives during the voyage, covering about 10
square kilometres of seafloor per dive.
Project leader Cornel de Ronde said the voyage was part of a
long-term GNS Science programme to build detailed maps and collect
geological data, including hydrothermal venting, at about 30 major
submarine volcanoes in the Kermadec Arc, which runs between Bay of
Plenty and Tonga.
This will be Sentry’s second visit to New
Zealand.
During a GNS Science-led voyage in 2011, it gathered detailed
information on four submarine volcanoes northeast of White Island.
“Sentry is
the ideal vehicle for obtaining comprehensive information and
understanding on the seafloor and the environment around these submarine
volcanoes,” said Dr de Ronde, a marine geologist at GNS Science.
“It
provides the appropriate level of detail on the geology of the
seafloor, the hydrothermal systems, deep-sea habitats, and the
occurrence of mineral deposits.”
The project is part of a
multi-year research programme by GNS Science to map and understand
tracts of seafloor in New Zealand’s vast offshore territory.
New Zealand
has sovereign rights over an area of seafloor totalling 5.7 million
square kilometres.
This is equivalent to 14 times the size of
California or 1 percent of the Earth’s surface.
This area is largely
unmapped and unexplored.
The New Zealand landmass equates to just 4
percent of this submerged area – sometimes referred to as the continent
of Zealandia.
GNS Science, with support from its international
colleagues, has been systematically investigating the volcanic features
of the Kermadec Arc since the late 1990s.
Macauley caldera and sand waves, image created by Susan Merle of NOAA
Background: The free-swimming Sentry is arguably the
world’s most sophisticated autonomous underwater vehicle for marine
geology applications. Battery-powered and weighing 1.25 tonnes, it is
capable of diving to 6000m and spending up to 45 hours under water per
mission.
It has four pivoting wings with a propeller on each wing.
It
can skim over seafloor terrain at any height and is equipped with about a
dozen science and engineering sensors to measure physical and chemical
parameters of the ocean and seafloor.
All sensor data is stored on the
vehicle and retrieved on recovery.
Woods Hole Oceanographic Institution
in the United States owns and operates Sentry.
The free-swimming Sentry autonomous underwater vehicle will spend the
next two weeks exploring submarine volcanoes near Raoul Island in the
Kermadec Arc.
Sentry is
a part of the National Deep Submergence Facility (NDSF) which is a
joint venture involving the US National Science Foundation, the National
Oceanic and Atmospheric Administration, and the Office of Naval
Research. NDSF, which comprises manned, remote, and autonomous vehicles,
is operated by Woods Hole Oceanographic Institution on behalf of the
international scientific community.
There are dozens of submarine
volcanoes between White Island and Tonga, and many have active
hydrothermal vent systems which give rise to extensive seafloor mineral
deposits.
The mission with Sentry will help to improve the
understanding of the relationships between the hydrothermal venting, the
mineral deposits, and the specially adapted marine life that thrives in
the hot and chemically-rich environments around the volcanoes.
Macauley Caldera
Macauley Caldera is an oval-shaped submarine
crater about 10km by 5km, or about the size of Wellington Harbour. It
produced a major eruption about 2000 years ago.
The crater has steep
walls and numerous sites are venting hydrothermal fluids.
Venting at one
site in particular, a young cone that has grown up inside the crater,
is extremely vigorous.
An unusual feature of Macauley are giant sand
waves or seafloor undulations that extend outwards for many kilometres
on the flanks of the caldera.
These features have been observed at only a
handful of submarine volcanoes worldwide. Sentry will dive
inside the caldera to map it in detail and analyse the hydrothermal
vents.
It will also study the giant sand wave formations with sonar to
see if they are related to the eruption of 2000 years ago.
This will
reveal their thickness and whether their structure is chaotic or
layered.
A chaotic structure would suggest they were formed by a single
large eruption and a layered structure would point to a much less
violent formation process.
Giggenbach volcano
Giggenbach is a simple cone volcano similar
in size and style to Mount Ngauruhoe.
It is located 800km northeast of
the North Island and about 30km from Macauley Caldera.
It is shallower
than most submarine volcanoes with its summit about 120m below the sea
surface. During a 2005 expedition, scientists found diffuse hydrothermal
venting around its summit.
However, the feature that sets Giggenbach
apart is the huge volume of carbon dioxide discharging into the sea from
one particular vent area.
Scientists know of only one other submarine
volcano in the world – NW Eifuku volcano in the Mariana Arc – that is
venting more carbon dioxide than Giggenbach.
On this voyage, scientists
plan to further investigate the nature of its venting.
Offshore worker, James Eaton, recorded video from the Lomond Platform The Borgholm Dolphin installation is located 145 miles east of Aberdeen Waves were the result of a severe storm over the North Sea on January 10
It's enough to make you seasick.
As huge waves crashed against a swaying oil rig, one nearby worker managed to catch the entire harrowing ordeal on camera.
The Borgholm Dolphin installation was filmed amidst the massive swells that were a result of this severe storm.
The oil rig is stationed in the North Sea, about 145 miles east of Aberdeen.
Filmed by James Eaton, an offshore worker on the nearby Lomond Platform, the storm began on January 10, but had been known about for some time.
'The barge pulled off of the [The Borgholm Dolphin] due to upcoming weather on January 9,' James told MailOnline in an email.
'But one of our colleagues had to move over there.
'He is usually a bit delicate so we paid extra attention to the storm and how it would affect him.'
The Borgholm Dolphin (left) closed to the Lomond platform (right) in the Everest gasfield
The weather system was so strong that power was cut to approximately 140,000 properties in Northern Scotland at its worst.
'The storm lasted about two days with big seas,' the 48-year-old Control Room Technician, who has worked offshore for nine years, explained.
'It hasn't really left yet, but there were no injuries.
'We get a lot of storms this time of year, but never really have a vessel or a flotel near us to see how bad it is, so it's a bit unusual.'
Built in 1975, the Borgholm Dolphin is a platform that measures 108m × 61m.
A massive structure, it weighs almost 15,000 gross tonnes and is part of the larger Dolphin Drilling fleet, which also includes rigs off the coast of Norway.