Drone Highlights from Quantum Key West Race Week 2016.
Saturday, February 27, 2016
Friday, February 26, 2016
Sentinel-3 and the ocean carbon conundrum

European shelf seas where red and orange are the regions of the water used to calculate atmosphere–ocean gas fluxes.
Grey lines are the coastlines.
A study, published in the Journal of Atmospheric and Oceanic Technology, reveals that the seas around Europe absorb an astonishing 24 million tonnes of carbon each year.
This is equivalent in weight to two million double decker buses or 72 000 Boeing 747s.
Credit: University of Exeter
From Phys.org
Each year, about a quarter of the carbon dioxide we release into the atmosphere ends up in the ocean, but how it happens is still not fully understood.
The Sentinel-3A satellite is poised to play an important role in shedding new light on this exchange.
Initially, the fact that the oceans are absorbing a significant amount of the carbon dioxide we pump into the atmosphere by burning biomass and fossil fuels would appear to be a good thing.
However, as more carbon dioxide dissolves into the oceans, it leads to ocean acidification, making it difficult for some marine life to survive.
Monitoring and understanding the carbon cycle is important because carbon is the fundamental building block of all living organisms.
Also, the process of carbon moving between the oceans, atmosphere, land and ecosystems helps to control our climate.
Over the last four years an international team of scientists and engineers have been using satellites along with measurements from ships and pioneering cloud computing techniques to study how carbon dioxide is transferred from the atmosphere into the oceans.
Their new work, published in the Journal of Atmospheric and Oceanic Technology, reveals that the seas around Europe absorb an astonishing 24 million tonnes of carbon each year.
This is equivalent in weight to two million double decker buses or 72 000 Boeing 747s.
About a quarter of the carbon dioxide we release into the atmosphere ends up in the ocean, but the processes involved are not fully understood.
This air–sea flux is affected by many factors such as ocean biological activity, waves and temperature of the sea surface.
Over the last four years an international team of scientists and engineers have been using data from satellites along with pioneering cloud computing techniques to study the carbon dioxide in our oceans.
The team are making their data and cloud computing tools, the 'FluxEngine', available to the international scientific community so that other groups can analyse the data for themselves.
They hope that making tools like this available to everyone will improve the transparency and traceability of climate studies.
It should also help to accelerate scientific advancement in this important area.
Jamie Shutler from the University of Exeter said, "The information we are gathering using satellites is essential for monitoring our climate, but these observations are not always easily available for other scientists to use.
"This new development means that anyone can use our cloud tools and data to support their own research."
They are also now looking to Europe's Copernicus Sentinel satellites to provide vital information for this area of research.

Sentinel-3’s Ocean and Land Colour Instrument will provide data for a variety of marine biogeochemical products including algal pigment concentration, total suspended matter, coloured dissolved organic matter and Chlorophyll-a, amongst others.
Information such as this will, for example, help to improve the prediction of harmful algal blooms.
In turn, this will help oceanic food sources to be managed more efficiently.
The input of waste products into ocean and coastal waters can also be monitored so that the possibility of accidents and risks of major pollution incidents can be reduced.
Credit: ESA/ATG medialab
Sentinel-3A was launched on 16 February and once commissioned for service it will measure the temperature of the sea surface, currents, winds, waves and other biochemical factors.
The unique aspect of Sentinel-3A is that its instruments make simultaneous measurements, providing overlapping data products that carry vital information to estimate carbon dioxide 'fluxes'.
To calculate the flux of gases between the ocean and the atmosphere, it is necessary to know the solubility of carbon dioxide in the seawater, together with the speed of gas transfer.
Importantly, the solubility is determined by a combination of sea-surface temperature and salinity, while the ocean surface wind and wave environment govern the speed at which carbon dioxide is transferred.
All this information from just one satellite makes the Sentinel-3 mission a near-perfect tool to estimate the exchange of carbon dioxide between the atmosphere and the global ocean, as well as seasonal, year-to-year and regional patterns in the exchange.
ESA's Sentinel-3 mission scientist, Craig Donlon, said, "The use of satellite data to provide a more informed and complete set of baseline data is helping to improve our understanding of carbon cycling.
"The ability for individual scientists to run and rerun their own flux calculations is a new and powerful way of working together in an open science world."
While satellites enable us to monitor the global oceans easily, shipboard measurements remain essential because we can't monitor everything from space.
Andy Watson, also from the University of Exeter, commented, "Good knowledge of the ocean uptake and release of carbon dioxide is essential for predicting climate change.
Eventually, most of the carbon dioxide we release will find its way into the oceans.
"This project will provide the most accurate estimates that we have and is accessible to anyone."
Links :
"This project will provide the most accurate estimates that we have and is accessible to anyone."
Links :
Thursday, February 25, 2016
Hydrographic Surveys: Surveying Australia
From IxSurvey Au by Michael Beard and David Donohue (part I / part II)
‘No day too long, no task too arduous’ is the Hydrographic Surveyor’s maxim.
However, given the magnitude of Australia’s national hydrographic effort, there remain some long days ahead for those charged with the hydrographic survey task across Australia’s area of surveying and charting responsibility.

Antarctic Survey
Survey Vessel Wyatt Earp Surveying Newcombe Bay.
Credit: CofA
This is a significant undertaking for Australia’s national hydrographic authority, not just because of the enormity of the task but because of mounting pressures to achieve the national surveying program and the relatively small number of Royal Australian Navy ships and aircraft available to conduct the hydrographic work.
Increasingly, there are calls for greater industry involvement in contributing to this international responsibility, not to supplant the endeavours of the Australian Hydrographic Service, but to help progress the survey rate of effort and realise potential cost savings and economic benefits in the process.
In focusing on the national hydrographic task, this article shows how industry has the capacity to shoulder some of the burden and the benefits of pursuing a more meaningful engagement strategy with industry.
In the continued absence of a helping hand from industry, and without a shift in strategic mindset, this vitally important program will continue to be an arduous, expensive and interminable undertaking.
Australia’s hydrographic survey obligations
As a signatory to the International Convention for Safety of Life at Sea (SOLAS), and in line with recent amendments to the Navigation Act 2012 (Cth), Australia is required to provide a national hydrographic service to aid safe navigation for vessels transiting Australia’s coastal waters.
Delivery of this ‘public good’ (that is, a service to the benefit or wellbeing of the public that would otherwise not be provided for by market forces alone) remains the intrinsic responsibility of the Royal Australian Navy (RAN) through the efforts of the Australian Hydrographic Service (AHS).
The RAN assumed responsibility for the conduct of hydrographic surveys on the Australian station in October 1920, and for the publication of charts in 1942.
In 1946, the Federal Government assigned the Commonwealth Naval Board responsibility for the surveying and charting of Australian waters, which was re-confirmed in 1988 after a review of Commonwealth mapping activities.
Since this time, the AHS organisation has provided survey and maritime charting services as the Commonwealth agency responsible for the conduct of hydrographic surveys within Australia’s area of charting responsibility, a responsibility that extends to the waters of Papua New Guinea and Antarctica.


Australia’s charting area
Australia’s area of charting responsibility is large, very large.
Comprising approximately ten per cent of the world’s oceans, it represents one eighth of the world’s surface.
With a total of some thirteen million square nautical miles (nm2) and a total mainland and island coastline of 32,255 nm (59,736 km), Australia’s hydrographic surveying interests are substantial.
The Australian Exclusive Economic Zone alone encompasses an area of some 2.5 million nm2, in which the coastal margins, where depths are typically less than 200 metres, cover an area approximating 760,000 nm2.
Large parts of Australia’s coastal and offshore estate remain unsurveyed or are inadequately charted. Only 35 per cent of mainland coastal waters have been adequately surveyed to a modern standard, while 20 per cent require resurvey to meet contemporary international standards.
The rest of Australia’s charting area, including extensive coastal areas of Papua New Guinea (72 per cent) and much of Antarctica, remains largely unsurveyed.
There is much work to be done.
To fulfil the responsibility of undertaking the requisite hydrographic surveys in this area in order to provide the foundation data from which to produce nautical charts and products, the AHS operates and crews a relatively small Hydrographic Survey Force (HSF).
This force comprises two Hydrographic Ship (HS) platforms, four Survey Motor Launches (SML) catamarans, the Laser Airborne Depth Sounder (LADS) aircraft, and a number of Deployable Geospatial Support Teams.
When compared to the extent of Australia’s charting area and the magnitude of the hydrographic task, particularly the work that remains outstanding, the capacity and ability of the HSF is thrown into sharp relief.
This short video summarises the value of Geoscience Australia's work to manage Australia's marine jurisdictions, including the Australian Antarctic Territory.
Progress against the national hydrographic task
Since the early 1990s, the AHS’s progress of the national hydrographic survey task has been modelled around an annual rate of effort figure of some 20,000 nm2 across a range of depth bands down to 1,500 metres.
This arbitrary target was assessed as being required in order to make sufficient inroads into this hydrographic task.
This figure has proven challenging in the extreme and difficult to achieve, despite HSF assets being available and despite best efforts to efficiently schedule individual ship programs.
Of greater concern is that in more recent years, more contemporary survey rate of effort targets have not been consistently met, either.
Hydroscheme details the AHS’s three-year rolling national hydrographic survey and charting program.
It is through Hydroscheme that the annual schedule of planned survey activities and chart production for the next three years is promulgated.
This program includes details of annual survey day targets (i.e. days actually on the survey grounds or directly contributing to the survey effort at sea) for the HSF.
However, even with the development of more considered and practical rate of effort targets that factor in competing demands and priorities placed on the HSF, there is evidence to suggest the capacity to consistently meet annual targets remains problematic, particularly for the HS and SML capabilities.

source: AHS
There are good reasons for lower than planned success rates over the years.
There will always be a need to balance rate of effort considerations with reality due to the complex nature of hydrographic work itself, the requirement to operate in diverse and often challenging sea environments, and because of the operating capabilities and limitations of individual HSF platforms.
Vessel (or aircraft) downtime due to significant maintenance, adverse weather and sea conditions, and the re-assignment of survey ships to support higher-priority military operations such as border protection and surveillance operations across Australia’s northern and north western approaches, all come at the expense of the national hydrographic task.
This situation is exacerbated by imposed thresholds on the maximum number of days that a ship may spend at sea in a two-year period, and the minimum length of time a ship is required to be alongside in her home port.
Like other RAN Fleet units, the HSF is also constrained by non-discretionary maintenance periods that invariably need to be completed in the vessel’s home port (which requires ships to come off task), and the requirement to program block leave periods alongside home ports in order to provide personnel with adequate rest and recreation.
All these factors and considerations coalesce to limit time on the survey grounds and thus a reduced survey rate of effort, especially when one considers that the bulk of the HSF is home-ported in Cairns, while nearly half of all current Hydroscheme tasks involve lengthy transits to Australia’s northern and north western coasts.
This should not be viewed as a criticism of the RAN in the way it manages its fleet or, indeed, the manner in which the AHS goes about its business.
Rather, it is because of these very reasons which tend to shape and influence HSF activities, which in turn, can restrict the amount of square miles sounded and so hamper the achievement of planned survey days, that serious consideration should now be given to asking how the current trends in rate of effort can be reversed.
Increasing hydrographic output is rapidly becoming a priority discussion point, simply because external pressures to improve current rates of effort are intensifying.
Implications of a Reduced Rate of Effort
Investment in hydrography realises an essential service to national transport infrastructure. Hydrographic services improve safety at sea, contribute to the protection of the marine environment and advance a nation’s economic development and standing.

HMAS Leeuwin
HMAS Leeuwin in Darwin Bay. Credit: CofA
HMAS Leeuwin in Darwin Bay. Credit: CofA
Hydrographic services also play a key role in national security and maritime defence.
Maritime infrastructure development, the opening of new ports, increases in shipping tonnages, the imperative to reduce shipping costs, demands from commercial fisheries and recreational tourist operators seeking to have larger cruise ships berth alongside new and exotic destinations, and the need to update charts of remote areas to better support law enforcement, surveillance and border protection activities, particularly in northern Australia, are all placing significant and growing pressures on the hydrographic survey and charting program.
New charts compiled from more accurate datasets or new chart editions depicting alternate shipping routes are invariably required to meet some of these demands.
Such charting products are reliant on data gathered either from new hydrographic survey work, or from periodic re-survey work as programmed in Hydroscheme.
Hydrographic surveys benefit the economy and industry
When the hydrographic survey and charting work was finally completed to open up Hydrographers Passage in 1984, this alternate route through the outer Barrier Reef reduced the amount of time ships were required to transit through the pristine waters of the inner reef before exiting to the Coral Sea.
Equally importantly, the route reduced the passage length of bulk carriers shipping Queensland coal to Japan by some 250 nm, slicing off about one day’s sailing time to realise significant cost savings for shipowners.
In a similar vein, the recommended maximum draft for ships transiting the Prince of Wales Channel through Torres Strait is 12.2 metres with an under-keel clearance of 10% of draught.
This region is now monitored by an under-keel management system as an aid to navigation, and as a protection measure to enhance the safety of ships transiting this environmentally sensitive area and important trade route.
Ahead of the system being declared operational by the Australian Maritime Safety Authority in December 2011, a study indicated that if the maximum depth of the channel could be increased to 12.5 metres or indeed 12.8 metres, greater cargos (equating to $10.3m and $13.3m respectively) could then be carried.
These two examples showcase hydrography as an essential service in terms of the economic benefits to be gained through new hydrographic survey work and the programming of re-survey work.
It has been suggested that the return on investment from having a fully resourced and effective national hydrographic survey and charting programme is in the order of 1:10 for countries having significant maritime interests or a large dependence on maritime trade.
This cost/benefit ratio alone should be sufficient to justify greater investment in identifying ways to boost current rates of hydrographic effort.
The examples serve to draw attention to the potential implications for Australia should such important work not be undertaken, particularly if new charting products were not produced or if existing charts were not updated.
Reduced rates of effort are also likely to adversely impact other maritime-related areas such as the cruise industry and defence.
Reliable charts are required to ensure the ongoing development of a viable tourist industry, particularly in relation to cruise liners.
This important source of revenue cannot be properly developed if safe navigation to remote tourist destinations is prevented or limited, by a lack of adequate charts.
Similarly, chart coverage must be comprehensive and accurate in order to gain freedom of manoeuvre for warships, to understand where the Navy and equally importantly, where the enemy can operate, and to control the sea space when necessary.
Any further reduction in Hydroscheme rates of effort will only exacerbate the current situation and have a concomitant impact on chart production.
This will require the AHS to further review its program and prioritise those survey tasks in Hydroscheme that can or must be achieved (with the resources available) at the expense of a deliberate decision to not undertake any new survey or re-survey work.
Bathymetry of Darwin Harbour
Geoscience Australia and the Northern Territory government released this never before seen imagery of Darwin’s underwater landscape following results of a seabed mapping exercise conducted in 2015
In the absence of any decision to replace existing HSF capabilities, and certainly as ships age and shipboard surveying systems and equipment reach Life-of-Type (LOT), Hydroscheme is likely to come under additional ‘internal’ pressure in the short- to medium-term.
There are currently significant sustainment issues impacting the HSF.
For example, the HS has a planned life to 2020/21, and there are no published plans for replacement; each of the HS’ three embarked Survey Motor Boats are almost twenty years old.
It is also understood that there are no plans to extend the current LADS contract beyond 2019, while the SML fleet will now reach LOT in 2024/25, having recently undergone a life extension to keep these ships at sea for a further ten years.
In addition to the expense associated with replacing or extending the life of HSF platforms, decisions to extend the LOT for existing hydrographic survey equipment will also need to factor in sizeable cost considerations.
The HS’s Hydrographic Survey System is almost 15 years old. Despite incremental upgrades, as the ship’s primary ‘weapon’ system the Hydrographic Survey System has in the minds of many, already reached the end of its operational life, particularly as new technologies continue to enter the market.
No replacement system for the Hydrographic Survey System has been identified.
The SML’s recent LOT activity to upgrade its ageing Hydrographic Survey System exceeded $30m. Even with such financial injections, other external factors may see some or all of these capabilities being supplanted much earlier, potentially well before any replacement capability is identified.
The RAN is facing sizable capability challenges in maintaining a fleet of Defence-owned ships with contemporary Hydrographic Survey Systems, and then keeping these platforms at sea to steadfastly carry on with the national hydrographic survey task.
The Defence organisation continues to implement a reform agenda on multiple fronts to make Defence more business-like in its dealings, particularly in the areas of shared services and material sustainment.
Committing considerable funds to maintain small fleets of ageing ships and like-capabilities seems at odds with the aim of Defence becoming ‘more efficient, commercially astute and accountable’ and in promoting the responsible use of Commonwealth resources if better alternatives exist.
The annual sustainment costs for the HS and SML fleets currently run to tens of millions of dollars. As the cost of asset ownership continues to rise, is the RAN achieving ‘smart sustainment’ in terms of astute contracting and process improvement in delivering ships and aircraft for the survey mission?
In the face of efficiency dividends and ‘expenditure reduction measures’ and with increasing pressures on the general survey and charting program alternatives need to be considered.
The time is ripe for someone to step up and lend a helping hand.
That someone is industry.
There is no doubt that the RAN must mitigate the issues of cost ownership, relieve the pressures on Hydroscheme, and realise increased survey rates of effort. How best to achieve this? There are three options: maintain the status quo, rationalise current HSF capabilities, or outsource work to industry. Each option will deliver a balanced hydrographic capability to meet the AHS’s national (and military) hydrographic functions, but the critical question is ‘at what cost?’
RAN must make an objective assessment sooner rather than later.
Regardless of the option, it is increasingly apparent that industry has a role to play in the way ahead.
This flythrough video was developed to illustrate the nature of Light Detection and Ranging (LiDAR) elevation data products acquired and derived for coastal regions in Vanuatu, both onshore (topographic) and offshore (bathymetric).
(GeoScience Australia)
Increasing the rate of effort – the options
One option is to pay off some HSF units, particularly those nearing their LOT (e.g. the two HS or the SML fleet) and instead redirect existing/future operating and sustainment funding to the management and conduct of contract surveys.
For example, the HS fleet could be retired early or an earlier decision made to accept the 2015 LOT date for the SML fleet and instead, redirect part of the funding appropriated to upgrade the SML HSS to industry and have industry undertake the survey work instead.
Another option is to weigh up the costs of outsourcing the entire hydrographic capability to the private sector.
There are substantial risks and attendant consequences associated with either option.
For one, the 2013 Defence White Paper states that the Australian Defence Force (ADF) will continue to provide hydrographic survey and maritime charting services and that the ADF will continue to have the capabilities to conduct patrol, mine-hunting and hydrographic roles.
But even in light of an emerging requirement for Defence to ‘ensure that it [can] do what is required of it with the minimum of resources necessary’, surrendering ownership of ships does not always sit comfortably and brings its own set of challenges and questions:
How will Defence’s military hydrographic surveying needs be met if the RAN no longer has recourse to the full suite of Defence-owned HSF platforms?
Will a re-focused and re-structured future military survey force still be able to achieve the military task?
What will be the second and third order effects in terms of reputation if the public perceives that by relinquishing control, the RAN may be failing in its international obligations to provide a vital ‘public good’?
How will the RAN continue to manage and motivate its people and effectively sustain the RAN’s hydrographic survey category if fewer ships exist in which to send officers and sailors to sea to develop their skills and maintain category numbers?
These are important questions for Defence.
The best option, and one that should be considered as a first step to increasing industry involvement, is for the AHS to maintain the HSF status quo but emphasise the importance of the national hydrographic effort to Australia’s future prosperity and identify alternate lines of funding to then be able to engage industry to undertake selected Hydroscheme work.
This engagement by industry would support current HSF efforts with the emphasis being on ‘augmentation’ rather than ‘substitution’ with a focus on the ‘public good’ and intrinsic economic benefits of progressing a comprehensive charting program through improved rates of effort.
Releasing some of the substantial sustainment costs currently required to support the HS each year, for example, would buy a significant amount of industry-sponsored survey time on task.
Any alternate funding should be identified and provided in a measured approach commensurate with the work to be outsourced and the capacity of industry to deliver.
Given the pressing need for the RAN to consolidate and reduce ownership costs, and to ease pressures on the survey and charting program, something must change.
If the next Defence White Paper provides for the RAN’s continued commitment to providing hydrographic survey and maritime charting services, there are options and benefits to consider in bringing industry ‘off the bench’ to contribute and help shoulder some of the work.
How industry has helped in the past
This particular option would certainly help progress Hydroscheme tasks.
This approach is not a new concept and has proved successful in the past.
The existing LADS capability is currently contracted to industry. The AHS also contracts out some of its chart production activities.
As part of the government’s efforts to combat illegal foreign fishing in Australia’s northern waters, the 2006-07 Federal Budget committed $18.5m to enhance charting of the Torres Strait and northern Great Barrier Reef over three years to enable ADF and Australian Customs vessels and ‘other enforcement agency vessels to navigate reliably in previously uncharted waters where illegal activity may occur.’
Two separate airborne bathymetric Light Detection and Ranging (LiDAR) contracts (hydrographic instructions) were awarded to industry in 2006 and 2007 respectively, which resulted in the gathering of 6,360 km2 and 6,151 km2 of bathymetric data.
Undertaken in two phases, the Fisheries Protection Survey and Charting Project expedited the compilation of provisional navigation charts to Border Protection Command to better inform and shape surveillance operations.
By successfully surveying significant parts of the Torres Strait, the project demonstrated the viability and value in engaging industry in contributing to Hydroscheme as well as the ability for the AHS to manage and control a commercial activity that realised significant savings for the Commonwealth.
A number of national and international surveying companies have recently expressed interest in reinvigorating another round of similar strategic partnerships.
Commercial contracts are regularly granted by other hydrographic organisations.
The National Oceanic and Atmospheric Administration (NOAA) manages the hydrographic surveying and charting requirements for some 3.4 million nm2 of US coastal waters through the Office of Coast Survey.
NOAA is the equivalent of the AHS although the administration does not come under the control of the US Defense Department.
Even with its own fleet of ships and with various navigation survey teams at its disposal, NOAA still sees the value in outsourcing hydrographic survey work.
NOAA recently awarded new “five-year contracts to eight private hydrographic survey companies for projects throughout US coast waters … [which will] … provide critical hydrographic data for updating NOAA’s nautical charts.”
NOAA has a significant charting responsibility and considers engagement with industry a worthwhile collaborative activity.
Over the last 15 years, “NOAA has awarded more than USD$400m to private survey companies under Coast Survey’s hydrographic contracting program.”
German and Australian scientists launched a set of groundbreaking, high resolution, shallow water topography maps for the entire Great Barrier Reef.
These world-first digital maps of the coral reefs, using satellite derived depth (bathymetry) techniques, are a critical step towards identifying, managing and essentially preserving and protecting what lies within the waters of this global icon.
The industry’s perspective
The AHS has a monopoly in the conduct of coastal hydrographic surveying.
While the maintenance of inland waters (which include ports and harbours) remains a state and territory responsibility, with port authorities and state-sponsored agencies employing small-scale surveying entities for the specific purpose of conducting port, infrastructure and inland water hydrographic surveys, the job offshore has always been the responsibility of Australia’s national hydrographic authority.
The lack of opportunities in the offshore and coastal hydrographic space, along with the strict control of localised operations at the port and harbour level, means that much of the work for Australian-based commercial hydrographic entities needs to be directed elsewhere, either in offshore oil and gas construction and exploration or more broadly at an international level where opportunities do exist.
Ahead of developing its own hydrographic capability, Saudi Arabia currently contracts its survey requirements to the global marketplace.
Land Information New Zealand (LINZ) offers similar opportunities. Since 2012, LINZ has contracted all of its hydrographic survey requirements to the open market with work being regularly awarded to the very same commercial hydrographic organisations that continue to petition both the AHS and RAN. The lack of any domestic opportunity effectively compels industry to look elsewhere and, in doing so, does little to ease the mounting pressures on the national survey and charting program.

Hydrographic Survey, NZ
IXSURVEY surveyed the stunning Chalky & Preservation Inlets in NZ Fiordland, just one of many survey projects undertaken for LINZ in the past few years
IXSURVEY surveyed the stunning Chalky & Preservation Inlets in NZ Fiordland, just one of many survey projects undertaken for LINZ in the past few years
The potential benefits of engaging industry
1. Savings of 144%
In a tightening economic environment, there needs to be greater innovation in optimising Commonwealth-owned resources to ensure a more efficient approach to doing business.
The most obvious benefit to the taxpayer is the reduction in the cost of asset ownership.
Undertaking hydrographic surveys on a large scale using military assets is expensive.
However, industry sources suggest that by adopting a commercial approach to surveying a selection of complex Hydroscheme areas (nine in total) extending along Australia’s north west coast; the total survey effort could be undertaken more efficiently (by 19 per cent) through the employment of commercial assets as opposed to a pair of SML that might otherwise be used.
Industry can potentially deliver a nominal eight per cent savings figure to the Commonwealth.
The point here is that Navy does not necessarily need to own dedicated assets to get the national task done.
The real cost saving is arguably much greater since commercial operators are not bound by the same time on task restrictions imposed for HSF ships and can instead operate 24/7 for a greater part of a year and be supported by fly-in, fly-out arrangements and by commercial maintenance regimes that are more flexible as to when maintenance is undertaken and, importantly, where this might conducted.
For example, the real cost of undertaking these same nine survey areas under that commercial arrangement, which might require 460 survey days (1.26 years) to complete, could potentially realise savings of 144 per cent.
It would take an SML pair around 1,223 days (3.35 years) to complete surveys of these same areas.
Over an extended period of ten years, the savings could easily be significantly higher potentially amounting to millions of dollars.
2. Survey data available earlier
The upshot of realising greater cost and rate of effort efficiencies by engaging with industry is that survey data is likely to become available much earlier and depending on the availability of resources within the Australian Hydrographic Office, this same data can proceed through the validation process to update the relevant navigational chart(s) and nautical publications in a more timely manner.
This is a hidden cost benefit in having industry commit to the national survey program.
3. Dataset quality improvement
In engaging industry, there is also the advantage of ensuring a greater standard and quality of hydrographic data.
Having competent hydrographic surveyors gathering, rendering and verifying bathymetric and general hydrographic data has long been an objective of the Australasian hydrographic community.
The goal of hydrographic certification, which is administered through the Australasian Hydrographic Surveyors Certification Panel, is to ensure that “hydrographic surveys, critical to navigation safety, to the support the maritime and offshore oil and gas industries and to the protection of the marine environment, are carried out to international standards by competent professionals.”
In Australia and New Zealand, “competency certification has been increasingly adopted as a mandatory requirement for hydrographic survey activities within government and industry.” Importantly, most of Australia’s state-based maritime authorities and Surveyors-General have now adopted Australasian Hydrographic Surveyors Certification Panel certification as the competency standard for all hydrographic surveyors undertaking ‘safety of navigation’ survey work.
In recent times, AHS efforts have increased the profile of certification.
The Australasian Hydrographic Surveyors Certification Panel has elevated industry standards to levels now deemed acceptable for nautical charting purposes.
With an increasing emphasis on individual certification and the emerging requirement to have Level 1-certified surveyors oversee and manage hydrographic data gathering activities, commercial hydrographic operators are now well placed to provide a reliable level of professional certification assurance.
It is in industry’s interests to remain competitive by ensuring all contractual requirements can be met including those mandated professional qualifications relating to a Party Chief or the Surveyor in Charge.
Across the HSF, there are very few Charge-qualified hydrographic surveyors certified by the Australasian Hydrographic Surveyors Certification Panel.
The ‘signing off’ on surveys by those not recognised as being appropriately certified places an added pressure on AHS resourcing because as a rule, anyone gathering hydrographic data who is not Charge-qualified or certified as a Level 1 professional can only submit data for more detailed internal quality control checks and in-house verification (a process that is not necessarily required if the individual ‘in charge’ renders data as being Charge-qualified/certified).
Until this situation changes significantly, in terms of quality, the data gathered by some HSF ships now and in the future must be regarded and assessed differently to datasets rendered by certified industry professionals.
Greater analysis and oversight will be required in the short to medium term to ensure charting standards continue to be met.
“Hydrographic surveyors, like their land surveying counterparts, must increasingly be deemed competent in order to submit hydrographic survey data for official use.”
4. Better flexibility with procurement and operations
Another benefit of outsourcing centres on industry’s evolutionary approach to procurement and flexibility, particularly in acquiring next-generation sensor and system technologies.
Commercial hydrographic operators are able to source contemporary and reliable surveying equipment more readily and in quicker time and thus be in a better position to leverage the latest technical knowledge to undertake surveys of any size, accuracy and scale.
Moreover, industry is able to draw on areas across the wider maritime industry to keep survey mobilisation and de-mobilisation costs to a minimum (noting that these can be quite considerable overheads depending on the area of operations).
This same level of flexibility and responsiveness cannot be matched by the RAN which does not have the same commercial imperatives.
The RAN, like all capability owners within Defence, is beholden to the procurement management and capability development methodologies and practices mandated by the Defence Materiel Organisation.
It is quite conceivable that in such an environment HSF ships and deployable elements will at times gather bathymetric data using dated equipment.
Depending on the prioritisation of future hydrographic capabilities this situation might well endure until ships reach their LOT.
OLEX software making use of WASSP multibeam echo-sounder data in real time on board vessel. Perth, Western Australia.
Fremantle Marine Electronics.
The potential consequences of engaging industry
While the two main benefits of outsourcing manifest as more efficient and reliable data collection and reduced ownership and operating costs, careful consideration still needs to be given to assigning work to industry.
The most obvious consequence is the exponential growth in the amount of hydrographic data collected and then rendered to the Australian Hydrographic Office for charting action.
Datasets will increase in size and complexity because operators using contemporary and innovative technologies will be afforded the opportunity to generate even greater volumes of bathymetric information; new technology in this instance would easily accommodate operator desires to gather more data.
The challenge for the Australian Hydrographic Office is to ensure that it can adapt and maintain the capacity and workforce resources to be able to manage, de-conflict and validate exceptionally large datasets. There is little point in gathering information if it cannot be verified and used effectively.
Linked to this is the ability of the Australian Hydrographic Office to effectively manage and have the subject matter experts reside in-house to administer even a small number of commercial contracts particularly in light of the government’s public service ‘hiring freeze’ and any future constraints on public service recruitment.
As the hydrographic industry matures with new domestic and international operators, there also exists the risk of engaging hydrographic surveyors to undertake work, who might be certified by the Australasian Hydrographic Surveyors Certification Panel on paper, but who may not be practicing at the required professional level.
Then there is the added risk of contracting out to inexperienced or unproven survey organisations, in order to operate within existing funding constraints, for work in environmentally sensitive regions of the Great Barrier Reef and in important shipping areas like the Torres Strait.
Marine contamination as a result of oil spills and pollution due to vessel incidents arising from inaccuracies in charted bathymetric data or errors in tidal modelling would have major ramifications for the environment and for the shipping industry more generally.
In turn this may expose the Commonwealth to potential legal action or at best, unfavourable media scrutiny and adverse public reaction.
These are real risks but on face value, if managed expertly and professionally, each can be appropriately mitigated.
The benefits appear to outweigh such risks and there is merit in at least considering outsourcing components of the national surveying task to industry thereby giving industry a chance to contribute and help reverse current rate of effort trends.
Bathymetry of the Western Margins of Western Australia
“Working together is success”
Hydrographic surveying as a public good is a time consuming business.
The size of the hydrographic task in Australia will always exceed the current naval resources available to do the work.
However, using military ships for the hydrographic task is an expensive exercise.
Outsourcing to industry makes good sense in terms of realising significant cost savings, an improved return on investment for the RAN, and a more effective contribution to the hydrographic survey and charting programme.
Moreover, there are substantial second order benefits for local small to medium enterprises working within a maturing hydrographic community.
Having a national hydrographic program is vital for an island nation like Australia which relies on maritime trade for its economic prosperity.
This program remains under constant pressure from various quarters.
However, the commercial hydrographic industry is eager to contribute and share the work load to help ease such pressures; this has been demonstrated in the past.
Industry can help increase current rates of effort through its growing capacity and enthusiasm for the task, its willingness to participate, and a demonstrable level of flexibility to get the job done and deliver cost effective results.
Using industry resources has the real potential to help address Navy’s cost ownership issues.
The AHS has already proven its ability to augment its organic HSF capability with contracted surveys to meet Government priorities.
By leveraging strategic partnerships through annual contracts for the completion of specific survey areas or alternatively, by establishing longer term standing arrangements that are underpinned by effective checks and balances, industry can again complement current HSF efforts to help make a difference.
The risk for the RAN of not engaging with industry is that the present inefficiencies in survey data collection and the burgeoning cost of ownership will remain.
Importantly, the national surveying program will remain an unremitting and seemingly endless task.
Henry Ford once wrote that ‘coming together is a beginning, keeping together is progress, working together is success‘.Industry can be an important member of the team to deliver an improved hydrographic effect.
The imperative for greater industry involvement is clear and the winds of change may well be starting to blow.
Including industry as part of the solution will require the RAN to make some courageous decisions and shift its strategic intent.
Until then, industry waits ready and willing to help.
Critical global ocean monitoring program struggling to stay afloat without funding promises, warn scientists

From The Guardian by Graham Readfearn
The Argo array of ocean floats supported by 31 countries has
‘revolutionised’ our understanding of the oceans but its future is
uncertain
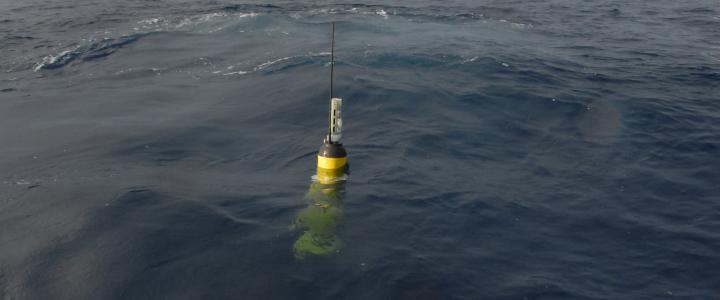
Right now, roughly a kilometre below the surface of an ocean near
you, a yellow cylinder about the size of a golf bag is taking
measurements of the temperature and saltiness of the water.
Every couple of days, the float will drop deeper – down to 2km – and then rise to the surface to transmit its data, before disappearing back into the depths to do the whole thing again.

These floats do this for as long as eight years, until the poor little things die of exhaustion (well, their batteries run out).
There are about 3,800 of these floats scattered across the globe as part of a program called Argo, supported by more than 30 countries.
It’s likely you’ve never heard of Argo and much less likely you’ve ever seen one of the floats.
But for the last decade, climate scientists and oceanographers have been using the data from these Argo floats to plug a gaping ocean-sized hole in our understanding of global warming.
Scientific papers that use the data from these floats are now appearing in science journals at the rate of about one per day.
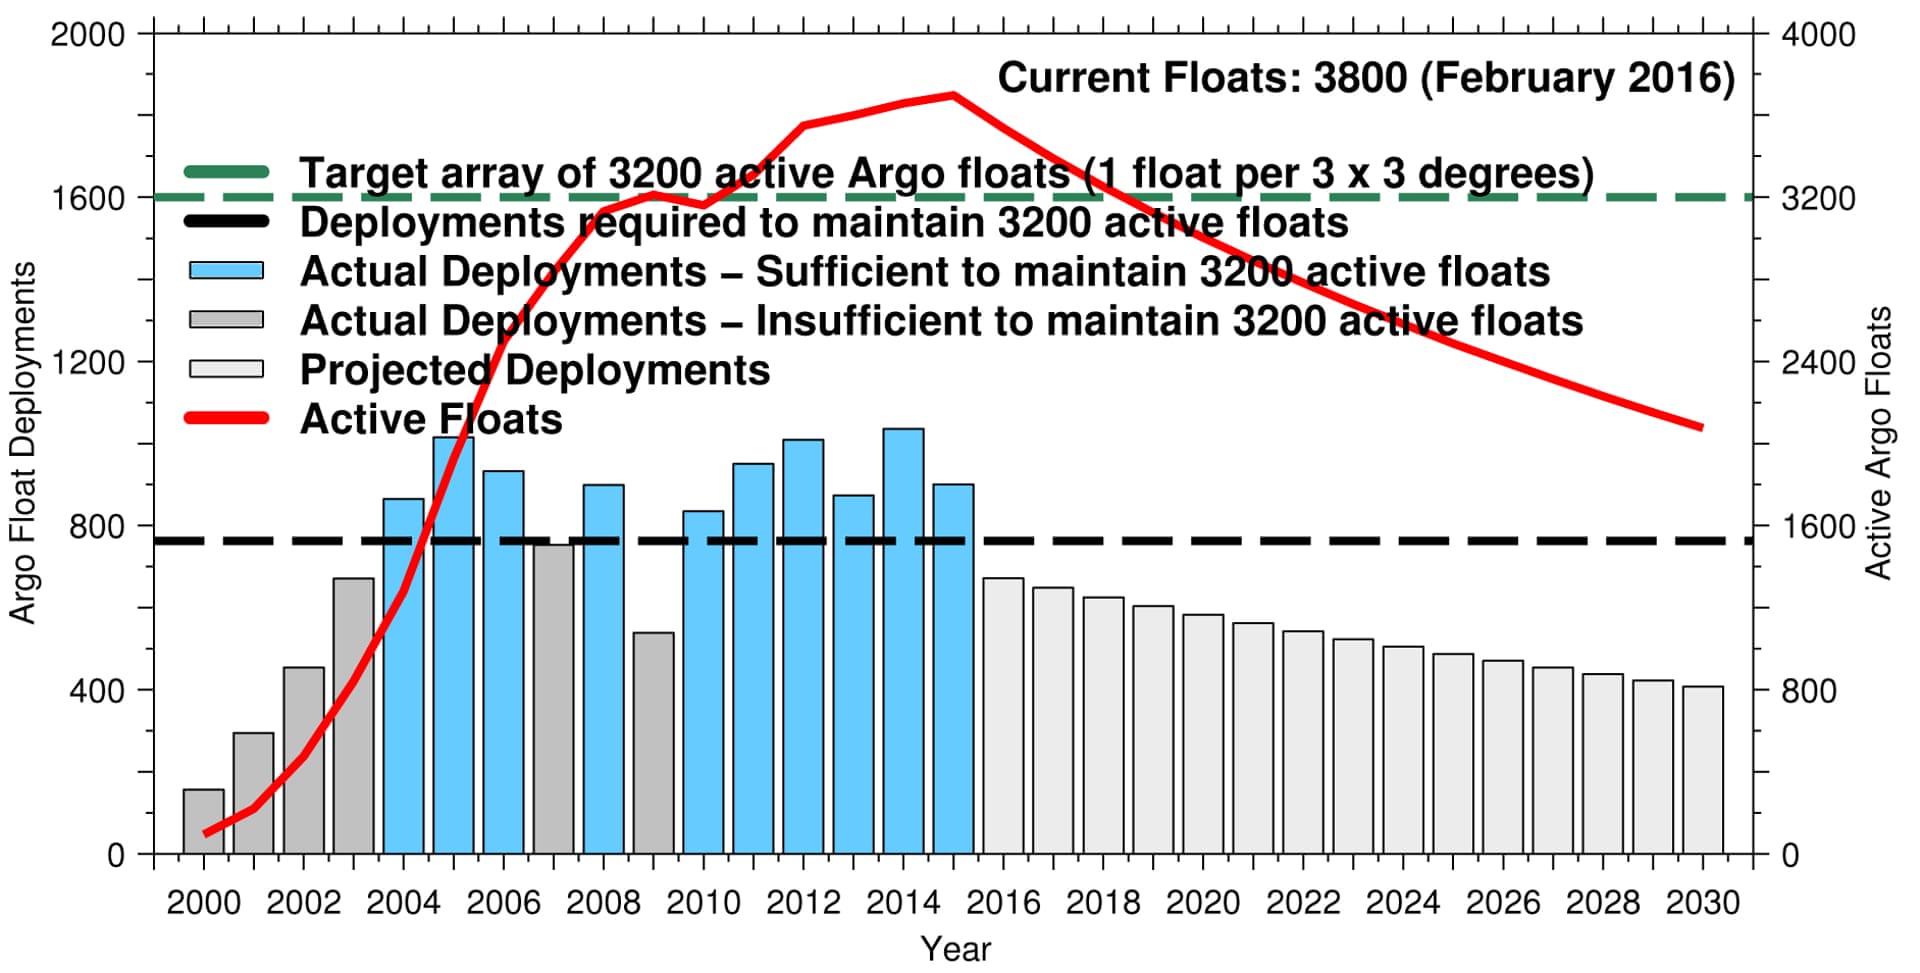
But now, scientists are sounding an alarm for the future of this ocean monitoring system. In a commentary in the journal Nature Climate Change, scientists say cracks are starting to appear in the network, largely because of uncertainties over funding.
The commentary predicts it could be only two years before the number of floats drops below a critical threshold of 3,200, which would “considerably undermine the ability of the observing system to monitor and measure the global ocean”.
Australian Dr Paul Durack, of the US government-funded Program for Climate Model Diagnosis and Intercomparison at the Lawrence Livermore National Laboratory, is one of the scientists sounding the alarm.
He told me:
About 90% of the extra heat from human-caused global warming has ended up there.

Some 31 countries have contributed to the Argo program, with floats costing about US$25,000 each.
The United States funds about half, with about 2,142 of the floats currently in circulation.
France is the second-biggest supporter, with 356 floats, followed by Australia with 346.
Two-thirds of the global ocean is in the southern hemisphere.
CSIRO’s Dr Susan Wijffels is the co-chair of the global Argo program and also the lead scientist for Australia’s contribution to Argo.
In the Nature Climate Change commentary, Wijffels says any drop in the number of deployments of floats could spell trouble.
She told me:

Oceanographer Prof Dean Roemmich, of the Scripps Institution of Oceanography at the University of California, San Diego, is also a co-chair of the global Argo program.
He told me why there’s a fear the comprehensive coverage that Argo gives the world’s oceans could be at risk.
Tim Moltmann is the director of the Integrated Marine Observing System (IMOS), a program funded by the Department of Education and Training and which has provided about half the funding for Australia’s Argo program over the past decade.

Over the past decade, about 20% of the funding for Australia’s Argo program has come from the CSIRO, which also employs about four full-time staff who work to understand and interpret the data and maintain the floats.
Paul Durack is also the scientist who helped to coordinate an open letter signed by almost 3,000 scientists from 60 countries calling on CSIRO to reconsider planned cuts to its climate change research.
He is worried those cuts could make matters worse for Argo.
In the commentary, written before the cuts were announced, Durack writes:
CSIRO chairman David Thodey wrote last week that the agency was “committed” to “contribute to the international Argo floats program”.
But when I asked for details of the commitment and whether the cuts would impact on Argo, a CSIRO spokesperson would only say the agency was “currently working through the impacts of the strategic realignment” with staff and research partners.
Links :
Every couple of days, the float will drop deeper – down to 2km – and then rise to the surface to transmit its data, before disappearing back into the depths to do the whole thing again.

Schematic of a profiling float cycle.
Upon reaching the surface at the end of a cycle, the data obtained are transmitted via satellite with most of the data being available to operational centers and researchers within twenty-four hours of collection.
These floats do this for as long as eight years, until the poor little things die of exhaustion (well, their batteries run out).
There are about 3,800 of these floats scattered across the globe as part of a program called Argo, supported by more than 30 countries.
It’s likely you’ve never heard of Argo and much less likely you’ve ever seen one of the floats.
But for the last decade, climate scientists and oceanographers have been using the data from these Argo floats to plug a gaping ocean-sized hole in our understanding of global warming.
Scientific papers that use the data from these floats are now appearing in science journals at the rate of about one per day.
But now, scientists are sounding an alarm for the future of this ocean monitoring system. In a commentary in the journal Nature Climate Change, scientists say cracks are starting to appear in the network, largely because of uncertainties over funding.
The commentary predicts it could be only two years before the number of floats drops below a critical threshold of 3,200, which would “considerably undermine the ability of the observing system to monitor and measure the global ocean”.
Chart showing forecasted deployments of Argo ocean monitoring floats
Photograph: Paul Durack
Australian Dr Paul Durack, of the US government-funded Program for Climate Model Diagnosis and Intercomparison at the Lawrence Livermore National Laboratory, is one of the scientists sounding the alarm.
He told me:
Argo is an amazing entity – there are at least 30 nations involved – and it’s giving us observations that we have never had before. From about 2005, Argo gave us comprehensive ocean data – if you don’t have data you can’t say anything. Basically, it has completely changed the game.Knowing what’s happening in the globe’s oceans is critical.
About 90% of the extra heat from human-caused global warming has ended up there.
The distribution of active floats in the Argo array, colour coded by country that owns the float,
as of the end of September 2015
see data on Coriolis
Some 31 countries have contributed to the Argo program, with floats costing about US$25,000 each.
The United States funds about half, with about 2,142 of the floats currently in circulation.
France is the second-biggest supporter, with 356 floats, followed by Australia with 346.
Two-thirds of the global ocean is in the southern hemisphere.
Number of papers, by year, published in refereed journals and that are extensively or totally dependent on the availability of Argo data as of March 2015.
CSIRO’s Dr Susan Wijffels is the co-chair of the global Argo program and also the lead scientist for Australia’s contribution to Argo.
In the Nature Climate Change commentary, Wijffels says any drop in the number of deployments of floats could spell trouble.
She told me:
Argo is fundamental because this all comes back to the heat problem.
The key thing that matters for the Earth is how much extra heat is retained in the system.
While we have seen this huge debate over the last 15 years about this so-called ‘hiatus’, really what Argo shows us is that surface variability [in temperature] is just a re-organisation of heat.
When you get below a couple of hundred metres you see the inexorable growth of global warming happening in the oceans.
That’s driving a good chunk of the sea level rise.
It is telling us what the radiation imbalance is at the top of the atmosphere.
Once that heat and that carbon is down there in the deep ocean it’s there for decades – if not longer – and it’s locking in that warming.
We see that warming in Argo right down to the depths of our measurement – right down to two kilometres and its probably extending further.
Oceanographer Prof Dean Roemmich, of the Scripps Institution of Oceanography at the University of California, San Diego, is also a co-chair of the global Argo program.
He told me why there’s a fear the comprehensive coverage that Argo gives the world’s oceans could be at risk.
In most nations Argo is supported by research funds – rather than as operational oceanography – with no mechanism for inflation or for long-term funding.Roemmich says Australian scientists are “world leaders in basic research using Argo data, particularly in the Southern Ocean” and that the country also provides critical operational support.
So far Argo has been successful in increasing the lifetime of floats so that less deployments are needed to maintain the array and bringing in new national programs to sustain the level of total deployments.
Durack points out these advances are difficult to sustain and without them the array would decline. This is an important caution, and along with it we need to continue making the case for Argo’s great value in order to increase support from Argo national programs.
It has been revolutionary.IMOS has funded about half of Australia’s Argo effort so far, says Moltmann.
What we knew about the subsurface ocean before Argo was pretty much limited to what we could get from ships – dropping instruments into the water and getting measurements.
You can imagine that’s pretty sparse
What’s critically important from an Australian perspective is that from a historical point of view, measurements of the oceans have been dominated by the northern hemisphere.
Argo has been critically important for Australia and the southern hemisphere because it has enabled us to bootstrap our subsurface observing capability in a remarkable way.
That’s how we know that ocean heat content is changing.
That’s how we know that so-called ‘pause’ [in global warming] isn’t really a pause if you look at the whole system, because the heat has been building up in the ocean.

All of the boats participating in the Barcelona World Race 2014/15 launched an Argo profiling float (Arvor-L CTD profiling) into the ocean, as part of their round-the-world voyage.
(Neutrogena Imoca 60', Guillermo Altadill & José Muñoz)
Over the past decade, about 20% of the funding for Australia’s Argo program has come from the CSIRO, which also employs about four full-time staff who work to understand and interpret the data and maintain the floats.
Paul Durack is also the scientist who helped to coordinate an open letter signed by almost 3,000 scientists from 60 countries calling on CSIRO to reconsider planned cuts to its climate change research.
He is worried those cuts could make matters worse for Argo.
In the commentary, written before the cuts were announced, Durack writes:
Future forecasts are inherently difficult to generate, due to the short-term nature of national budgets, along with unanticipated technology and deployment problems or new technology breakthroughs.
These are further confounded by a critical dependence on each and every nation that contributes to the array – and a loss of just one of these key contributors will have a profound impact.
CSIRO chairman David Thodey wrote last week that the agency was “committed” to “contribute to the international Argo floats program”.
But when I asked for details of the commitment and whether the cuts would impact on Argo, a CSIRO spokesperson would only say the agency was “currently working through the impacts of the strategic realignment” with staff and research partners.
Links :
Wednesday, February 24, 2016
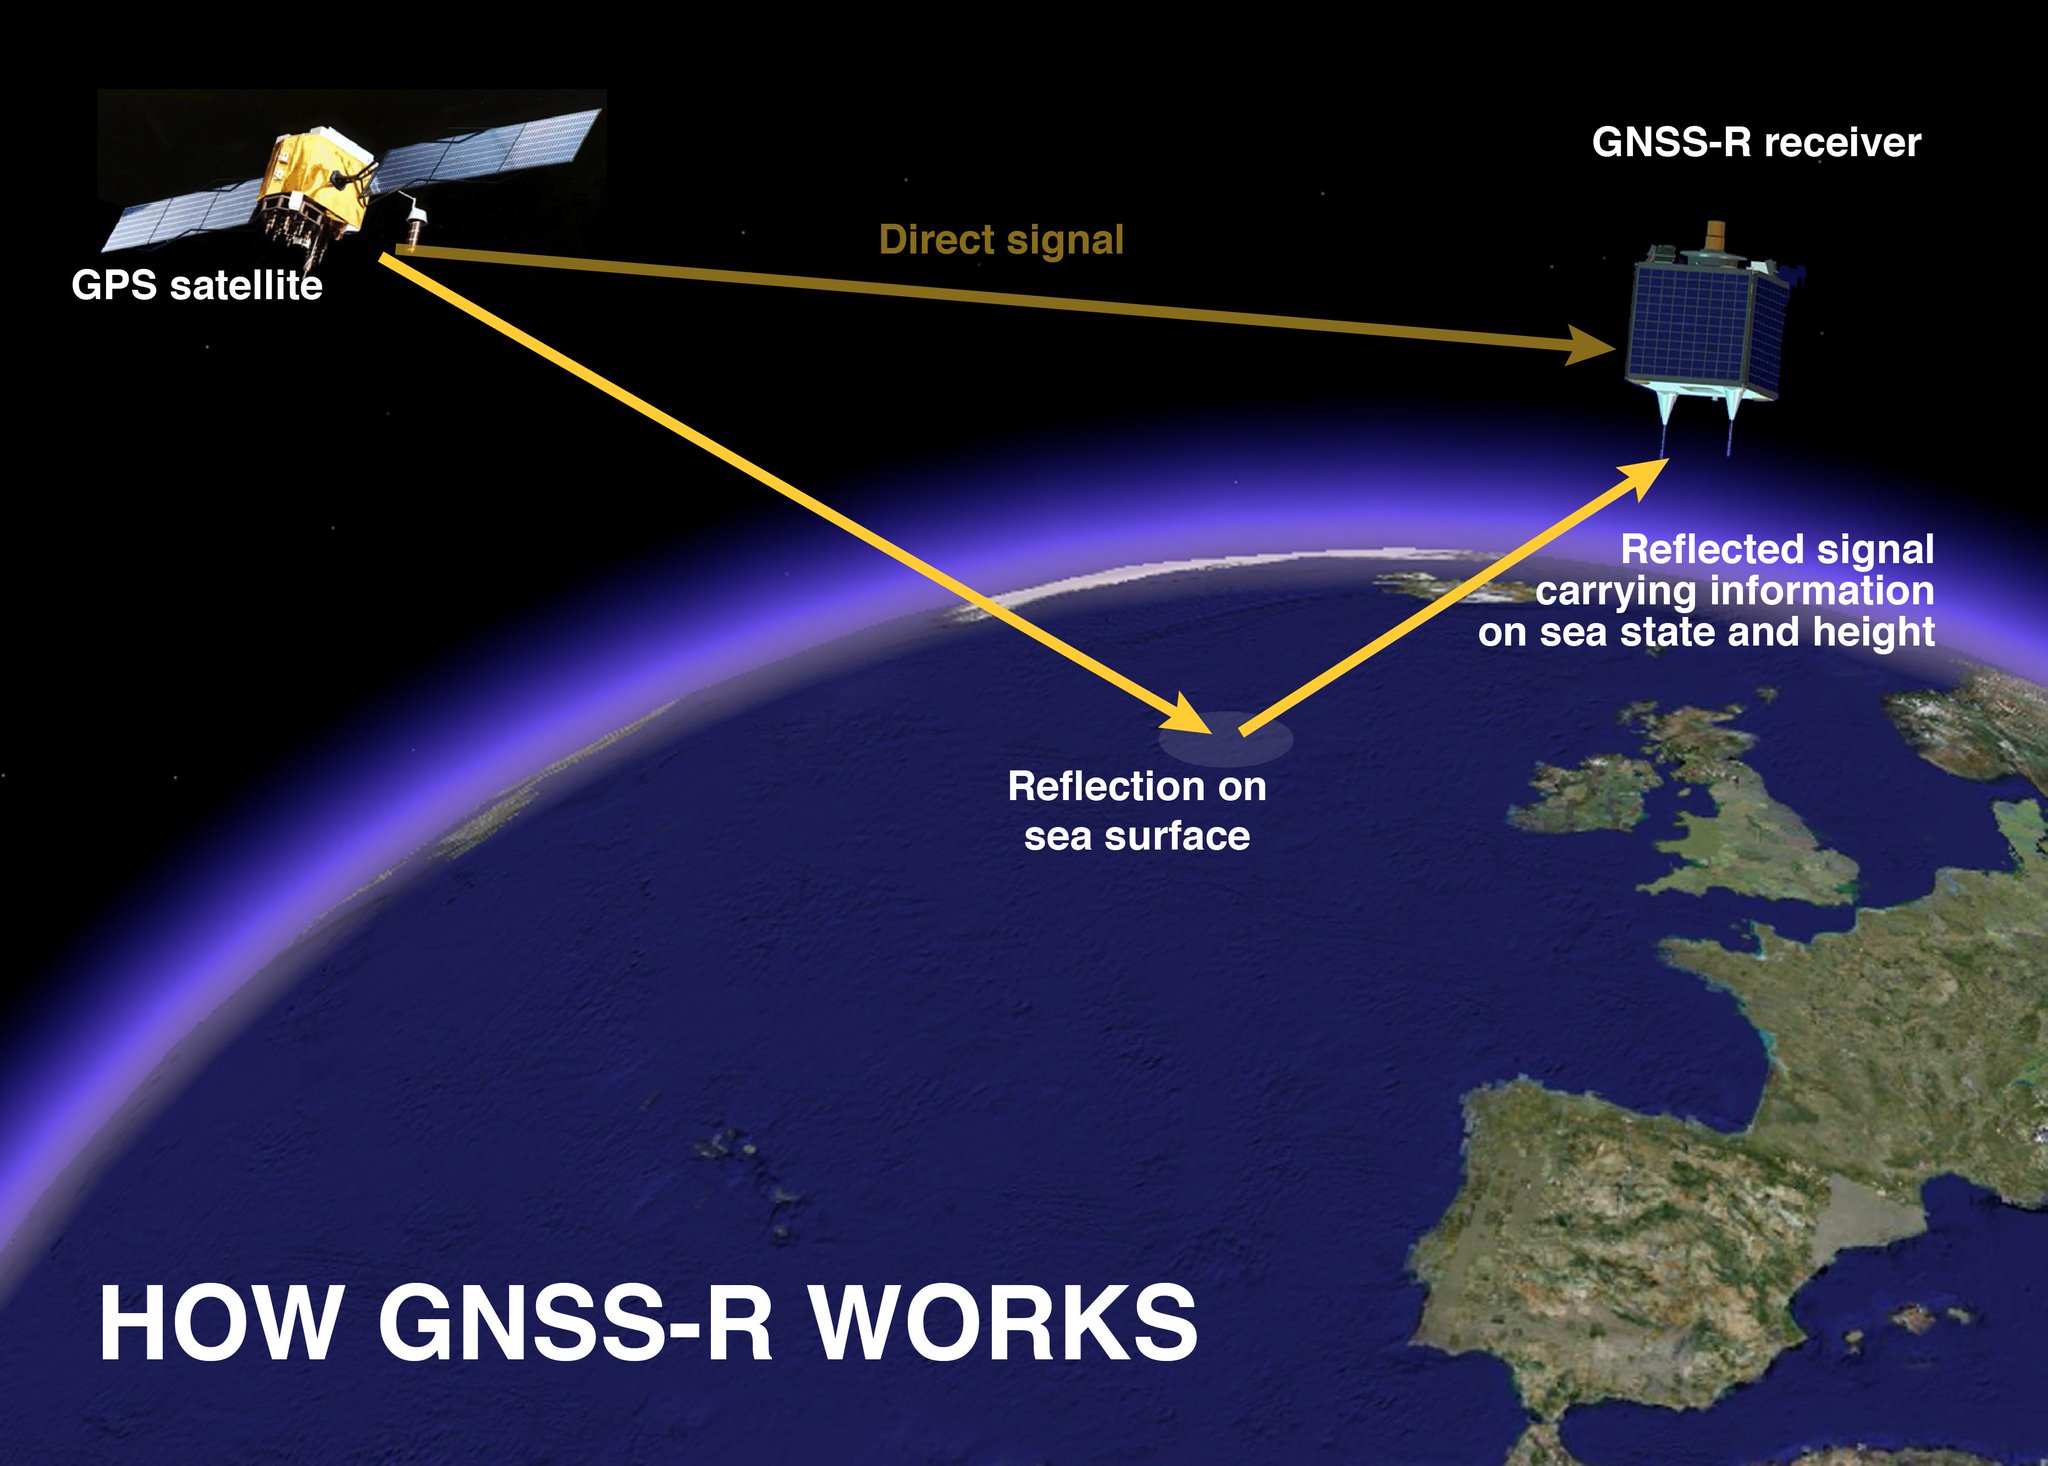
Sea level mapped from space with GPS reflections
A depiction of spatial sampling by the NASA CYGNSS satellite constellation
The GPS signal used for ‘sat-navs’ could help improve understanding of ocean currents, according to new research published in Geophysical Research Letters by National Oceanography Centre (NOC) scientists, alongside colleagues from the University of Michigan and Jet Propulsion Laboratory.
As part of this research, sea surface height has been measured from space using GPS signals reflected off the sea surface for the first time.
Information from these GPS signal reflections can be potentially used by scientists to monitor ocean currents by measuring the slopes currents cause in the ocean’s surface.
Ocean surface height measurements are routinely made from space by radar altimeters, but this new study is the first that uses the GPS reflections.
The data for this research was acquired from the TechDemoSat-1 satellite, launched in 2014 by Surrey Satellite Technology Ltd.
Find out how the GPS signal used for ‘sat-navs’ helps us better understand ocean currents
The largest ‘bulges’ are due to variations in the Earth’s gravity field. On top of those there are smaller, shorter variations due to sea surface currents.
We are really encouraged by our results since it demonstrates for the first time that we are able to map the overall sea surface height from space using the GPS-reflections technique.
This leads us to think that in the near future we should be able to map currents from space by detecting even smaller variations in sea surface height.”
GNSS-Reflectometry (GNSS-R) is the general term for reflectometry using navigation signals, including GPS as well as the European equivalent Galileo.
The advantage of using GNSS-R is that it uses the GNSS transmitters already in orbit, and the lightweight, low-power receivers can be launched into space relatively cost-effectively.
Existing satellite altimeters, although very accurate, are not in enough number to sample the ocean well at scales below 100 km.
A constellation of GNSS-Reflectometry receivers would provide a thirty-fold improvement on the amount of data that could be gathered.
Such a constellation will be launched in late 2016 as part of the NASA CYGNSS mission, to watch an animation of in the above video.
Dr Maria Paola Clarizia, a visiting scientist at NOC from University of Michigan, and the lead author of the paper, stressed that “the UK has been a pioneer in using GNSS reflectometry to measure ocean features, and the NOC has led the field in analysing the data."
Until recently we could only measure wind speed from satellite GNSS-R data, so this new ability to also observe sea-surface height is a real breakthrough - provided we can retrieve accurate heights. Our paper is a first step in that direction.”
NOC’s long involvement with research in GNSS-R has been led by Christine Gommenginger, the head of Satellite Oceanography at the NOC.
Results published by NOC scientists in 2015 have already demonstrated the capabilities of spaceborne GNSS-R for ocean surface wind speed retrieval.
This research is party supported by Natural Environmental Research Council (NERC) National Capability funding, and forms part of the NOC’s ongoing use of satellite data to investigate the ocean on a global scale.
Tuesday, February 23, 2016
The data, my friend, is blowing in the wind
From Scientific American by Amanda Montañez
Interactive data visualization maps predicted wind speeds around the world
Earlier this month, an exciting new collaboration in data visualization, technology, and climate science made its public debut.
Project Ukko comprises an enormous amount of data on past, present, and future wind speeds around the world.
My first thought upon learning of the project was that it takes a brave designer to follow Fernanda Viégas and Martin Waatenberg in the world of elegant, data-driven wind maps.
Leave it to Moritz Stefaner of Truth & Beauty Operations (and Scientific American infographics fame), not just to take such a project on, but to knock it out of the park.
At a basic user experience level, Project Ukko is a classic implementation of Ben Schneiderman’s mantra on interactive data visualization: overview first, zoom and filter, then details on demand.
Start with an overall view of the map, and become acquainted with the key graphical indicators.
Right away, the tooltips and cursor cues invite intuitive actions: zoom in and out, pan around, and click on different locations.
Then, as the information bar appears at the bottom of the screen, hover over each data point to reveal its specific associated values.

What is truly impressive about the visualization, however, is the skillful consolidation of many dimensions of data.
Even for experts in the field, this is often the most challenging part of visualizing a particularly rich dataset: how to show all relevant facets of the data one in unified, economical, and legible composition that tells the story effectively?
Stefaner has used principles of visual perception to convey the most important parts of the story up front.
Line thickness clearly denotes amplitude (i.e. wind speed).
Change over time is captured primarily (and logically) by line slope, but also secondarily by color—an interesting design decision which serves to emphasize this aspect of the data without compromising accessibility for color blind users.
Finally, opacity is employed to express varying degrees of certainty about the quality of data (“skill”), often a problematic variable in data visualization.

It may be worth noting that, in contrast to Viégas and Waatenberg’s wind map, wind direction is not indicated here.
Since wind turbines are designed to turn in response to wind direction, this would not be a relevant variable for Project Ukko’s purpose of determining where wind power would be most efficient.
Perhaps the only thing missing from this graphic is a field defining the location for each data point. While this information can be roughly inferred based on the position of each line on the map, their precise locations are not immediately clear, and it’s easy to lose track of the geography upon zooming in.
Minor criticisms aside, this project represents a remarkable feat in data visualization, and more broadly, a triumph of collaboration.
Presented as a predictive tool for use in the wind energy industry, it has practical applications that stand to make a difference in the real world.
Moreover, it shows what can happen when science, technology, and information design come together in pursuit of a common goal.
When such collaborations go well, the result is often as beautiful as it is instructive.
Links :
Interactive data visualization maps predicted wind speeds around the world
Earlier this month, an exciting new collaboration in data visualization, technology, and climate science made its public debut.
Project Ukko comprises an enormous amount of data on past, present, and future wind speeds around the world.
My first thought upon learning of the project was that it takes a brave designer to follow Fernanda Viégas and Martin Waatenberg in the world of elegant, data-driven wind maps.
Leave it to Moritz Stefaner of Truth & Beauty Operations (and Scientific American infographics fame), not just to take such a project on, but to knock it out of the park.
Project Ukko is a beautiful new mapped visualization of seasonal wind predictions.
The map is a visual interface which provides industry, energy traders, wind farm managers and others with a way to access predictions about future wind conditions.
On the map you can drill down to view regional wind forecasts at a detailed level.
The line symbols on the map represent predicted wind speed through line thickness and the predicted wind speed via the tilt and color of the line.
The more tilted the lines then the stronger the predicted indication of significant changes in wind speed.
Click on a line on the map and you can view information on the historical seasonal average wind speeds for the last thirty years in that region.
A graph is also available showing the results of 51 simulations run to provide the seasonal wind prediction at this location.
The 'Skill' percentage shows how well the prediction system has performed in this region in the past.
At a basic user experience level, Project Ukko is a classic implementation of Ben Schneiderman’s mantra on interactive data visualization: overview first, zoom and filter, then details on demand.
Start with an overall view of the map, and become acquainted with the key graphical indicators.
Right away, the tooltips and cursor cues invite intuitive actions: zoom in and out, pan around, and click on different locations.
Then, as the information bar appears at the bottom of the screen, hover over each data point to reveal its specific associated values.

with data visualisation by Moritz Stefaner
What is truly impressive about the visualization, however, is the skillful consolidation of many dimensions of data.
Even for experts in the field, this is often the most challenging part of visualizing a particularly rich dataset: how to show all relevant facets of the data one in unified, economical, and legible composition that tells the story effectively?
Stefaner has used principles of visual perception to convey the most important parts of the story up front.
Line thickness clearly denotes amplitude (i.e. wind speed).
Change over time is captured primarily (and logically) by line slope, but also secondarily by color—an interesting design decision which serves to emphasize this aspect of the data without compromising accessibility for color blind users.
Finally, opacity is employed to express varying degrees of certainty about the quality of data (“skill”), often a problematic variable in data visualization.

It may be worth noting that, in contrast to Viégas and Waatenberg’s wind map, wind direction is not indicated here.
Since wind turbines are designed to turn in response to wind direction, this would not be a relevant variable for Project Ukko’s purpose of determining where wind power would be most efficient.
Perhaps the only thing missing from this graphic is a field defining the location for each data point. While this information can be roughly inferred based on the position of each line on the map, their precise locations are not immediately clear, and it’s easy to lose track of the geography upon zooming in.
Minor criticisms aside, this project represents a remarkable feat in data visualization, and more broadly, a triumph of collaboration.
Presented as a predictive tool for use in the wind energy industry, it has practical applications that stand to make a difference in the real world.
Moreover, it shows what can happen when science, technology, and information design come together in pursuit of a common goal.
When such collaborations go well, the result is often as beautiful as it is instructive.
Links :
- Wired : Project Ukko is a clever way to visualize the complexities of wind
- GeoGarage blog : Real-time world winds animated map / Isaac storm as it appears in a visualization of America's wind (earth.nullschool.net)
- Engaget : Moving wind forecast puts beautiful weather in your browser (windyty.com)
- Apps : Weather 4D / luckgrib.com
Monday, February 22, 2016

US Department of State seeks to clarify meaning of China’s 9-dash line

Original 1947 11-dashed lines map of China
entitled "Location Map of the South Sea Islands"
Five-part series summarizing and commenting the 5 December 2014 US Department of State “Limits in the Seas” issue explaining the different ways in which one may interpret Chinese maritime claims in the South China Sea.
It is a long-standing US policy to try to get China to frame her maritime claims in terms of UNCLOS.
Despite repeatedly stating that it will not take sides in territorial disputes in East Asia, Washington remains keenly interested in the ultimate fate of the South China Sea.
In addition to perennial calls to settle disputes peacefully, regular reminders of the importance of freedom of navigation, military aid to regional actors like the Philippines, and support for a more active policy by non-littoral maritime democracies like India and Japan, the US Department of State (DOS) took a further step late last year by issuing a document, part of its “Limits in the Seas” series. The text seeks to explain the different ways in which one may interpret Chinese maritime claims in the South China Sea (“that the dashes are (1) lines within which China claims sovereignty over the islands, along with the maritime zones those islands would generate under the LOS Convention; (2) national boundary lines; or (3) the limits of so-called historic maritime claims of varying types”).
It concludes that the “dashed-line claim does not accord with the international law of the sea” unless “China clarifies that” it “reflects only a claim to islands within that line and any maritime zones.”
The text includes supporting Chinese official views, without attributing “to China the views of analysis of non-government sources, such as legal or other Chinese academics.”
Concerning this latter restriction, although it is of course official sources which may be considered to be most authoritative when it comes to interpreting a government’s position, we should not forget that administrations in different countries will often resort to “two-track diplomacy” or employ semi or non-official back channels to test the waters and lay the groundwork for future formal negotiations.
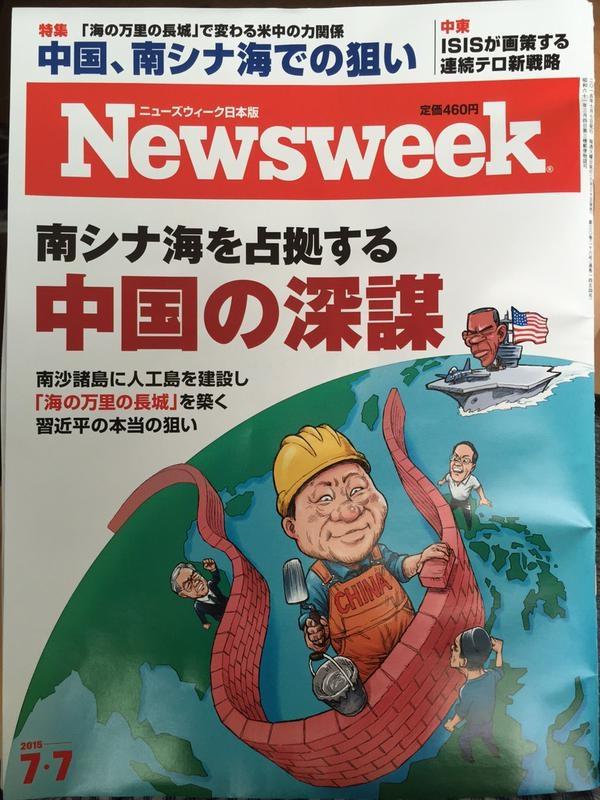
Newsweek Japan
The object of this five-part series is to summarize the DOS document, while commenting on some of its most relevant features, and where appropriate going beyond the text and examining related aspects of the South China Sea conflict.
Tyranny of History: Can Washington claim not to take sides on Filipino territorial claims?
Before summarizing the “Limits in the Seas” document, we should note that the American policy of not taking sides concerning the ultimate issue of sovereignty could be challenged given Washington’s past sovereignty over the Philippine Archipelago.
While this has not been publicly stressed by Manila to date, it could enter the debate as a means of putting more pressure on Washington to adopt a more robust posture.
Chinese Claims and Possible Interpretations According to International Law
In line with long-standing US demands that Beijing clarify the ultimate nature of her South China Sea claims, the DOS document analyzes those figures within UNCLOS and customary international law which may provide cover to Beijing’s claims.
Issued on 5 December 2014, the Department of State paper begins by stressing that “China has not clarified through legislation, proclamation, or other official statements the legal basis or nature of its claim associated with the dashed-line map”, explains the “origins and evolution” of the dashed-line maps, provides a summary of the different maritime zones recognized and regulated by UNCLOS, and then proceeds to explain and discuss three possible interpretations of that claim “and the extent to which those interpretations are consistent with the international law of the sea.”
The document contains a number of maps, including (Map 1) that referred to in China’s two May 2009 notes verbales to the UN Secretary General, which stated that “China has indisputable sovereignty over the islands in the South China Sea and the adjacent waters, and enjoys sovereign rights and jurisdiction over the relevant waters as well as the seabed and subsoil thereof.
The above position is consistently held by the Chinese government, and is widely known by the international community.”

Nine-dash map attached to China’s two 2009 Notes Verbales
A Look at Chinese Map Quality and Accuracy
The text first outlines the history of China’s maps of the South China Sea containing dashed lines, starting with a 1947 map published by the Nationalist government, noting that later PRC maps “appear to follow the old maps” (see L. Jinming and L. Dexia, “The Dotted Line on the Chinese Map of the South China Sea: A Note”, Ocean Dev’t & Int’l L., Volume 34, 2003, pp. 287-95, p. 289-290) with two significant changes: the removal of two dashes inside the Gulf of Tonkin (in an area partly delimited by Vietnam and the PRC in 2000) and the addition of a tenth dash to the East of Taiwan.
These two changes can be interpreted in different ways, to some degree contradictory.
On the one hand, the partial delimitation agreement with Vietnam could be seen as evidence of Chinese pragmatism and flexibility, and proof that it is possible for countries in the region to at least partly settle their disputes by diplomacy.
On the other, explicitly encompassing Taiwan with an extra dash may be seen as a reinforcement of Chinese claims on the island not necessarily based on the will of her population.
Alternatively, it could simply be a way to more comprehensively encompass the waters and features that Beijing (either directly or via Taipei) wishes to master.
The paper then examines successive Chinese maps from a cartographic perspective, stressing that “China has not published geographic coordinates specifying the location of the dashes.
Therefore, all calculations in this study relating to the dashed line are approximate.”
A similar criticism has sometimes been made of the San Francisco Treaty.
The text also notes that “China does not assign numbers to the dashes,” and therefore those in the study are for “descriptive purposes only.”
They “are not uniformly distributed,” being “separated from one another by between 106 (dashes 7 and 8) and 274 (dashes 3 and 4) nautical miles (nm).”
This section of the paper stresses that “Nothing in this study is intended to take a definitive position regarding which features in the South China Sea are ‘islands’ under Article 121 of the LOS Convention or whether any such islands are ‘rocks’ under Article 121(3).”
This is in line with Washington’s refusal to take sides concerning the ultimate sovereignty disputes in the region.
The text notes that the “dashes are located in relatively close proximity to the mainland coasts and coastal islands of the littoral States surrounding the South China Sea,” and explains that, for example, Dash 4 is 24 nm from Borneo’s coast, part of Malaysia.
Generally speaking, “the dashes are generally closer to the surrounding coasts of neighboring States than they are to the closest islands within the South China Sea,” and as explained later this is significant when it comes to interpreting the possible meaning of China’s dashed line, since one of the principles of the Law of the Sea is that land dominates the sea, and thus maritime boundaries tend as a general rule to be equidistant.
That is, maritime boundaries tend to be roughly half way between two shores belonging to different states.
To hammer home this point, the study includes a set of six maps illustrating this.
The report criticizes the technical quality of the PRC maps, saying that they are inconsistent, thus making it “complicated” to describe the dashed line, whose dashes are depicted in different maps “in varying sizes and locations.”
Again, this is important in light of possible interpretations of Chinese claims, since this lack of consistency and quality not only obfuscates Chinese claims, introducing an additional measure of ambiguity, but also makes it more difficult to ascertain whether historical claims are being made and whether they are acceptable in light of international law.
The dashes change from map to map, with those “from the 2009 map” being “generally shorter and closer to the coasts of neighboring States” than those in the 1947 map.
The dashed lines in these two maps are illustrated and compared in Map 5 of the document.
The section concludes noting that the 2009 map, which Beijing distributed to the international community “is also cartographically inconsistent with other published Chinese maps.”

Reviewing maritime zones and historic claims
The paper’s second section basically consists of a summary explanation of “Maritime Zones,” “Maritime Boundaries,” and “’Historic’ Bays and Title” according to UNCLOS. Three aspects are of particular significance.
First of all, that the interpretation provided is not necessarily that considered correct by China. Although this is not always squarely addressed, when discussing whether Chinese claims in the South China Sea are or are not in accordance with international law we should first define international law, and there is the possibility that as China returns to a position of preeminence she may interpret some of its key provisions in a different way.
Second, as the paper itself notes, while China ratified UNCLOS in 1996, the United States has not, although she “considers the substantive provisions of the LOS Convention cited in this study to reflect customary international law, as do international courts and tribunals.”
Not all voices take such a straightforward view of Washington’s failure to ratify the convention while claiming that it is mostly a restatement of customary law and therefore applicable anyway.
The DOS paper includes a page devoted to “’Historic’ Bays and Title,” which text stresses that “The burden of establishing the existence of a historic bay or historic title is on the claimant,” adding that the US position is that in order to do this the country in question must “demonstrate (1) open, notorious, and effective exercise of authority over the body of water in question; (2) continuous exercise of that authority; and (3) acquiescence by foreign States in the exercise of that authority.”
This passage reflects the US traditional position, as noted by J. Ashley Roach and Robert W. Smith (Editors) “In December 1986, the U.S. Department of State, Bureau of Public Affairs, published ‘Navigation Rights and the Gulf of Sidra,’ in GIST, a reference aid on U.S. foreign relations.
The study discussed the history of U.S. responses, dating to the 18th century, to attempts by North African States to restrict navigation in these waters.
The GIST stated, in part, that: Current law and customs: By custom, nations may lay historic claim to those bays and gulfs over which they have exhibited such a degree of open, notorious, continuous, and unchallenged control for an extended period of time as to preclude traditional high seas freedoms within such waters.
Those waters (closed off by straight baselines) are treated as if they were part of the nation’s land mass, and the navigation of foreign vessels is generally subject to complete control by the nation.”
The text explains that this traditional American perspective is in line with the International Court of Justice and “the 1962 study on the ‘Juridical Regime of Historic Waters, Including Historic Bays,’ commissioned by the Conference that adopted the 1958 Geneva Conventions on the law of the sea.”
It cites a number of cases, among them the 1951 Fisheries Case (U.K. v. Norway).
It then turns its attention to the regulation of historic claims in Articles 10 and 15 of UNCLOS, saying that they are “strictly limited geographically and substantively” and apply “only with respect to bays and similar near-shore coastal configurations, not in areas of EEZ, continental shelf, or high seas.”
Just like, when examining China’s posture we must take into account, as discussed later, the country’s history, and in particular the Opium Wars and their aftermath, American history has also shaped Washington’s perceptions and principles.
The Barbary Wars were widely seen as laying down fundamental principles of national policy such as rejection of blackmail, freedom of navigation, and the right and duty to intervene far from American shores whenever the country’s interests, principles, and prestige were at stake.
In the words of Jason Zeledon “The United States’s conflicts with the Barbary States (Algiers, Morocco, Tripoli, and Tunis) from 1784-1815 gripped the young nation, featured bold attempts by American policymakers to defend U.S. trade in the Mediterranean region and assert leadership in international affairs, set important precedents in American foreign relations (including the first U.S.-supported coup attempt that generated the line ‘to the shores of Tripoli’ in the Marine Corps Hymn), provided vital naval training for the War of 1812, and helped create an early sense of American exceptionalism.”
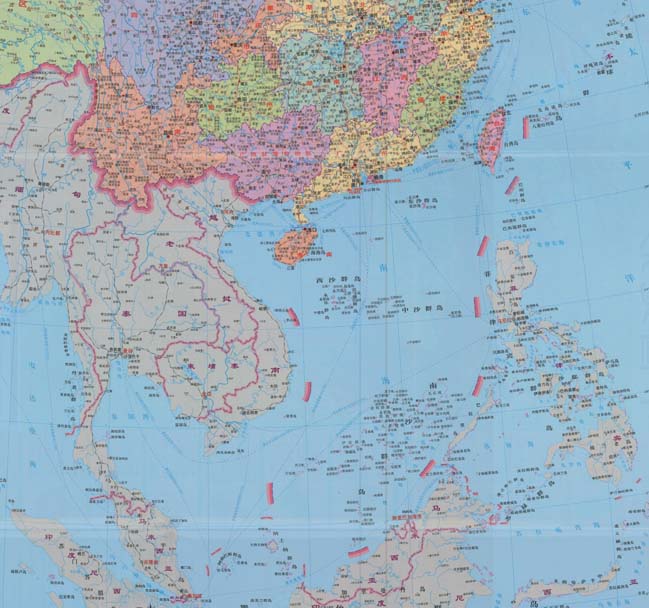
South China Sea map first published in January 2013 by China’s state
mapping authority Sinomap Press, featureing 10 dashes instead of the
previous nine.
Thus, while China’s position concerning the South China Sea may end up resting at least in part, on the concept of historic waters, even if this is not the case history and perceptions of history will surely still play an important role in determining Beijing’s policy.
This, however, is not something only taking place within China, since no regional or extra-regional actor is immune to the phenomenon, adding to the already tense situation in South East Asia.
In particular, a couple of centuries later, both the Barbary Wars and the Opium Wars remain powerful factors projecting their shadow on American and Chinese foreign and defense policy.
Trying to make Chinese claims fit with UNCLOS: three possible interpretations.
The Department of State report then turns its attention to what constitutes the core of the paper, that is three possible interpretations of Chinese claims in the South China Sea and their compatibility or otherwise with International Law.
Even without the need to fully agree with the paper’s views, it responds to a widely heard demand for clarification of China’s posture.
In this regard, before we sum up the three perspectives, we should remember that while it is an interesting and useful exercise to try to fit Beijing’s (not always consistent) claims within the framework of UNCLOS and customary international law, China may have its own interpretations of the law, or seek to promote a different one.
Since international law to a great extent reflects power realities on the ground, this should not come as a surprise, in particular given that in the view of China’s leaders many aspects of international law, and in particular the law of the sea, result from the same power dynamics that led to the country’s fragmentation and subservience from the mid XIX Century.
The paper also stresses that it is only in “maritime claims” (emphasis in the original) where “China’s position is unclear.”
On the other hand, while some other countries do not accept them, Chinese claims on land are unequivocal, Beijing claiming “sovereignty over the islands within the dashed line”.
The assertion in China’s 2009 Notes Verbales that “China has indisputable sovereignty over the islands in the South China Sea” is consistent with previous statements, and means that there is no doubt that Beijing considers all such islands to be national territory of the PRC.
_-_Geographicus_-_EastIndies-cary-1801.jpg)
An 1801 map of the East Indies Isles.
Most of the names have changed since then.
“Dashed Line as a Historic Claim”
The third way to see the dashed-line, according to the Limits in the Seas series paper, would be as a historic claim.
Under UNCLOS this can take two forms, “one of sovereignty over the maritime space (‘historic waters’ or ‘historic title’)” or “some lesser set of rights (‘historic rights’) to the maritime space.”
The paper devotes much more room to discussing this possibility than to the two previous alternative interpretations.
It begins by pointing out that “some Chinese government statements and acts could be read to support a version of this historic claim interpretation”, and by noting that given that “the dashed-line maps pre-date the People’s Republic of China, the views of Taiwan are also of interest.”
Concerning the Island’s claims, the text underlines that while in 1993 its “Policy Guidelines for the South China Sea” said that the dashed lines enclosed a “’historic water limit’ within which Taiwan ‘possesses all rights and interests’” (see K-H. Wang, “The ROC’s Maritime Claims and Practices with Special Reference to the South China Sea,” Ocean Development and International Law, Volume 41, 2010, pp. 237-252), Taipei has not stuck to this view.
“Subsequent maritime legislation enacted by Taiwan and subsequent public statements, however, suggests that this view may no longer be officially held,” noted the State Department in another Limits on the Seas series issue, published in 2005, devoted to Taiwan.
While the text refers to this 2005 paper, the latter’s contents do not discuss in depth ROC claims on the South China Sea, as clear from the fact that the term “South China Sea” only appears three times, whereas “dash” is not to be found.
Thus, while the assertion that in studying PRC claims one should pay attention to ROC claims seems logical, this is not followed up, either in the 2005 Limits on the Issues paper devoted to Taiwan, or in the 2014 one dealing with China.
In other words, the Department of State does not follow its own advice.
How should we read this?
On the one hand, the preeminent use of “Taiwan” may seem to amount to a limited recognition of political realities on the ground, in opposition to Beijing’s views, further contradicted by the scant regard for ROC practice as opposed to the PRC’s emphasis on administrative and international legal continuity with the Nationalist regime.
An alternative, more Beijing-friendly, interpretation of the DOS approach may be that it is treating Taipei as the de facto authority on the Island, also for law of the sea purposes, while restricting its role in the South China Sea, where the PRC has consistently sought to exclude Taiwan from regional fora, in line with its traditional policy towards the Island.
More generally, this may reflect the complex and ambiguous status of Taiwan, with neither the Island itself nor countries like the United States completely sure what it is.
To add to the confusion concerning Taiwan in the DOS paper, it states on page 21 that “Many islands and other features in the South China Sea are occupied not just by China, but by … Taiwan,” yet again this is not followed by any detailed examination of Taipei’s claims.
Going back to evidence for the possible interpretation of Beijing’s claims as historic, the report cites as “most notable” China’s “1998 EEZ and continental shelf law, which states [in Article 14] without further elaboration that ‘[t]he provisions of this Act shall not affect the historical rights of the People’s Republic of China’” (emphasis added in the DOS report).
China’s 2011 Note Verbale says that Beijing’s claims are supported by “historical and legal evidence,” but while the DOS report adds emphasis to “historical”, one should be careful not to confuse a historical claim with a claim supported by history.
A country may put forward historical evidence in both negotiations and arbitration or adjudication in areas where UNCLOS refers to “equitable” solutions.
The text also notes how many “Chinese institutions and commentators have considered that the dashed-line maps depict China’s historic title or historic rights.”
The DOS reports explains that “some” Chinese Government actions and statements which are “inconsistent with” UNCLOS, while not amounting to “express assertions of a historic claim, they may indicate that China considers that it has an alternative basis – such as historic title or historic rights – for its maritime claims in the South China Sea,” and provides some examples, such as the assertion by Foreign Ministry Spokesperson Qin Gang on 10 March 2014 that the Second Thomas Shoal (Ren’ai Reef) was under Chinese “sovereignty.”
Qin Gang said “It is known to all that China has sovereignty over the Nansha Islands and their surrounding waters, including the Ren’ai Reef.”
This mantra about sovereignty, together with repeated appeals to history, could indeed be considered as evidence that what Beijing has in mind is a historic claim.
Furthermore, it may well be a claim going beyond the provisions for such term in UNCLOS. The report provides further evidence, beyond statements, to support the view that China may be making a historical claim.
First of all, the “periodic oath-taking ceremonies at James Shoal” by Chinese naval vessels “to affirm ‘sovereignty’ over this bank” and the 2012 introduction by the China National Offshore Oil Corporation (CNNOC) of lease blocks in front of Vietnam’s central coast, in “waters under jurisdiction of the People’s Republic of China” according to the company yet with “portions of two of these blocks (BS16, DW04)” extending “without explanation to waters that are beyond 200 nm from any Chinese-claimed island.”
The DOS report stresses that the resulting “assertion of maritime jurisdiction … exceeds what is provided for under” UNCLOS.
The idea that Chinese claims are “separate from, and additional to” UNCLOS is also suggested by domestic legislation, the DOS report notes.
As an example it cites China’s 1999 Law on Marine Environmental Protection, which describes its geographical scope as extending to the country’s “internal waters, territorial sea, contiguous zone, exclusive economic zone, continental shelf of the People’s Republic of China and other sea areas under the jurisdiction of the People’s Republic of China” (emphasis in the DOS report).
According to the text, UNCLOS is restricted to maritime zones mentioned in the law, and not to any “other sea areas under the jurisdiction” of the PRC, and “perhaps” this is a reference to “areas where China considers that it has historic claims.”
Again, we must remember that this could be understood in two different ways, either China making a claim based on historic facts (recognized to a limited degree by UNCLOS) or China laying down sovereignty over certain areas of the sea based on principles and rules outside UNCLOS, or outside the prevailing interpretation of UNCLOS.
Has China made a historic claim? Next the DOS report examines two issues: whether China has actually “Made a Historic Claim”, and whether it would “have Validity.”
Concerning the former, the text states that “China has not actually made a cognizable claim to either ‘historic waters’ or ‘historic rights,’” the reasons being a lack of “international notoriety” and the statement in her 1958 Territorial Sea Declaration that “high seas” separate the Chinese mainland and coastal islands from “all other islands belonging to China”.
The text admits that the expression “historic waters” appears in some Chinese legislation and statements, and actually cites some of them, but believes that this does not amount to “notoriety” to a degree sufficient to “at the very least” allow “other states” to “have the opportunity to deny any acquiescence with the claim by protest etc.” (Taken from C.R. Symmons, Historic Waters in the Law of the Sea: A Modern Re-Appraisal, (Leiden: Martinus Nijhoff Publishers, 2008), p. 145) since “no Chinese law, declaration, proclamation, or other official statement” exists “describing and putting the international community on notice of a historic claim.”
The text dismisses references to “historic rights” in the 1998 EEZ and continental shelf law as “a savings clause” and “not a statement of a claim itself.”
An additional reason put forward by the text is that these could be references to “China’s sovereignty claim to the islands, and not the waters.”
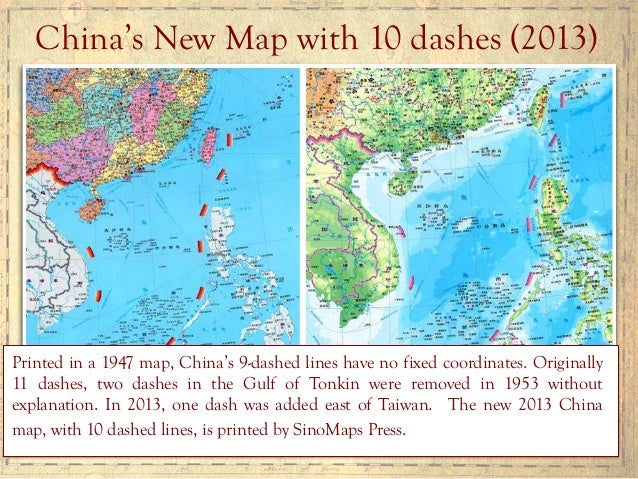
The 1947 map does not constitute either, according to the DOS report, a claim, and furthermore even if one had been made, the fact it was published domestically “in the Chinese language” would not amount to “an act of sufficient international notoriety to have properly alerted the international community.”
More generally, the text considers that no subsequent Chinese map can be treated as having made a claim either, since they all “lack the precision, clarity, and consistency that could convey the nature and scope of a maritime claim” and cites in support of this view the ICJ “statement of principle” in the Frontier Dispute case between Burkina Faso and Mali, which says that “Whether in frontier delimitations or international territorial conflicts, maps merely constitute information which varies in accuracy from case to case; of themselves, and by virtue solely of their existence, they cannot constitute a territorial title, that is, a document endowed by international law with intrinsic legal force for the purpose of establishing territorial rights.”
Whereas the assertion that China has not actually made a claim may not be shared by everybody, in particular given the language flowing from Beijing which the DOS report itself cites, the reference to the “high seas” between mainland China and some islands seems stronger proof that Beijing was not making a historic claim.
However, we must again stress that this would be the case if we followed the prevailing interpretation of the law of the sea, but there is no reason why China should adhere strictly to it, and even less that Beijing should not have changed her mind since 1958, when she had little more than a coastal navy and her economy was closed and in tatters.
It may be true, as the report notes, that the 1958 Declaration only made a historic claim to the Bohai (Pohai) gulf in northeastern China, but again this should perhaps be judged from a wider historical perspective.
After 1949 the PRC took a much more uncompromising stance concerning its North-East than its South-East (and wider maritime) borders.
With a pragmatic arrangement in place with the United Kingdom concerning Hong Kong, and a strong economic and political relation with the Soviet Union, it was at the other end of the country where, in 1950, Beijing (not without an intense internal debate given the state of the country), decided to resort to force to prevent the presence of hostile forces close to her border, intervening in the Korean War, pushing back the advancing Allied forces and reversing the impact of the Inchon landing, ultimately forcing a stalemate on the ground.
In 1958, just five years after the Korean armistice, nearby waters may have thus been much more present in Chinese leaders’ minds.
In addition, these were also the waters directly leading to Tianjin and Beijing, the venue for foreign interventions in both the Opium Wars and the Taiping Rebellion.
It would not be until the late 1970s that China’s South-Eastern flank would begin to receive more attention, in part thanks to the rapprochement with the United States and in particular once economic growth and the country’s move to become a net energy and commodity importer turned the waters of the South China Sea into a vital venue and potential choke point.
It is true that in December 1941 the loss of HMS Prince of Wales and HMS Repulse in the South China Sea had enabled the Japanese to land in Malaya and ultimately conquer Burma, closing the last land route to besieged Nationalist China, but this did not result in a comparable imprint on China’s historical consciousness, among other reasons because the episode did not involve Chinese naval forces and was subsumed into a much larger, dramatic, and quickly-developing picture.

Rejecting the validity of a possible historic claim by China.
Concerning whether, if China “Made a Historic Claim”, it would “have Validity”, the DOS paper insists that “such a claim would be contrary to international law”, stressing the limited degree to which UNCLOS recognizes this category of claims, as evidenced by its “text and drafting history”. The text argues that “apart from a narrow category of near-shore ‘historic’ bays” in Article 10, and “historic title” concerning “territorial sea boundary delimitation (Article 15)”, “modern international law of the sea does not recognize history as the basis for maritime jurisdiction”, citing the Gulf of Maine ICJ case.
It also underlines the fact that UNCLOS provisions concerning the EEZ, continental shelf, and the high seas “do not contain any exceptions for historic claims” to the detriment of coastal states and all estates enjoying certain freedoms.
Concerning fisheries, the report acknowledges that UNCLOS refers to “the need to minimize economic dislocation in States whose nationals have habitually fished” in the EEZ (Article 62(3)) and to “traditional fishing rights and other legitimate activities” (Article 51), but restricts the impact to the possible granting by one state to another of fisheries resources “based on prior usage”.
The text stresses that no such traditional fishing practices can “provide a basis for sovereignty, sovereignty rights, or jurisdiction,” adding that UNCLOS rules on oil and gas development contain no “exception for historic rights in any context.”
Again we note how a purely legal report like this may be missing part of the picture, given the great importance that fishing vessels have in the ongoing conflict over the South China Sea, where they are one of the pillars of asymmetric naval warfare.
Chinese scholars Gao and Jia have argued that UNCLOS does not regulate “historic title” and “historic rights,” which fall instead under the purview of general international law.
In their view, UNCLOS “was never intended, even at the time of its adoption, to exhaust international law.
On the contrary, it has provided ample room for customary law to develop and to fill in the gaps that the Convention itself was unable to fill in 1982” as clear from its preamble, which reads “matters not regulated by this Convention continue to be governed by the rules and principles of general international law.”
The DOS report explicitly rejects this position, saying that “it is not supported by international law” and goes against the “comprehensive scope of the LOS Convention.”
Experts like Mark Valencia, on the other hand, hold that China’s posture may be compatible with the international law of the sea.
The text does not stop at arguing that it is not open to a state to make historic claims based not on UNCLOS but on general international law, laying down a second line of defense.
It explains that, “even assuming that a Chinese historic claim in the South China Sea were governed by ‘general international law’ rather than the Convention,” it would still be invalid since it would not meet the necessary requirements under general international law, namely “open, notorious, and effective exercise of authority over the South China Sea,” plus “continuous exercise of authority” in those waters and “acquiescence by foreign States” in such exercise of authority.
Furthermore, it explains that the United States, which “is active in protesting historic claims around the world that it deems excessive,” has not protested “the dashed line on these grounds, because it does not believe that such a claim has been made by China,” with Washington choosing instead to request a clarification of the claim.
Whether this view is also meant to avoid a frontal clash with Beijing, in line with the often state policy goal of “managing” rather than “containing” China’s rise, is something not discussed in the text.
The report concludes by criticizing another view put forward by Gao and Jia, namely the relevance of claims made before the advent of UNCLOS.
While these two scholars argue that “In the case of the South China Sea as enclosed by the nine-dash line, China’s historic title and rights, which preceded the advent of UNCLOS by many years, have a continuing role to play,” the DOS paper says that “The fact that China’s claims predate the LOS Convention does not provide a basis under the Convention or international law for derogating from the LOS Convention,” adding that “permitting States to derogate from the provisions of the Convention because their claims pre-date its adoption is contrary to and would undermine” the convention’s “object and purpose” stated in its preamble to “settle … all issues relating to the law of the sea.”
Conclusions
Long-standing American policy towards China stresses the need to manage the latter’s rise, so that it does not threaten the post-Second World War system, based among others on freedom of navigation and a ban on territorial expansion as a legitimate causus belli.
As a result, Washington has often called on Beijing to clarify her claims on the South China Sea, in an attempt to constrain them while avoiding a frontal clash.
This position also seeks to reinforce the perception that the United States focuses on the rule of law at sea, rather than on supporting one claimant against the other over disputed waters.
The DOS document, in line with this approach, carefully dissects Chinese claims, analyzing whether they may be compatible with standard American interpretations of international Law of the Sea.
The conclusions are rather pessimistic, exposing how, despite having ratified UNCLOS, the Convention’s provisions are not seen in the same light by Beijing and Washington.
This should not surprise us, since international law seeks to constrain power but at the same time it is shaped by it, thus as countries rise they seek to play a greater role in the fate of rules and principles. In the case of China this is even clearer due to historical perceptions that it was to a large extent seaborne power which subjected the country to a semi-colonial status for a whole century.
If Beijing’s claims in the South Chinese Sea cannot be seen in the light of UNCLOS, the question arises what ultimate Chinese goals are.
Could this be the subject of a future paper by the Department of State?
Or does Washington prefer to wait until the international arbitration case launched by Manila concludes?
While the second option seems more likely, as time goes by the idea that China’s rise may be shaped, rather than constrained, increasingly seems less and less realistic.
However, if the time comes to draw a line in the sand, a whole of government effort will be needed, going beyond the naval circles that to date have been most vocal in articulating the need to resist Chinese expansion.
Links :
- USC Libraries : Asian ancient maps collection / Sea Korea ancient maps collection
- CIMSEC : South China Sea Arbitration : Beijing puts forward her own views (part I / II / III)
- Statfor : A Glimpse into China's military presence in the South China Sea
- Washington Post : Satellite images show China may be building powerful radar on disputed islands
Subscribe to:
Posts (Atom)