The seabed drill rig (MeBo) was developed at the MARUM in order to be able to obtain cores of up to 50 m in length from loose sediments and solid rock.
The 10-ton-weight machine is placed on the seabed and works in water depths of up to 2000 m. The film shots show - uncommented - tests of different components of the system in the MARUM technology hall, preparations for the suspension of MeBo on board FS METEOR, the drilling of sediment cores on the seabed and - after the return on board - the removal of the drill cores.
A tangle of tubes, cables, and actuators - Mebo looks as though it could
morph at any moment into one of those Transformer robots from the
movies.
The 10-tonne machine is in fact a seabed drilling system, and a very sophisticated one at that.
Deployed
over the side of any large ship but driven remotely from onboard, it's
opening up new opportunities to take sediment samples from the ocean
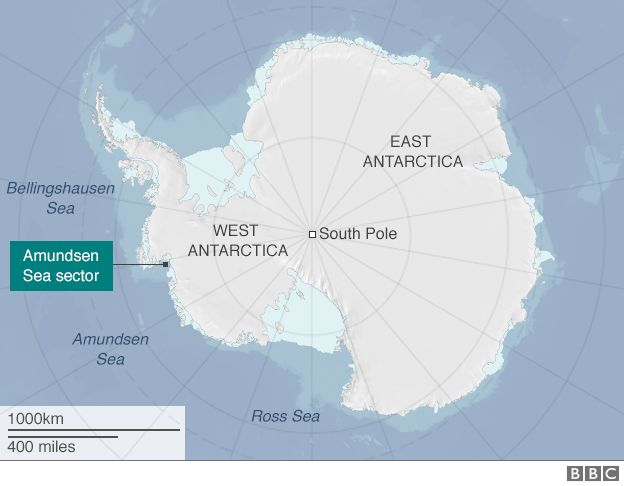
floor. MeBo was developed at the MARUM research facility in Bremen, Germany, and has not long returned from a pathfinding expedition to the West Antarctic.
In
the iceberg-infested waters of the Amundsen Sea Embayment (ASE), it
obtained the very first cores to be drilled from just in front of some
of the mightiest glaciers on Earth.
Chief among these are Pine
Island Glacier and Thwaites Glacier, colossal streams of ice that drain
the White Continent and which are now spilling mass into the ocean at an alarming rate.
There's concern that deep, warm water is undercutting the glaciers, possibly tipping them into an unstoppable retreat.
And that has global implications for significant sea-level rise.
It was MeBo's job to help investigate whether this really could be happening.
"Meeresboden-Bohrgerät" is German for "seafloor drill rig"
It's lowered to the seabed with a specially designed cable
This also delivers power, and carries commands and video
An operator drives MeBo remotely from the deployment ship
System has a magazine of pipes to lengthen the drill string
Mebo can penetrate mud and rock to a depth of up to 80m
The goal was to retrieve seafloor sediments that would reveal the
behaviour of the West Antarctic Ice Sheet (WAIS) in previous warm
phases.
To read the future in the past.
"Has the West Antarctic Ice Sheet collapsed before? Is that the
scenario we should expect in the next couple of hundred years?" pondered
project leader Karsten Gohl from the Alfred Wegener Institute (AWI).
"Perhaps
in some of these warm periods it has only partially collapsed, just a
few portions of it. Or maybe the WAIS was hardly affected in those
times. We hope we can understand this better by collecting samples
because basically the sediments are a climate archive."
As
glaciers grind their way off the continent they crush and bulldoze rock
and drop it offshore.
This material - the range of particles and their
shapes, the way they are sorted, etc - codes the activity of the
glaciers in the region.
Layers deposited during periods when the
WAIS was extensive will contrast with those from times when glaciers
were absent or significantly withdrawn.
"If you find ice-rafted debris (stones dropped by icebergs), for
example, you can be sure there was ice on land and that the ice had
advanced to the coast," explained Claus-Dieter Hillenbrand from the British Antarctic Survey (BAS).
"But
also new developments - especially what's known as geochemical
provenance - have emerged in the last 10 years that mean it's even
possible now to compare this material with rocks on land to pin down the
actual sources in the hinterland."
Helpfully, nature also
date-stamps the sediments by incorporating the remains of single-celled
organisms (foraminifera and diatoms) from the ocean.
The distinct
species that lived through different epochs act as a fossil
chronometer.
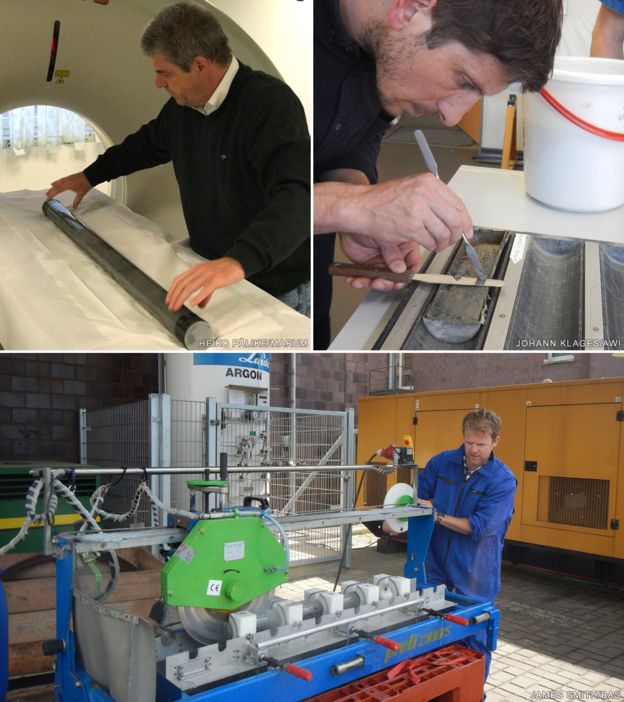
Back in Bremen: The cores have undergone CT scanning and have now been split open
MeBo's drill cores are now back in Bremen.
A week ago, the
cylindrical liners containing some 60m of ocean-floor material were
being X-rayed at a local hospital to precisely determine their internal
structure.
And in the past few days, the task began of splitting the
cores to allow their contents to be fully analysed.
The
scientists who travelled to the Amundsen Sea with MeBo, on Germany's
Polarstern research ship, already have some clues to what the cores will
contain.
They got a sneak preview in the rock and mud that was visible
at the ends of the drill pipe segments when they were brought back up
from below.
From the 11 locations MeBo sampled, it's very likely
there are sediments that record the very deep past - from the Late
Cretaceous, some 70 million years ago when dinosaurs still roamed the
Earth and the landmass that is now Antarctica was green.
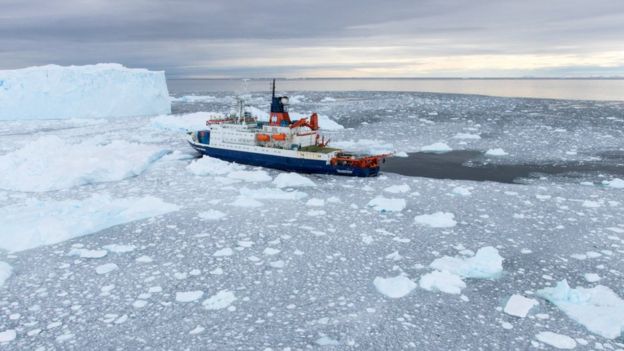
Ice challenge: The drill system can only be lowered when big bergs are absent
courtesy of T. Ronge, AWI
Coming forward in time, it's probable also there are records from the
Oligocene (34-23 million years ago) and the Miocene (23-5 million years
ago) which should document some key events in Antarctica's history when
a burgeoning ice sheet in the East of the continent was supplemented by
one in the West.
"We haven't got a continuous sequence; we have
spot samples from these different times," explained Dr Gohl.
"But with
these sediments we hope we can establish the onset of glaciation in
Antarctica, and then get records from the time in the Miocene where in
other areas of the Antarctic it's known there was the main glacial
advance that has persisted to today."
With luck there are
additional sediments distributed in the last few hundred thousand years,
when WAIS glaciers would have advanced and retreated through the recent
cycle of "ice ages".
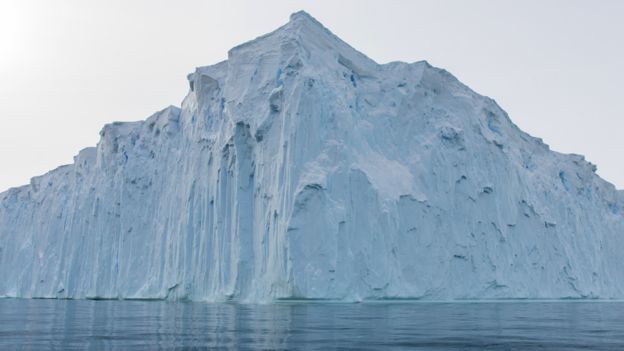
courtesy of T. Ronge, AWI
What many scientists would dearly love to see is a rich record from
the Pliocene, from a time three million years ago when carbon dioxide
levels in Earth's atmosphere were very similar to what they are today
(400 molecules of CO2 in every million molecules of dry air).
WAIS
behaviour at this time could represent the best analogue for what is
about to happen to the ice sheet in the near future.
But this
desire may have to wait to be satisfied by a second expedition with a
dedicated drill ship, the Joides Resolution.
The JR can bore hundreds of
metres into the seabed, increasing the chances of capturing an
unabridged view of the past. A firm booking has been made for 2019.
For
now, researchers must work with the initial snapshot provided by MeBo.
BAS team-member Bob Larter: "This is the first time we've had any real
constraint on the West Antarctic Ice Sheet, because although there's
been a number of drilling exercises in the Ross Sea, it's hard from that
location to know for sure whether the glacial signal is coming from the
East or the West. Whereas if you drill in the Amundsen Sea, you know it's a record of the WAIS."
The
results of the various lab analyses now under way are eagerly awaited
and will be reported in a slew of scientific papers.
For MeBo, the
expedition has demonstrated once again what an agile system it is.
"This type of drilling will become more common, not just in science but also in industry," predicted Marum's Tim Freudenthal.
"There
are several applications in the oil and mining industries, and offshore
wind farms - they need geotechnical investigation of the seabed. For
all these types of investigation, the big drilling vessels can often be
too powerful. The seabed drilling systems like MeBo offer a very good
alternative."
An update on the Amundsen Sea Embayment expedition was presented to the recent General Assembly of the European Geosciences Union (EGU).
Satellites will function like a mesh network and deliver gigabit speeds.
In May this year, SpaceX said its planned constellation of 4,425 broadband
satellites will launch from the Falcon 9 rocket beginning in 2019 and
continue launching in phases until reaching full capacity in 2024.
SpaceX gave the Senate Commerce Committee an update on its satellite plans during a broadband infrastructure hearing this morning via testimony by
VP of satellite government affairs Patricia Cooper.
Satellite Internet
access traditionally suffers from high latency, relatively slow speeds,
and strict data caps.
But as we reported in November, SpaceX says it intends to solve these problems with custom-designed satellites launched into low-Earth orbits.
SpaceX mentioned 2019 as a possible launch date in an application
filed with the Federal Communications Commission in November and offered
a more specific launch timeline today.
Cooper told senators:
"Later this year, SpaceX will begin the process of testing the satellites themselves, launching one prototype before the end of the year and another during the early months of 2018. Following successful demonstration of the technology, SpaceX intends to begin the operational satellite launch campaign in 2019. The remaining satellites in the constellation will be launched in phases through 2024, when the system will reach full capacity with the Ka- and Ku-Band satellites. SpaceX intends to launch the system onboard our Falcon 9 rocket, leveraging significant launch cost savings afforded by the first stage reusability now demonstrated with the vehicle."
Washington-based company Vulcan Aerospace announced that its Stratolaunch Systems, an air-launch platform for rockets, is close to completion.
The 4,425 satellites will "operat[e] in 83 orbital planes (at
altitudes ranging from 1,110km to 1,325km)," and "require associated
ground control facilities, gateway Earth stations, and end-user Earth
stations," Cooper said.
By contrast, the existing HughesNet satellite
network has an altitude of about 35,400km, making for a much longer round-trip time than ground-based networks.
SpaceX has also proposed an additional 7,500 satellites operating
even closer to the ground, saying that this will boost capacity and
reduce latency in heavily populated areas.
But Cooper offered no
specific timeline for this part of the project.
There were an estimated 1,459 operating satellites orbiting
Earth at the end of 2016, and the 4,425 satellites in SpaceX's planned
initial launch would be three times that many.
Other companies are also
considering large satellite launches, raising concerns about potential
collisions and a worsening "space junk problem," an MIT Technology Reviewarticle noted last month.
SpaceX today urged the government to relax regulations related to
satellite launches and to include satellite technology in any future
broadband infrastructure legislation and funding.
Network design
SpaceX's satellites will essentially operate as a mesh network and
"allocate broadband resources in real time, placing capacity where it is
most needed and directing energy away from areas where it might cause
interference to other systems, either in space or on the ground," Cooper
said.
Satellites will beam directly to gateway stations and terminals
at customers' homes, a strategy that will greatly reduce the amount of
infrastructure needed on the ground, particularly in rural and remote
areas, she said.
"In other words, the common challenges associated with siting,
digging trenches, laying fiber, and dealing with property rights are
materially alleviated through a space-based broadband network," she
said.
Customer terminals will be the size of a laptop.
While speeds should
hit a gigabit per second, SpaceX said it "intends to market different
packages of data at different price points, accommodating a variety of
consumer demands."
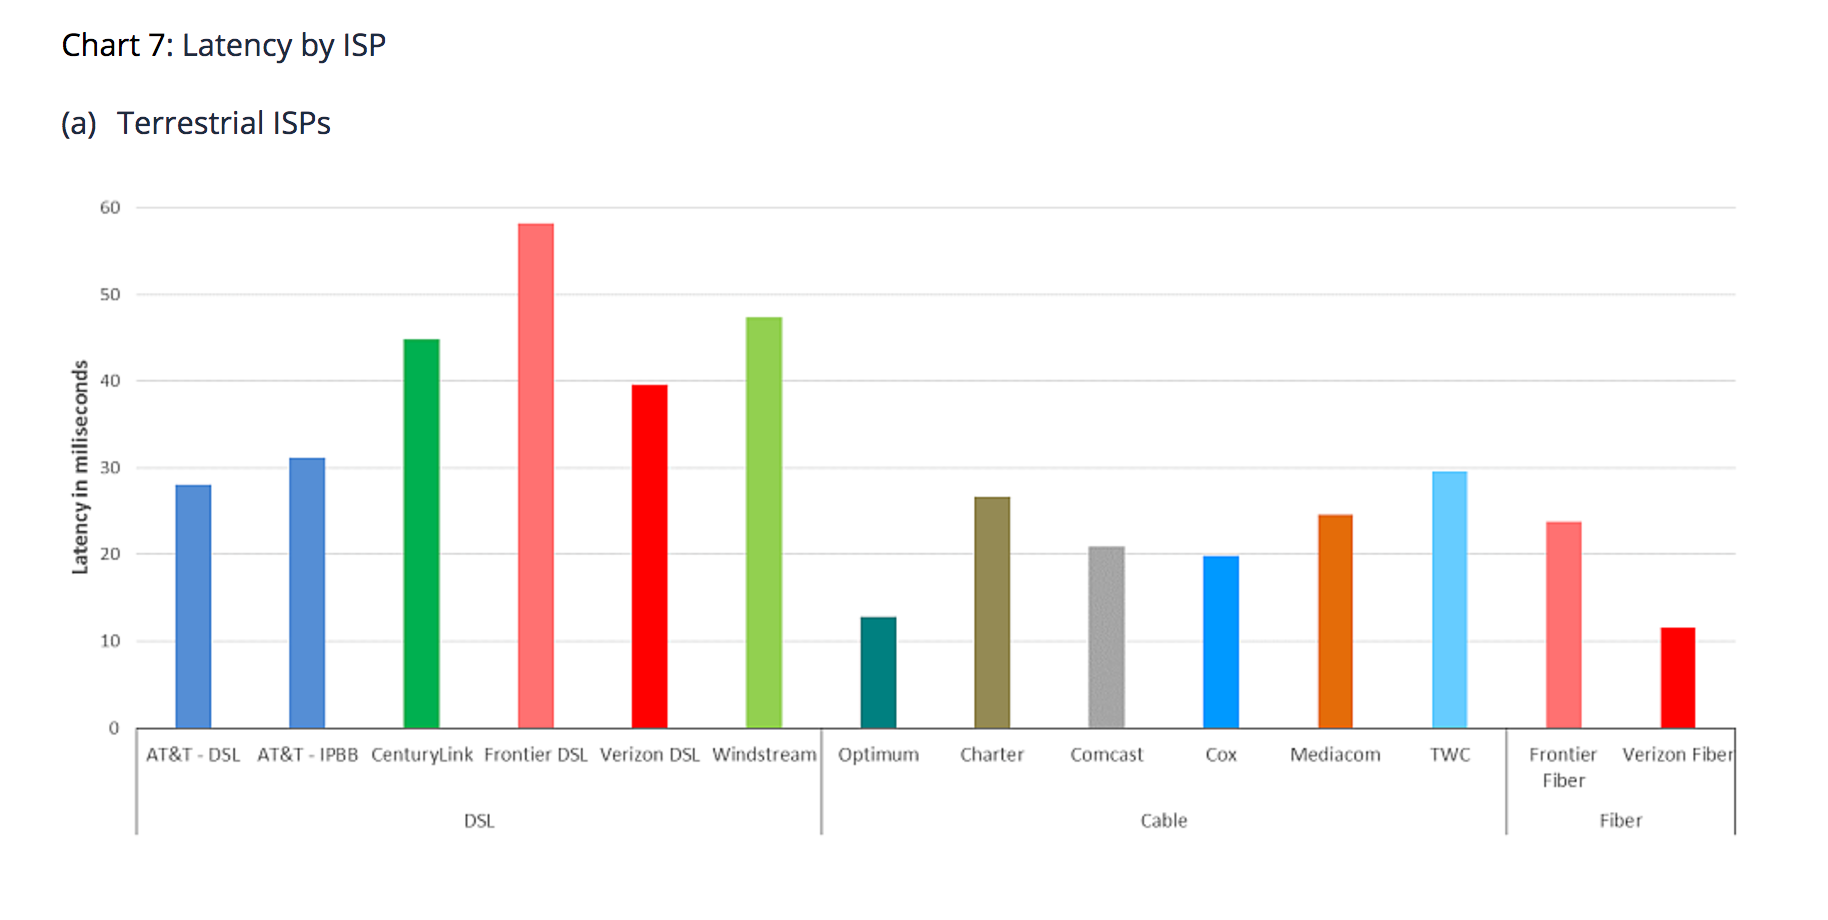
Current satellite ISPs have latencies of 600ms or
more, according to FCC measurements,
but SpaceX has said its own system will have latencies between 25 and
35ms.
That's better than DSL and similar to several of today's major
cable and fiber systems, according to FCC measurements.
The measurements show that the Altice-owned Optimum and Verizon FiOS
had latencies of just over 10ms, better than what SpaceX is expecting to
achieve.
SpaceX promised that its satellite technology won't become stale after
launch.
The company's "satellite manufacturing cost profile and in-house
launch capability" will allow it to continually update the system's
technology to meet changing customer needs, Cooper said.
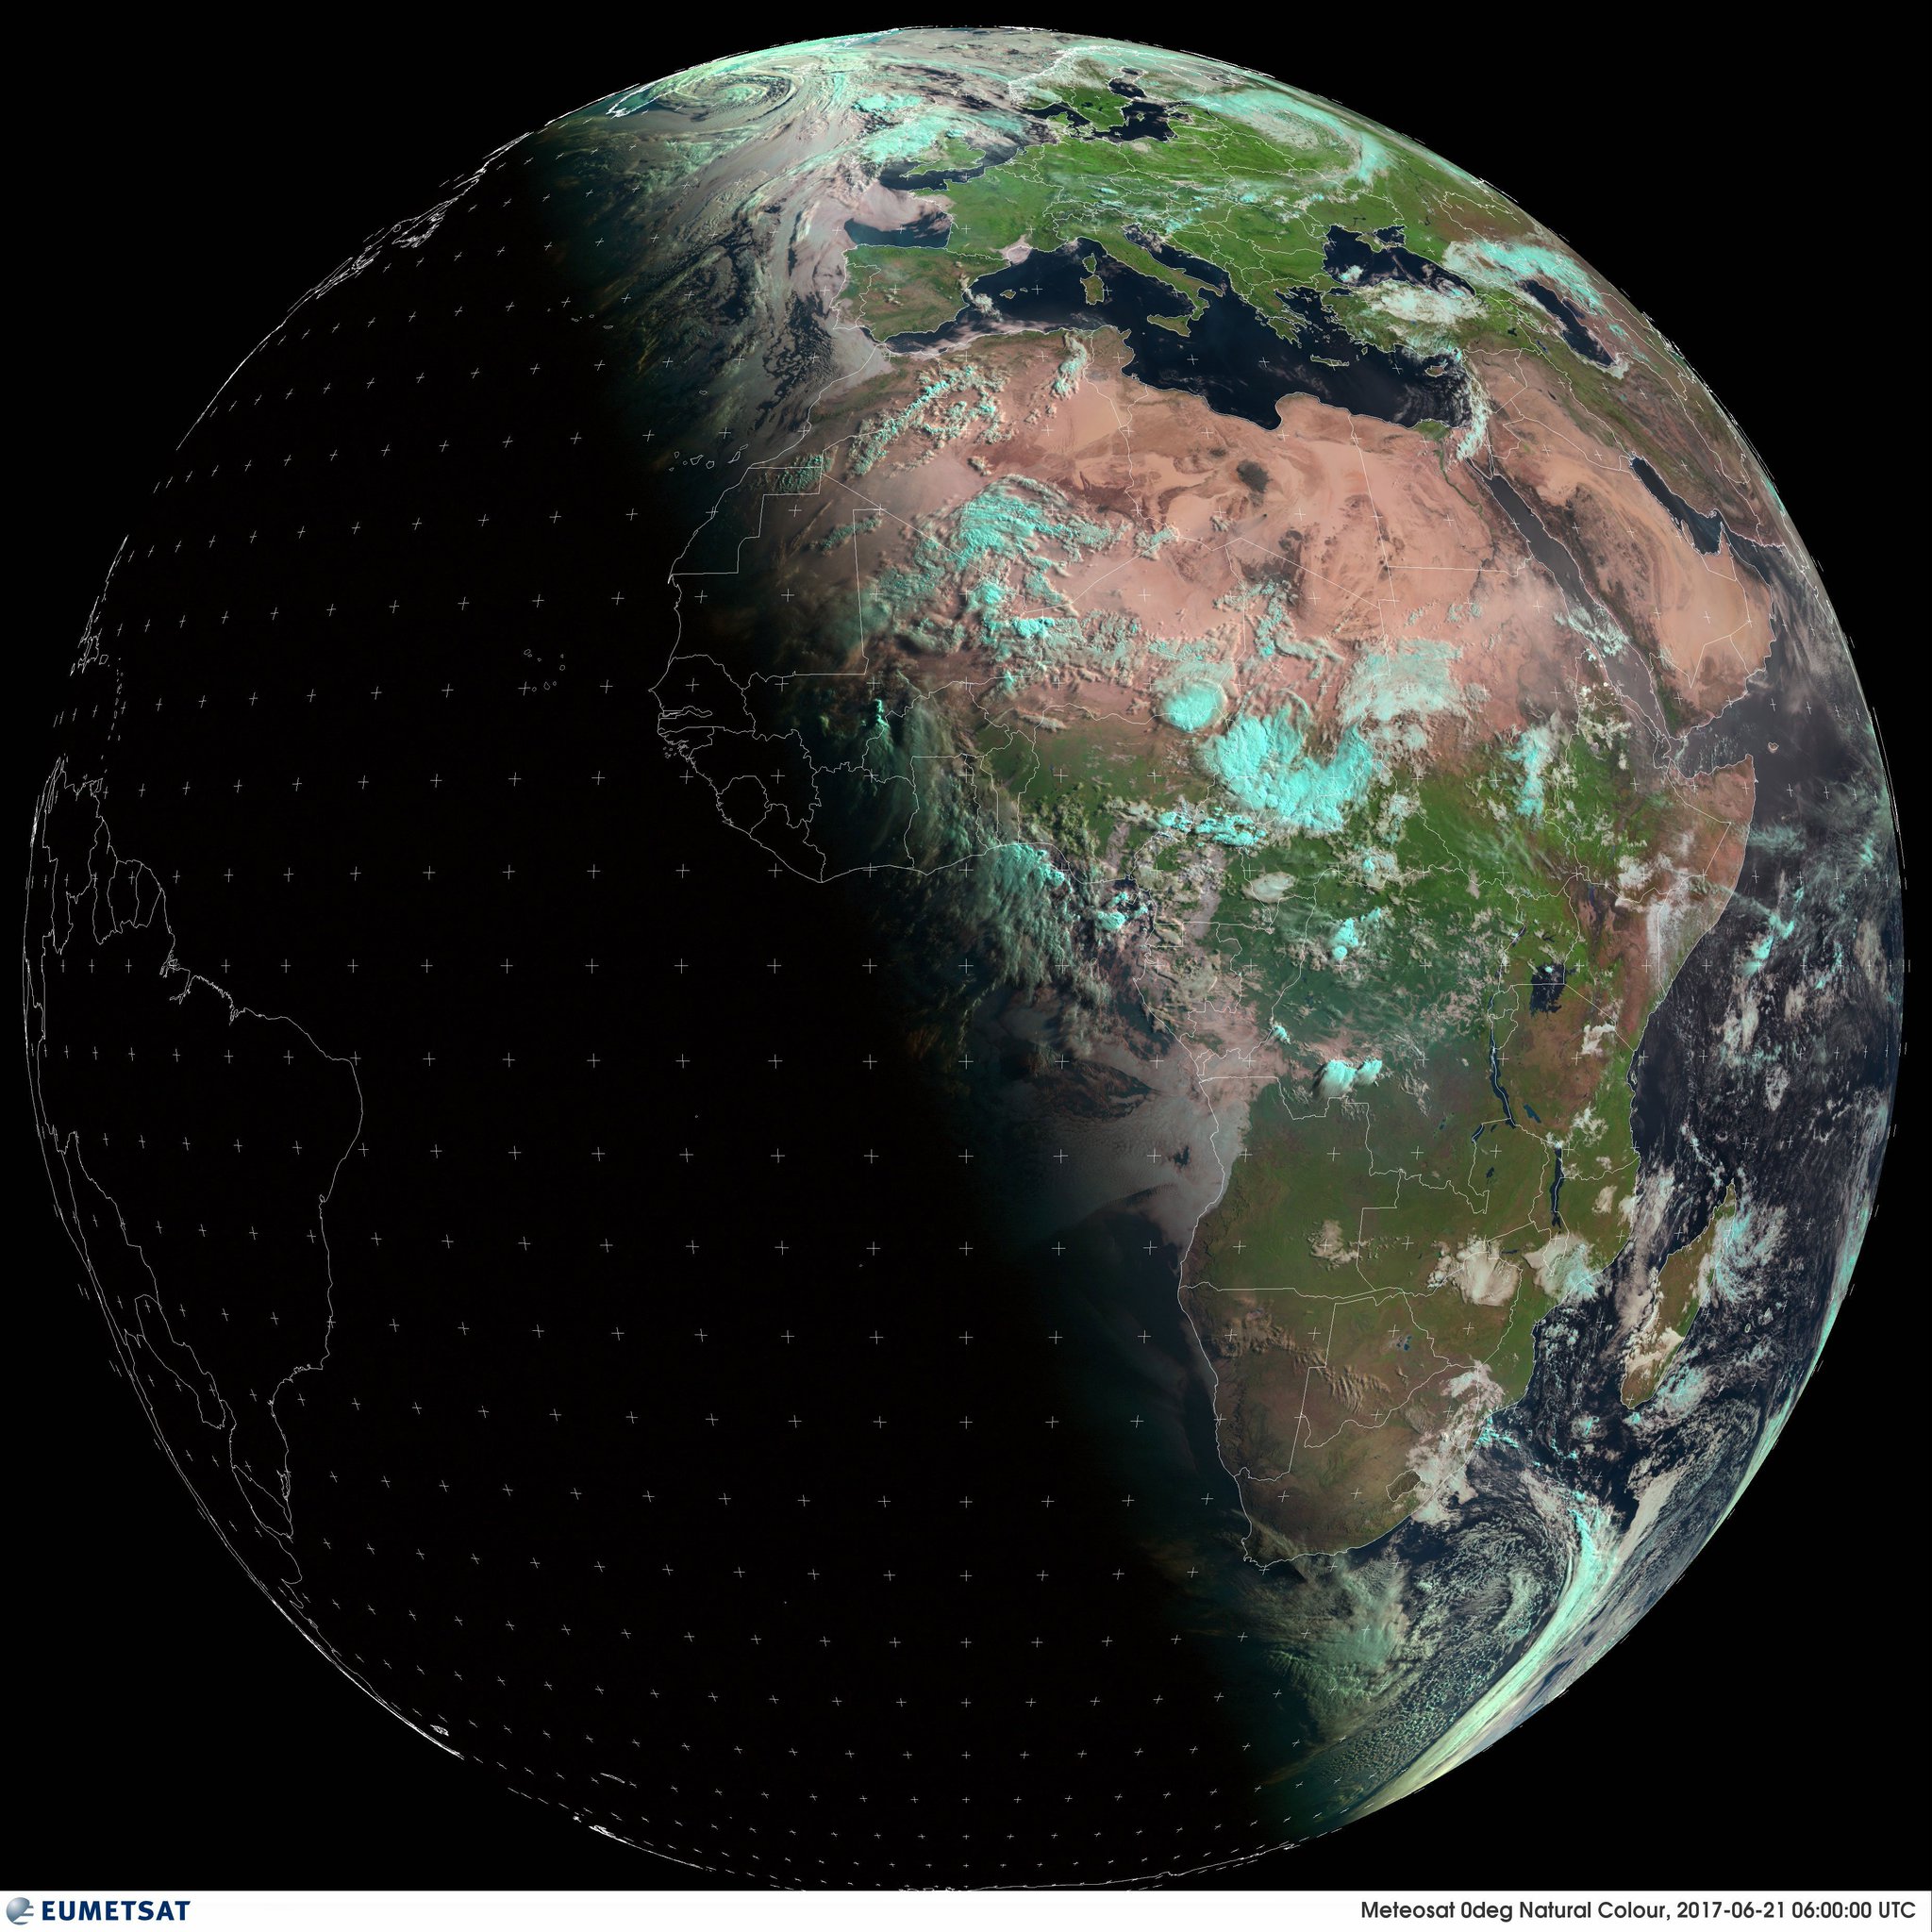
The summer solstice (or estival solstice), also known as midsummer, occurs when a planet's rotational axis, or geographic pole on either its northern or its southern hemisphere, is most inclined toward the star that it orbits.
On the summer solstice, Earth's maximum axial tilt toward the Sun is 23.44°.
(Likewise, the Sun's declination from the celestial equator is +23.44° in the Northern Sky and −23.44° in the Southern Sky.)
This happens twice each year (once in each hemisphere), when the Sun reaches its highest position in the sky as seen from the north or south pole.
The summer solstice occurs during the hemisphere's summer.
This is the northern solstice in the Northern Hemisphere and the southern solstice in the Southern Hemisphere.
Depending on the shift of the calendar, the summer solstice occurs some time between June 20 and June 22 in the Northern Hemisphere and between December 20 and December 23 each year in the Southern Hemisphere.
The same dates in the opposite hemisphere are referred to as the winter solstice.
As seen from a geographic pole, the Sun reaches its highest altitude of the year on the summer solstice.
It can be solar noon only along that longitude, which at that moment lies in the direction of the Sun from the pole.
For other longitudes, it is not noon.
Noon has either passed or has yet to come.
Hence the notion of a solstice day is useful.
The term is colloquially used like "midsummer" to refer to the day on which solstice occurs.
The summer solstice day has the longest period of daylight, except in the polar regions, where daytime remains continuous for 24 hours every day during a period ranging from a few days to six months around the summer solstice.
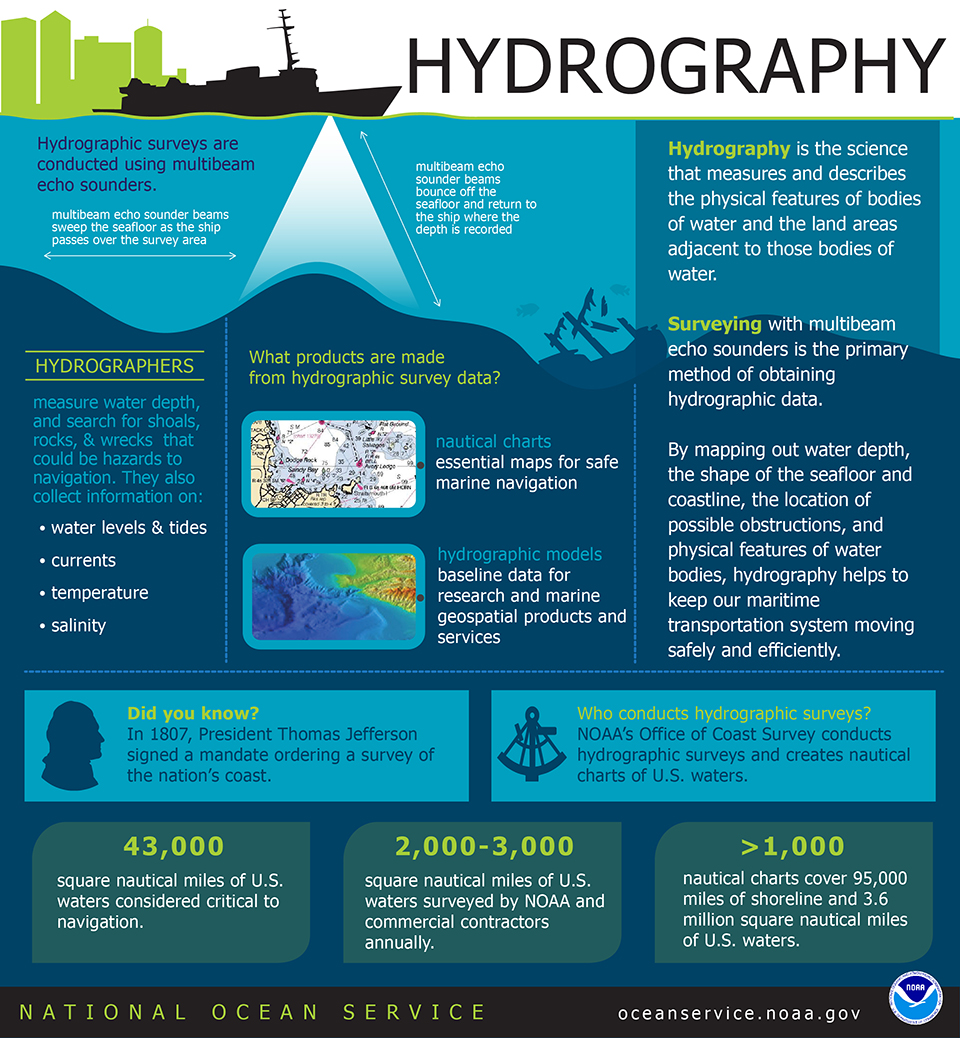
Wednesday 21st of June is World Hydrography Day as declared by the United Nations.
Hydrography is the science that measures and describes the physical features of bodies of water.
By mapping out water depth, the shape of the seafloor and coastline, the location of possible obstructions, and physical features of water bodies, hydrography helps keep our maritime transportation system moving safely and efficiently. source : NOAA / NGA
Take that, Europe. Computer modeler aims to give U.S. lead in weather predictions : Shian-Jiann “S. J.” Lin’s program will power short-term weather forecasts and long-term climate simulations.
From below the conference table comes the thrum of incoming phone
alerts.
The new weather forecast has rolled in, and the climate
scientists, even though it’s not typically their business, dig out their
phones to look: snow tomorrow—hardly unusual for early February in
Princeton, New Jersey.
But the weather models have the storm breaking
severe, dumping a foot or more.
A snow day seems likely.
Across the table at the Geophysical Fluid Dynamics Laboratory (GFDL),
Shian-Jiann “S. J.” Lin is not convinced.
He is the master of 20,000
lines of computer code that divide the atmosphere into boxes and, with
canny accuracy, solve the equations that describe how air swirls around
the globe.
For decades, Lin’s program has powered the long-term
simulations of many climate models, including GFDL’s—one of the crown
jewels of the U.S. National Oceanic and Atmospheric Administration
(NOAA).
Now, Lin’s domain is expanding to a different side of NOAA: the
short-term weather forecasts of the National Weather Service (NWS).
By
2018, Lin’s program will be powering a unified system for both climate
and weather forecasting, one that could predict conditions tomorrow, or a
century from now—and do it faster and better than current models.
His
work will soon be guiding mayors planning not just for snow plows, but
also rising seas.
But Lin has started early.
His small team is already running a
prototype forecast on their supercomputer.
And in his typically
confident and brash style, he offers a minority report about the next
day’s storm.
“If our forecast is correct, it’s only 3 to 6 inches,” Lin announces.
His peers at the table seem skeptical.
“It’s going to be a mess,” one
warns.
But Lin doesn’t budge.
He rarely needs to.
“We’ll see what we get
tomorrow,” he says.
“You want to bet?”
Much is riding on Lin.
NOAA'S new weather satellite expected to lead to more accurate forecasts. The first set of images from the GOES-16 satellite have been released by National Oceanic and Atmospheric Administration (N0AA). The geostationary satellite will be used for weather forecasting, severe storm tracking and more.
Recently, NWS has suffered some prominent
embarrassments, such as in 2012, when it predicted Hurricane Sandy would
sputter out over the ocean while a leading European center accurately
forecast the direct hit on New York City.
Fed up with the country’s
second-place status, Congress in 2013 poured $48 million into NWS
weather modeling.
The message for NOAA was clear: Get America on top.
This drive has opened up an opportunity.
For a long time,
meteorologists and climate scientists operated in separate domains.
Meteorologists focused on speed: ingesting as many data as possible from
satellites, balloons, and buoys and quickly spinning it into a
forecast.
Climate scientists focused on the fussy physics of their
models to produce plausible simulations over decades.
But now, the two
groups are discovering common ground, in “subseasonal to seasonal”
predictions—from a month to 2 years out.
In order to push forecasts
beyond 10 days or so, meteorologists need the superior physics of the
climate models.
Meanwhile, climate scientists want to know how weather
phenomena that happen on monthly or annual timescales, like El Niño,
influence the global climate.
“The two cultures are speaking each
other’s language, and realizing they’re going to live and die together,”
says John Michalakes, a computer scientist who develops atmospheric
models at the Naval Research Laboratory in Monterey, California.
There could be another benefit to blurring the lines between weather
and climate, one that climate scientists are loath to talk about
explicitly.
Although studies of human-driven climate change have faced
scrutiny and scorn from conservative politicians in the United States,
weather research remains solidly bipartisan, says David Titley, director
of the Center for Solutions to Weather and Climate Risk at Pennsylvania
State University in State College.
Just this month, for example,
Congress passed a weather forecasting bill that dedicates $26.5 million
of NOAA’s budget to improving its seasonal predictions, and climate
change doubters were among the supporters.
“If I were running the world,
I would keep that divide vague,” Titley says.
In his modeling, Lin never made the distinction.
“From the beginning
we talked about how there is no difference between weather and climate,”
says Ricky Rood, an atmospheric scientist at the University of Michigan
in Ann Arbor and Lin’s longtime collaborator.
But others haven’t wanted
to hear that message—and especially not from Lin, who is as feisty and
fractious as a government employee can get.
“It’s amazing to me,” says
Rood, “that S. J. could evolve to be a source of unification.”
Storms have roiled around Lin his whole life.
Typhoons are regular
events in Taipei, where he grew up, and he was always fascinated by
their power.
“I have hurricanes in my blood,” he says.
Born in 1958 to
parents who ran a small construction company, he was the first in his
family to go to college.
As a student at National Taiwan University, he
studied microprocessor architectures, along with meteorology and fluid
dynamics.
He became fascinated with the challenge of rendering the
continuous currents of the atmosphere in the discontinuous, 0-or-1 world
of computer code.
At the time, Taiwan was a dictatorship, and Lin joined student groups
opposed to the regime.
After college, he faced several years of
mandatory military service.
He aced his entry test and assumed he would
land a cushy engineering job in Taipei.
Instead, he was shipped to the
Matsu Islands, 16 kilometers from the Chinese mainland.
He was hardly a
model soldier.
He hated having to recite party doctrine during
assemblies.
“You had to pretend, and say something not in your heart,”
he says.
Taiwan didn’t seem to have a place for him, so in 1983 he enrolled in
the aerospace engineering department at the University of Oklahoma, one
of the only schools he could afford.
He wanted to be a rocket
scientist.
But it was a tough transition.
He cared more about learning
computer languages than English, and felt isolated.
His accent is a
barrier, but not the only one.
“Some folks tend to have a difficult time
following S. J.,” says Bill Putman, a meteorologist at NASA’s Goddard
Space Flight Center in Greenbelt, Maryland, and another longtime
collaborator.
“But it’s not necessarily a language barrier.
It’s more a
knowledge barrier.”
Seeing his talent for computational fluid dynamics,
his adviser suggested Lin switch to Princeton University, which with its
partnership with GFDL is a hotbed for atmospheric modeling.
He learned how GFDL scientists divided the air into a 3D grid that
spanned the globe and stretched from the surface to the stratosphere,
following lines of latitude and longitude.
Along points on the grid,
they would set initial conditions—the weather or climate for a given
moment in time.
Then, point by point, the computer would solve equations
describing changes in wind, air pressure, temperature, and humidity for
successive steps in time.
Computers were room-sized mainframes at the
time, and the model grids were huge, with a mesh size of 500 kilometers.
The models could recreate only the largest atmospheric features, like
jet streams and the Hadley cell, the belt that circulates warm air from
the equator to the subtropics.
After graduate school, Lin decided to stay in the United States.
“I’m
now more American than I am Taiwanese,” he says.
He drinks whisky, but
infuses it with ginseng.
He returned to the University of Oklahoma as a
postdoc to work on modeling tornadoes.
But computers couldn’t yet model
events that unfold at such small scales.
The failure was humbling, and
Lin says it provided a mantra: “Choose the right level of complexity for
the particular problem, at the time that you have the resources to do
it.”
Lin soon found the right problem at NASA.
In the late 1980s, Rood was working on the problem of the Antarctic
ozone hole at Goddard.
NASA was flying research planes into the hole to
measure the chemicals that might be destroying it.
These flights
revealed a drop in several short-lived reactive nitrogen oxides, which
allowed chlorine from human-made chemicals to linger, priming further
reactions that broke down the ozone.
But Rood’s atmospheric models
couldn’t simulate the flows and reactions.
No matter what he did, the
nitrogen reactants remained steady.
How could that happen?
At the time, an elegant mathematical solution
had overtaken global modeling, called the spectral method.
Rather than
solving at points on a latitude-longitude grid, scientists realized that
fluid flow in the atmosphere could be represented as the sum of a
series of hundreds of sinusoidal, crisscrossing waves.
The code ran
faster, and the results could be transformed back onto a regular grid.
The spectral method still powers most global weather forecasts today,
including at NWS.
But the speed comes with a cost: When the waves are
projected back into physical space, mass can gradually grow unbalanced.
For weather models, which only run for days into the future, this is not
a big deal.
But for models of atmospheric chemistry and climate, which
run for much longer periods, these distortions were a critical flaw.
Fortunately for Rood, a young Taiwanese scientist had written to him,
lured by his publications.
When Lin joined NASA in 1992 as a
contractor, the two set out to build a model that, above all else,
preserved mass.
This first meant jettisoning the spectral method.
It
also meant upgrading from finite-difference modeling, which solves for
points on a grid, to a finite-volume model, which solves for conditions
averaged across each cell, or box, and is ideally suited for conserving
mass because the calculations pass fluxes, or volumes, of material from
one box to the next.
Others had considered such a solution, but thought
it too complex or computationally expensive.
But Lin was a master of computational efficiency.
Over a furious few
years in the mid-1990s, he and Rood expanded their model beyond chemical
transport—for which it remains the standard—to a fullfledged dynamical
core fast enough to be used for climate models.
Put a mote of dust in
the air, says Paul Ginoux, an aerosol modeler at GFDL, who also worked
with Lin at Goddard, “and this code will transport it at the right
place, at the right moment.
And that’s beautiful.” The name of the code
was far more mundane.
They called it “FV,” for finite-volume, and later
FV3.
Their work soon drew the attention of the National Center for
Atmospheric Research (NCAR) in Boulder, Colorado, one of the country’s
leading institutes for weather and climate science, which incorporated
FV into its influential climate model.
NASA’s climate laboratory in New
York City adopted it as well.
And in 2003, GFDL lured Lin away to
upgrade FV and fold it into its global simulation.
The results of these
models, some of the top U.S. contributions to the United Nations panel
on climate change, have informed much of what the public hears about
global warming.
And they’ve all had Lin’s innovations at their heart.
There's a term of art at NOAA for the reactive way Congress finances
weather research: “budgeting by disaster.” It’s rarely pretty, and it’s
why the coming merger in atmospheric modeling will, at its root, be
thanks to the calamities of Hurricane Katrina and Hurricane Sandy.
In 2005, after NWS failed to forecast Katrina’s direct hit on New
Orleans, Louisiana, until 2 days out, Congress set aside money to
improve predictions of Atlantic hurricanes.
As it happened, it was
around this time that Lin walked into the office of his boss at GFDL,
Isaac Held, and declared: “I’m going to revolutionize weather
prediction.” Computers were now capable of processing boxes small enough
to render hurricanes.
More important, Lin had developed a key bit of
physics needed for FV3 to forecast realistic hurricanes.
Many global
forecasting models operate using an assumption called the hydrostatic
principle—where the gravity of the air in any box is exactly balanced by
the upward force of the air pressure in the box below it.
This works
for coarse models, which cannot directly simulate the fine upward and
downward flows in the real atmosphere.
But recreating weather events
like hurricanes and thunderstorms, where updrafts are important,
requires breaking this hydrostatic principle.
After a decade of mulling,
Lin finally had an efficient way of incorporating nonhydrostatic flows
into his code.
He needed to test it.
Zooming in on storms
The FV3 model divides the atmosphere
into boxes and simulates conditions in each one.
To avoid problems at the poles, its coordinates are based on a cubed sphere.
The program can also nest grids to simulate weather at different scales.
Frank Marks, who leads hurricane research at
NOAA’s Atlantic Oceanographic and Meteorological Laboratory in Miami,
Florida, was overseeing improvements for the regional hurricane model
for the Atlantic basin.
With a smaller area to model, Marks can afford
to have fine-scale boxes.
Lin convinced him to use Katrina dollars to
buy extra supercomputer time.
Run FV3 at a 1-kilometer resolution, Lin
promised, and the finest details of cyclones would arise.
Sure enough,
the violent walls of a hurricane’s eye opened in his code.
In 2014, when NOAA announced a competition to choose the “core” of
the agency’s next-generation weather forecast system, Lin was ready.
Five models were entered, including FV3.
And by the summer of 2015,
FV3 was one of two frontrunners, along with the Model for Prediction
Across Scales (MPAS), the globalized version of a long-standing system
produced by NCAR and used by many researchers.
They would be judged on
their speed and accuracy in mimicking the atmosphere’s flows.
For 6 months, Lin’s placid office turned frenetic, as his team worked
nights and weekends to embed FV3 within the weather service’s system.
“There was never a time where I thought we were losing the battle on
scientific ground,” Lin says.
One advantage of his model was efficiency.
It is Lin’s obsession—and not just at work: When Hurricane Sandy
knocked out power at Lin’s modest home, he refused to use a normal
generator, and instead rigged his Prius up to his home wiring.
Its
battery, he explained, would make certain any extra electricity the
car’s generator churned out wouldn’t go to waste.
So that FV3 could make efficient use of limited computing power, Lin
and his team had written the code to work in parallel.
This is hard for
global models, where the weather in one box can influence another box a
hemisphere away.
But this interconnectedness isn’t as big a problem in
the vertical dimension, so Lin enabled FV3’s layers to be detached from
each other and be processed in parallel.
He won additional efficiencies
by changing the shape of the grid.
Climate models are plagued by the
so-called pole problem, the result of the strangely squished and
stretched boxes near the poles.
So Lin and Putman, his former NASA
colleague, abandoned the latitude/longitude system in favor of a cubed
sphere.
Picture a six-sided die inflated like a balloon.
There were no
more poles to handle, just six square panels, with tricky interactions
at the seams.
The net result: compared with MPAS, FV3 took a third as many computer
processors to run at operational standards.
It also outperformed MPAS
when run on a vast number of processors, and it could zoom in to model
one part of the globe at high resolution without skewing its performance
in coarser regions.
It was a slaughter.
NCAR withdrew its model before
NOAA anointed FV3 as the winner, in July 2016.
“There was just never any
conclusive evidence that MPAS had an advantage that was worth the
cost,” says Michalakes, who led the computing comparisons.
During the competition, Lin had complained that NOAA was biased in
favor of MPAS; now, he crows about his victory.
“Most people in that
discipline paid no respect to what we had been doing,” he says.
“They
found out the hard way.” With NCAR toppled, Lin now faces far bigger
rivals: the United Kingdom’s Met Office, which since the early 1990s has
been the only center to have merged its weather and climate forecasts,
and the European Centre for Medium-Range Forecasts, which has long run
the top-rated weather model.
This time around, he’ll need help.
European modelers start with the same set of balloon, satellite, and
ground measurements as everyone else.
But they cleverly inject
randomness into these initial conditions, then do multiple runs to come
up with a “consensus” forecast.
Getting the United States up to those
standards will require winning over U.S.
researchers to provide
innovative techniques that Lin and his colleagues can adapt for their
model.
Yet there’s a risk that academic weather scientists will avoid using
FV3 and instead stick with MPAS, more comfortable with its origins and
documentation, says Cliff Mass, an atmospheric scientist at the
University of Washington in Seattle.
Lin’s reluctance to break down his
code in the past has heightened concerns.
“Lin is a brilliant modeler,”
Mass says.
“He’s not big on community support.” But Putman believes Lin
will embrace true improvements.
“If he sees something that will push
this code beyond where it is now, I’m sure he’s willing to adapt.”
At a workshop next week, NWS will lay out its aggressive timetable
for turning on FV3.
By this May, FV3 ought to be fully wired into the
service’s data assimilation.
And by the first half of 2018, if all goes
well, NOAA will flip the switch, making it the standard forecast that
feeds into all of our phones.
Meanwhile, Lin’s team continues to tinker with FV3.
They’re honing a
more powerful zooming technique: allowing the grid to create nests of
high-resolution boxes, 2 to 3 kilometers a side, over regions of
interest.
This could allow high-resolution hurricane forecasts to be run
at the same time as global predictions, with no need to wait for the
global run to finish.
And it could capture tornado outbreaks and severe
storms, weather that has been too finegrained for existing global
models.
“We’re kind of ambitious,” Lin says.
“We’re trying to cover
everything.”
On a screen at GFDL, Lucas Harris, Lin’s deputy, zooms in on
Oklahoma, where a nested FV3 grid is recreating the events of May 2013.
It was that month that a severe twister plowed through Moore, Oklahoma,
killing 24.
As the model runs, scattered storms organize into a line of
squalls.
Then anvil clouds form—the thunderstorm cells from which
tornadoes would touch down on Moore.
Next, Harris changes the place and
time, to the eastern United States in June 2012, when a bow of
thunderstorms—a so-called derecho—caught forecasters off guard and in
some areas knocked out power for a week.
The model sees traces of the
storm nearly 3 days in advance.
“Previously,” Harris says, “it was
believed there was only 12 hours of predictability to this event.”
So far these results have stayed in the lab, but Lin is doing his
best to spread the gospel.
For the 2017 hurricane season, his prototype
will run alongside existing regional hurricane models.
And next month,
Lin will return to Oklahoma for the “Spring Experiment,” a research
jamboree of severe storm scientists, to test how the zooming technique
could help local forecasters.
All this collaboration, this dependence on outside contributions,
makes Lin nervous.
His model is moving out of the lab into the messy
real world.
Will it become the bedrock of all weather and climate
prediction, from tornadoes next week to temperature rises next decade?
“I’m cautiously optimistic, but not overly optimistic,” he says.
A good omen comes the next morning.
Snow blankets
Princeton—beautiful, but also manageable.
Nearly 6 inches fell, not a
foot or more.
GFDL could have stayed open.
Over the ether, Lin can’t
resist a final comment.
“The snow,” he writes, “is not as bad as
forecasted.”
Cartographers are
still putting the finishing touches on the new map, which will appear in
the visitors’ center at the San Francisco Maritime National Historical
Park.
This detail from a new map of buried ships in San Francisco shows the original shoreline extending inland to the current location: the iconic Transamerica Pyramid building (top center).
Dozens of vessels that brought gold-crazed prospectors to the city in the 19th century still lie beneath the streets.
Every day thousands of passengers on underground streetcars in San
Francisco pass through the hull of a 19th-century ship without knowing
it.
Likewise, thousands of pedestrians walk unawares over dozens of old
ships buried beneath the streets of the city’s financial district.
The
vessels brought eager prospectors to San Francisco during the California
Gold Rush, only to be mostly abandoned and later covered up by landfill
as the city grew like crazy in the late 1800s.
Now, the San Francisco Maritime National Historical Park has created a
new map of these buried ships, adding several fascinating discoveries
made by archaeologists since the first buried-ships map was issued, in
1963.
It’s hard to imagine now, but the area at the foot of Market Street,
on the city’s eastern flank, was once a shallow body of water called
Yerba Buena Cove, says Richard Everett, the park’s curator of exhibits.
The shoreline extended inland to where the iconic Transamerica Pyramid
now rises skyward.
In 1848, when news of the Gold Rush began spreading, people were so desperate to get to California that all sorts of dubious vessels were pressed into service, Everett says.
On arrival, ship captains found no waiting cargo or passengers to justify a return journey—and besides, they and their crew were eager to try their own luck in the gold fields.
This is one of
five panels in a panoramic daguerreotype taken by William Shew in or
around 1852. Rincon Point, the southern end of the cove, appears in the
foreground.
The ships weren’t necessarily abandoned—often a keeper was hired to keep an eye on them, Everett says—but they languished and began to deteriorate.
The daguerreotype above, part of a remarkable panorama taken in 1852, shows what historians have described as a “forest of masts” in Yerba Buena Cove.
Sometimes the ships were put to other uses.
The most famous example is the whaling ship Niantic, which was intentionally run aground in 1849 and used as a warehouse, saloon, and hotel before it burned down in a huge fire in 1851 that claimed many other ships in the cove.
A hotel was later built atop the remnants of the Niantic at the corner of Clay and Sansome streets, about six blocks from the current shoreline (see map at top of post).
Localization with the GeoGarage platform (NOAA chart on Google Maps)
A few ships were sunk intentionally.
Then as now, real estate was a hot commodity in San Francisco, but the laws at the time had a few more loopholes.
“You could sink a ship and claim the land under it,” Everett says.
You could even pay someone to tow your ship into position and sink it for you.
Then, as landfill covered the cove, you’d eventually end up with a piece of prime real estate.
All this maneuvering and the competition for space led to a few skirmishes and gunfights.
One of these intentionally scuttled ships was the Rome, which was rediscovered in the 1990s when the city dug a tunnel to extend a streetcar line (the N-Judah) south of Market Street.
Today the line (along with two others, the T and the K) passes through the forward hull of the ship.
Eventually Yerba Buena Cove was filled in.
People built piers out into it to reach ships moored in deeper water, Everett says.
“The wharves are constantly growing like fingers out from the shore.”
Then people began dumping debris and sand into the cove, which was only a few feet deep in many places to begin with.
“By having guys with carts and horses dump sand off your pier,” Everett says, “you could create land that you could own.”
It was a land-grab strategy with lasting ramifications—as evidenced by the ongoing controversy over a sinking, tilting skyscraper built on landfill near what was once the southern edge of Yerba Buena Cove.
Three archaeologists—James Allan, James Delgado, and Allen Pastron—consulted on the making of the new shipwreck map, and discoveries by them and their colleagues have added several fascinating details that weren’t on the original buried-ships map created by the San Francisco Maritime National Historical Park in 1963 (see below).
Red circles on the new map indicate sites that have been studied by archaeologists.
This detail from the original 1963 buried-ships map shows “Sydney Town,” where Australians congregated in Gold Rush days.
There was a Chilean enclave just inland from here, and fights sometimes broke out between the two groups. Map courtesy San Francisco Maritime National Historical Park
One of the most interesting additions to the new map is a ship-breaking yard at Rincon Point at the southern end of Yerba Buena Cove, near the current anchorage point for the Bay Bridge.
A man named Charles Hare ran a lucrative salvage operation here, employing at least 100 Chinese laborers to take old ships apart.
Hare sold off brass and bronze fixtures for use in new ships and buildings.
Scrap wood was also a valuable commodity in those days, Everett says.
The 1851 fire ended Hare’s business.
Archaeologists have found the remnants of six ships at the site that were presumably in the process of being salvaged at the time of the fire. One—the Candace—was another whaling vessel pressed into service to bring gold-crazed prospectors to San Francisco.
A lighter, small, flat-bottomed boat that was used to shuttle goods from moored ships to shore has also been found.A development project near Broadway and Front streets, which began in 2006, turned up bones that archaeologists suspect came from Galapagos tortoises (the site is marked by an asterisk in the map at the top of this post).
After passing around Cape Horn, many ships stopped in the Galapagos Islands and threw a few turtles in the hold—a source of fresh meat for the long voyage north to California.
“They got to San Francisco, and lo and behold: They had more turtle than they could eat,” Everett says.
Menus from the era show that turtle soup was a common offering at restaurants and lodging houses around the cove.
Illustrator and designer Michael Warner says his inspirations for the new map included the “Maps of Discovery” from a mural painted by N.C. Wyeth in 1928 for the headquarters of the National Geographic Society.
Wyeth’s imaginative painting evokes the romance of the Age of Discovery, and Warner says it inspired him to go beyond just showing the details of the buried ships and historic wharves.
“My hope is that I have not only enhanced the image for the history enthusiast,” he says, “but created something that might even make people learn by accident!”
The team is still ironing out some final details, such as how to most accurately represent the boundaries of Charles Hare’s ship-breaking yard.
They hope to have posters of the new map available for purchase early next year and plan to eventually put it on display in the visitors’ center.
Thirteen competitors started this race in 1964, which by now was firmly established on the racing scene. All of the five
original competitors entered, and all five improved their original
times (Gipsy Moth III with Sir Francis Chichester the winner of the first edition in 1960 making
ready);
but the show was stolen by French naval officer Éric Tabarly, who entered a custom-built 44-foot (13 m) plywood ketch, Pen Duick II. The days of racers sailing the family boat were numbered following Tabarly's performance, for which he was awarded the Légion d'honneur by president Charles de Gaulle. It is also noteworthy that Tabarly and Jean Lacombe were the only
French entrants in this race; Tabarly's success was instrumental in
popularising the sport in France, the country which in future years
would come to dominate it.
This was to be the year in which several future trends were established.
Multihulls
made their first appearance — sailing in the same class as the other
boats; and the race featured the use of radio, for the first time, by
several competitors who gave daily progress reports to their sponsors.


