A Plastic Ocean is an adventure documentary shot on more than 20 locations over the past 4 years. Explorers Craig Leeson and Tanya Streeter and a team of international scientists reveal the causes and consequences of plastic pollution and share solutions.
This film directed by Emily V. Driscoll, is an award-winning short documentary that follows NYC sci-artist Mara G. Haseltine as she creates a sculpture to reveal a microscopic threat beneath the surface of the ocean.
During a Tara Oceans expedition to study the health of the oceans, Haseltine finds an unsettling presence in samples of plankton she collected.
The discovery inspires her to create a sculpture that shows that the microscopic ocean world affects all life on Earth.
Watch Mara G. Haseltine's art film featuring her sculpture and opera singer Joseph Bartning: La Boheme- A Portrait of Our Oceans in Peril vimeo.com/128797284
The video above describes how the sea swarm works. Bio-inspired Computation and Intelligent Machines Lab, Lisbon, Portugal, Initituto de Telecomunições, Lisbon, Portugal, University Instituite of Lisbon (ISCTE-IUL), Lisbon, Portugal
Robots may be the wave of the future, but it will be a pretty chaotic
future if they don't learn to work together.
This cooperative approach
is known as swarm robotics
and in a first in the field, a team of engineers has demonstrated a
swarm of intelligent aquatic surface robots that can operate together in
a real-world environment.
The sea-going robots are made using digital manufacturing techniques
(Credit: Biomachines Lab)
Using "Darwinian" learning, the robots are
designed to teach themselves how to cooperate in carrying out a task.
A major problem facing the navies of the world is
that as ships become more sophisticated they also become much more
expensive.
They are packed with highly trained personnel that cannot be
put at risk, except in the most extreme circumstances, and even the most
advanced ship suffers from not being able to be in two places at once.
One solution to this dilemma is to augment the ships
with swarms of robot boats that can act as auxiliary fleets at much
lower cost and without risk of life.
The tricky bit is figuring out how
to get this swarm to carry out missions without turning into a robotic
version of the Keystone Cops.
The approach being pursued by a team from
the Institute of Telecommunications at University Institute of Lisbon
and the University of Lisbon in Portugal is to rely on self-learning
robots.
Led by Dr. Anders Christensen, the team recently
demonstrated how up to ten robots can operate together to complete
various tasks.
The small robots are made of CNC-machined polystyrene
foam and 3D-printed components at a materials cost of about €300
(US$330).
The electronics pack include GPS, compass, Wi-Fi, and a
Raspberry Pi 2 computer.
However, the key is their decentralized
programming.
"Swarm robotics is a paradigm shift: we rely on many small, simple,
and inexpensive robots, instead of a single or a few large, complex, and
expensive robots," says Christensen.
"Controlling a large-scale swarm
of robots cannot be done centrally. Each robot must decide for itself
how to carry out the mission, and coordinate with its neighbors."
Instead of using a central computer or programming
each robot individually, the swarm operates on what the team calls a
Darwinian approach.
In other words, each robot is equipped with a neural
network that mimics the operations of a living brain.
The robots are
given a simple set of instructions about how to operate in relationship
to one another as well as mission goals.
The robots are then allowed to interact with one
another in a simulated environment and those that display successful
mission behavior are allowed to proceed.
The "fittest" robots from the
simulations are then tested in the real world.
According to the team, the clever bit about the swarm
is that, like schools of fish or flocks of birds, none of the robots
know of or "care" about the other robots beyond their immediate
neighbors. Instead, they react to what their immediate neighbors do as
they determine the best way to fulfill their mission objectives such as
area monitoring, navigation to waypoint, aggregation, and dispersion.
In
a sense, they learn to cooperate with one another.
The team is currently working on the next generation
of aquatic robots with more advanced sensors and the ability to handle
longer missions.
Eventually, they could be used in swarms numbering
hundreds or thousands of robots for environmental monitoring, search and
rescue, and maritime surveillance.
The team's research is being peer reviewed and is available here.
An increasing number of nonprofit organizations are relying on satellite imagery to monitor environmental degradation. Chief among them is SkyTruth, which has used this data to expose the extent of the BP oil spill, uncover mining damage, and track illegal fishing worldwide.
When Brian Schwartz, a Johns Hopkins University epidemiologist researching the public health impacts of hydraulic fracturing, read about an environmental group that uses satellite imagery and aerial photography to track environmental degradation, he was intrigued.
It was the summer of 2013, and the group, SkyTruth, had just launched a crowdsourcing project on its website to map fracking activity in Pennsylvania.
The site provided volunteers with U.S. government aerial images from across the state and a brief tutorial on how to identify fracking locations.
Within a month, more than 200 volunteers sorted through 9,000 images to pinpoint 2,724 fracking wellpads.
Schwartz ended up using this data in a study published last October in the journal Epidemiology, showing that women living near hydraulic fracturing sites in 40 Pennsylvania counties faced a significantly elevated risk of giving birth prematurely.
That’s precisely the sort of result that John Amos, SkyTruth’s president, envisioned when he founded the group in 2001.
He has since become part data analyst, part environmental advocate, and part satellite-imagery proselytizer as he looks for ways to use remote sensing to call attention to little-noticed environmental damage.
This month, SkyTruth’s website is displaying a map showing the global prevalence of flaring, the wasteful and carbon-spewing oil industry practice of burning natural gas and other drilling byproducts.
Through most of December, SkyTruth and another satellite-focused nonprofit, Moscow-based Transparent World,
displayed images of a burning oil platform and a 2,300-barrel oil slick
in the Caspian Sea.
The platform’s owner, Azerbaijan’s state-owned oil
company, SOCAR, denied that any spill had occurred.
In the 5 years since BP, there have been nearly 10,000 spills reported in the Gulf of Mexico
SkyTruth’s defining moment came in 2010, when Amos — analyzing satellite
photographs — sounded the alarm that the Deepwater Horizon oil spill in
the Gulf of Mexico was far larger than the petroleum company, BP, and
the U.S. government were acknowledging.
“If you can see it,” says SkyTruth’s motto, displayed at the top of its website, “you can change it.”
One indication of SkyTruth’s influence is a cautionary headline that
appeared after SkyTruth formed a partnership with Google and the
nonprofit Oceana in November 2014 to launch a system called Global Fishing Watch,
which uses the satellite transponders found aboard most large fishing
vessels to track the activities of the world’s fishing fleets.
“Big
Brother is watching,” warned World Fishing & Aquaculture, a trade journal.
That admonition could be extended to all the extractive industries — oil
and gas, mining, logging, and fishing — whose operations can be tracked
by remote sensing.
A growing number of governments now conduct
environmental observation by satellite, including Brazil, which monitors
deforestation in the Amazon.
And environmental groups now commonly use
remote sensing tools.
One prominent example is Global Forest Watch,
a system launched two years by Washington-based World Resources
Institute to monitor logging and fires in the world’s forests.
Russia-based Transparent World employs satellite imagery for many
purposes, including monitoring of protected areas and observing the
impacts of dam construction.
Amos, 52, says he considered himself an environmentalist even while he
spent a decade working for oil and gas companies as a satellite imagery
analyst looking for drilling sites.
He quit in 2000 to start a
non-profit that would apply his skills to environmental protection.
For
years he ran SkyTruth from the basement of his Shepherdstown, West
Virginia home on an annual budget of less than $100,000, and he still speaks of “begging” satellite images from commercial providers.
Although SkyTruth has expanded in recent years to eight employees
supported by a $600,000 budget, it is still tiny, particularly compared
to the U.S. government’s massive satellite resources.
Nevertheless, SkyTruth has
delved into realms that the government has avoided.
One reason, Amos
says, is that satellite imagery analysis is so unfamiliar that “nobody
has known what to ask for” — thus, one of SkyTruth’s missions is to show
what’s possible.
Its usual method is to release a trove of
environment-related data, then invite researchers and crowdsource
amateurs to analyze it.
SkyTruth has benefited enormously from the explosion in the last 15
years in satellite imagery and other digital technologies.
When Amos
started SkyTruth, a single Landsat satellite image cost $4,400; now the
entire U.S. government collection— more than 4.7 million images and
growing daily— is available free of charge.
Not only have satellites and
satellite imagery become cheap, but the capacity to analyze, duplicate,
send, and store satellite data has expanded by orders of magnitude.
In
fact, satellite technology is now considered a subset of a larger field,
geospatial intelligence, which has tens of thousands of practitioners
around the world employing an array of optical, thermal, radar, and
radiometric remote sensing tools.
“It’s evolved from a problem of getting imagery to deciding which image
do I want to pluck out of this massive cloud,” Amos told me.
The finding by Schwartz, the Johns Hopkins epidemiologist, on premature
births suggests a correlation between fracking and poor human health;
but because the chemical trigger wasn’t identified, the link isn’t
regarded as causal.
From more than 1,000 available chemicals, fracking
operators select a dozen or so that fit the geological challenges of a
particular site.
People living near the site typically can’t find out
whether their wells and aquifers have been contaminated because the cost
of testing for all 1,000 chemicals is prohibitive, and operators treat
each site’s chemical recipe as a trade secret.
The quandary led Amos to venture beyond satellite imagery into the
larger field of geospatial data. Along with several better-known
environmental groups, SkyTruth argued for disclosure of the recipe used
at each frackingsite.
Two industry lobbying groups, the American Petroleum Institute and
America’s Natural Gas Alliance, defused mounting Congressional pressure
for mandatory disclosure by launching a website, FracFocus,
where operators could post their recipes voluntarily.
But soon after
the site’s launch in 2011, users found that information posted on it was
entered in the wrong field, misspelled chemical trade names, or omitted
key facts deemed proprietary.
The site thwarted researchers by
requiring postings in a format that computers couldn’t read.
Although 23
states require fracking companies to use FracFocus to disclose their
chemical use, a 2013 Harvard Law School report concluded that FracFocus’ “fails as a regulatory compliance tool.”
SkyTruth’s lead programmer, Paul Woods, devised a way around some of
FracFocus’ barriers by writing software that “scraped” all the chemical
data from the tens of thousands of reports posted on the site.
Then he
posted it in a database on SkyTruth’s website.
In addition, under
pressure from SkyTruth, other environmental groups, and an Energy
Department advisory board, FracFocus agreed to make its data available
in machine-readable form beginning in May 2015.
These developments have
yielded more and more information for researchers, such as Schwartz, who
are investigating fracking’s health impact.
“This is a very wonky issue that makes people’s eyes glaze over,” Amos
said.
“But it’s where the rubber meets the road in terms of
understanding if fracking is bad for you.”
The first time that SkyTruth attracted national attention was in April
2010, when Amos received a Google alert that an oil platform called
Deepwater Horizon, 50 miles off the Louisiana coast, had exploded and
burned.
Amos knew explosions like this one were uncommon and usually led
to spills.
He began searching for satellite photos, but the first ones he found
were obscured by clouds. Meanwhile, BP, which leased the rig, and the
Coast Guard, echoing BP, maintained that the ruptured well beneath the
rig was leaking oil at a rate of 1,000 barrels a day— a major spill but
perhaps not a catastrophic one.
The number was vital, for it would help
determine the scale and strategy of the leak containment effort, the
eventual cost to BP in fines and damages, and the scope of preparations
for the next spill.
It took Amos six days to acquire clear images.
His first thought, he
says, was: “Oh my God! This is much bigger than anybody realizes.”
He
calculated that the slick was 50 miles long and covered 817 square miles.
He outlined the slick, along with his calculations, and posted
both on SkyTruth’s website.
Within a day, Ian MacDonald, a Florida State University oceanographer
and oil slick authority, notified Amos that the leak’s flow rate was
much bigger than a thousand barrels a day.
Using Amos’ calculations of
the lick’s size and conservative assumptions about its thickness, MacDonald
concluded that it was “not unreasonable” that the leak was 20 times BP’s
initial estimate.
Undermined by SkyTruth’s numbers, the National
Oceanic and Atmospheric Administration conceded the next day that BP’s
initial estimate was too low: over BP’s public objections, NOAA revised
the government estimate to 5,000 barrels a day.
Two months later, —
prodded, in part, by SkyTruth — government scientists concluded that the
initial flow rate was 62,000 barrels a day, 62 times BP’s initial
estimate.
SkyTruth has also affected the course of mountaintop removal coal
mining.
Appalachian states have issued hundreds of permits for
mountaintop removal mines, but they’ve rarely checked to see whether the
mines have stayed within the permitted boundaries.
Permits are supposed
to be issued only after assessing impacts on downstream waterways, and a
study of ten West Virginia counties published in 2004 by the state’s
environmental protection department found that nearly 40 percent of
mines in ten counties were situated outside permitted locations.
Acting on a request from Appalachian Voices,
a North Carolina-based nonprofit that opposes mountaintop removal
mining, SkyTruth devised a technique for identifying the mines from
satellite images, then mapped their growth over three decades and posted
the results on its website in 2009.
The information was used in six
peer-reviewed academic articles, including a Duke University study that
found that once five percent of a watershed is mined, water quality in
its rivers and streams usually fails to meet state standards.
That study
in turn provided empirical backing for the U.S. Environmental
Protection Agency’s 2011 revocation of a mine permit
in West Virginia that had been issued by the U.S. Army Corps of
Engineers.
The decision marked the first time the EPA had ever reversed a
coal mine’s permit under the Clean Water Act.
This June 21 2014 satellite photo from NASA, annotated by SkyTruth, shows an oil slick extending in an arc at least 8.3 miles (13.4 km) long from a well site at a Taylor Energy Co. platform that was toppled in an underwater mudslide triggered by Hurricane Ivan's waves in September 2004.
In search of images that tell environmental stories, SkyTruth pays close
attention to news reports, but occasionally it finds stories of its own.
One example is what is probably the Gulf of Mexico’s longest-running
commercial oil spill, at the site of a rig destroyed by an underwater
mudslide during Hurricane Ivan in 2004.
The slide buried 28 wells on the
sea floor under 100 feet of mud, which made sealing them extremely
difficult.
The rig’s owner, Taylor Energy Company, went bankrupt trying.
Amos discovered the leaks in 2010 while studying Hurricane Katrina’s
impacts, and has been sounding an alarm ever since.
The leaks have
trickled steadily into the Gulf’s waters since 2004 at a rate Amos
estimates at between one and 20 barrels a day, creating a slick that is
sometimes 20 miles long.
The wells are ten miles offshore in federally
managed water, but no federal agency has tried to seal the leak.
Given the controversial issues SkyTruth has been involved with, the
group has attracted surprisingly little criticism, perhaps because so
much of its work is grounded in visual data— for SkyTruth, seeing really
is believing.
A notable exception occurred in 2009 when Amos testified
at a U.S. Senate subcommittee hearing on the under-appreciated risks of
deepwater oil drilling.
Senator Mary Landrieu, a Louisiana Democrat,
attacked Amos for overlooking the oil industry’s safety record and
economic benefits.
“You do a great disservice by not telling the
American people the truth about drilling and putting it in the
perspective it deserves,” Landrieu told Amos.
Landrieu didn’t give Amos a chance to respond, but, as it turned out, he
didn’t have to.
The BP spill occurred five months later.
Coast Survey’s navigation response teams have proven their value, time
and again, especially after hurricanes when ports suspend operations,
and shipping (or naval movements) cease until Coast Survey’s small boats
can locate underwater dangers to navigation.
But what do the six navigation response teams (NRTs) do during those long periods between deployments for maritime emergencies?
They are busy, mostly year-round, collecting hydrographic data for updating nautical charts.
Plans for 2016
Responding to requests from mariners around the country, Coast Survey
has set some aggressive projects for the NRTs this year.
Starting from
Northeast and working our way around the coasts…
NEW YORK
Beginning in June and throughout the summer, NRT5 will survey the
Hudson River, with a focus on the area from Albany to Kingston.
This is a
continuation of the project started at the request of the Hudson River
Pilots (as reported in NOAA plans multiyear project to update Hudson River charts).
We are planning to have Coast Survey research vessel Bay Hydro II
join the NRT for most of the summer, to get as much new charting data
as possible.
In October, NRT5 will move to Eastern Long Island Sound, to
finish up some shallow survey work adjacent to recent NOAA Ship Thomas Jefferson’s extensive survey project.
The officer-in-charge of NRT5 is NOAA Lt. Andrew Clos.
The officer-in-charge of Bay Hydro II will be NOAA Ensign Sarah Chappel.
GEORGIA
In March, NRT2 starts a 16-month survey project in Saint Andrew
Sound.
The area, which has significant traffic from small boats, tugs,
and barges, is reportedly experiencing small boat groundings, and Coast
Survey’s navigation manager in the area has received several requests
for a modern survey.
Coast Survey will use the data to update NOAA chart
11504
and ENC US5GA12M, as well as other charts covering portions of the
specific surveyed areas.
The existing charted soundings are from partial
bottom coverage surveys dating back to the early 1900s.
NRT2 is led by
Erik Anderson.
NRT1 will check out the 18-yr-old reported depths to update chart 11376 inset.
EASTERN GULF OF MEXICO – BILOXI AND MOBILE
NRT1 will spend March and April acquiring data off the coast of Biloxi, Mississippi, to update the Intracoastal Waterway chart 11372.
They will then move to Alabama for some long-overdue “chart clean up”
work at the northern end of the Mobile Ship Channel, outside of the area
controlled by the Army Corps of Engineers.
The Mobile project will
investigate charted items, verify reported depths, and update older NOAA
bathymetry (vintage 1961) that is depicted in the inset area of NOAA chart 11376.
Since the Mobile survey probably will not take the entire rest of the
season, depending on interruptions for hurricane response, we are
assessing additional survey needs in the area.
NRT1 is led by Mark
McMann.
WEST GULF OF MEXICO – TEXAS
NRT4 will spend all of 2016 surveying in Galveston Bay, including the
bay entrance and newly charted barge channels along the Houston Ship
Channel.
The team is working with Coast Survey’s navigation manager for
Texas to identify additional charted features that require investigation
to reduce localized chart clutter and improve chart adequacy.
NRT4 is
led by Dan Jacobs.
NORTHERN CALIFORNIA
NRT6 is slated to survey the Suisun Bay anchorage
used by MARAD’s National Defense Reserve Fleet, to acquire updated
depths.
Afterwards, NRT6 will move throughout the bay area to address
charting concerns reported by the San Francisco Bar Pilot Association
near Pittsburg, Antioch, San Joaquin River, and Redwood City. Coast
Survey will use the data to generally update NOAA chart 18652 and ENC US5CA43M, as well as larger scale charts of the specific surveyed areas.
NRT6 is led by Laura Pagano.
PACIFIC NORTHWEST
It has been a while since Coast Survey has had an operational NRT
presence for Oregon and Washington, but this is the year we are bringing
NRT3 back on line.
Team lead Ian Colvert is shaking the dust off NRT3
and preparing to restart survey operations.
He is working with the Coast
Survey navigation manager to develop survey priorities for this summer
and fall.
Charting the data
Once the navigation response teams process and submit the data
acquired during the surveys, the information is further processed in
Coast Survey’s Atlantic and Pacific hydrographic branches, and then
submitted to our cartographers for application to the charts.
The
turnaround time for updating the chart depends on the update calendars
for each regional cartographic branch.
If the NRTs find any dangers to
navigation, the information will be relayed to mariners through the Local Notice to Mariners postings and will be applied to NOAA’s electronic navigational charts (NOAA ENC®), online products, and print-on-demand paper charts.
Critical updates will be applied to charts more quickly than normal depth adjustments.
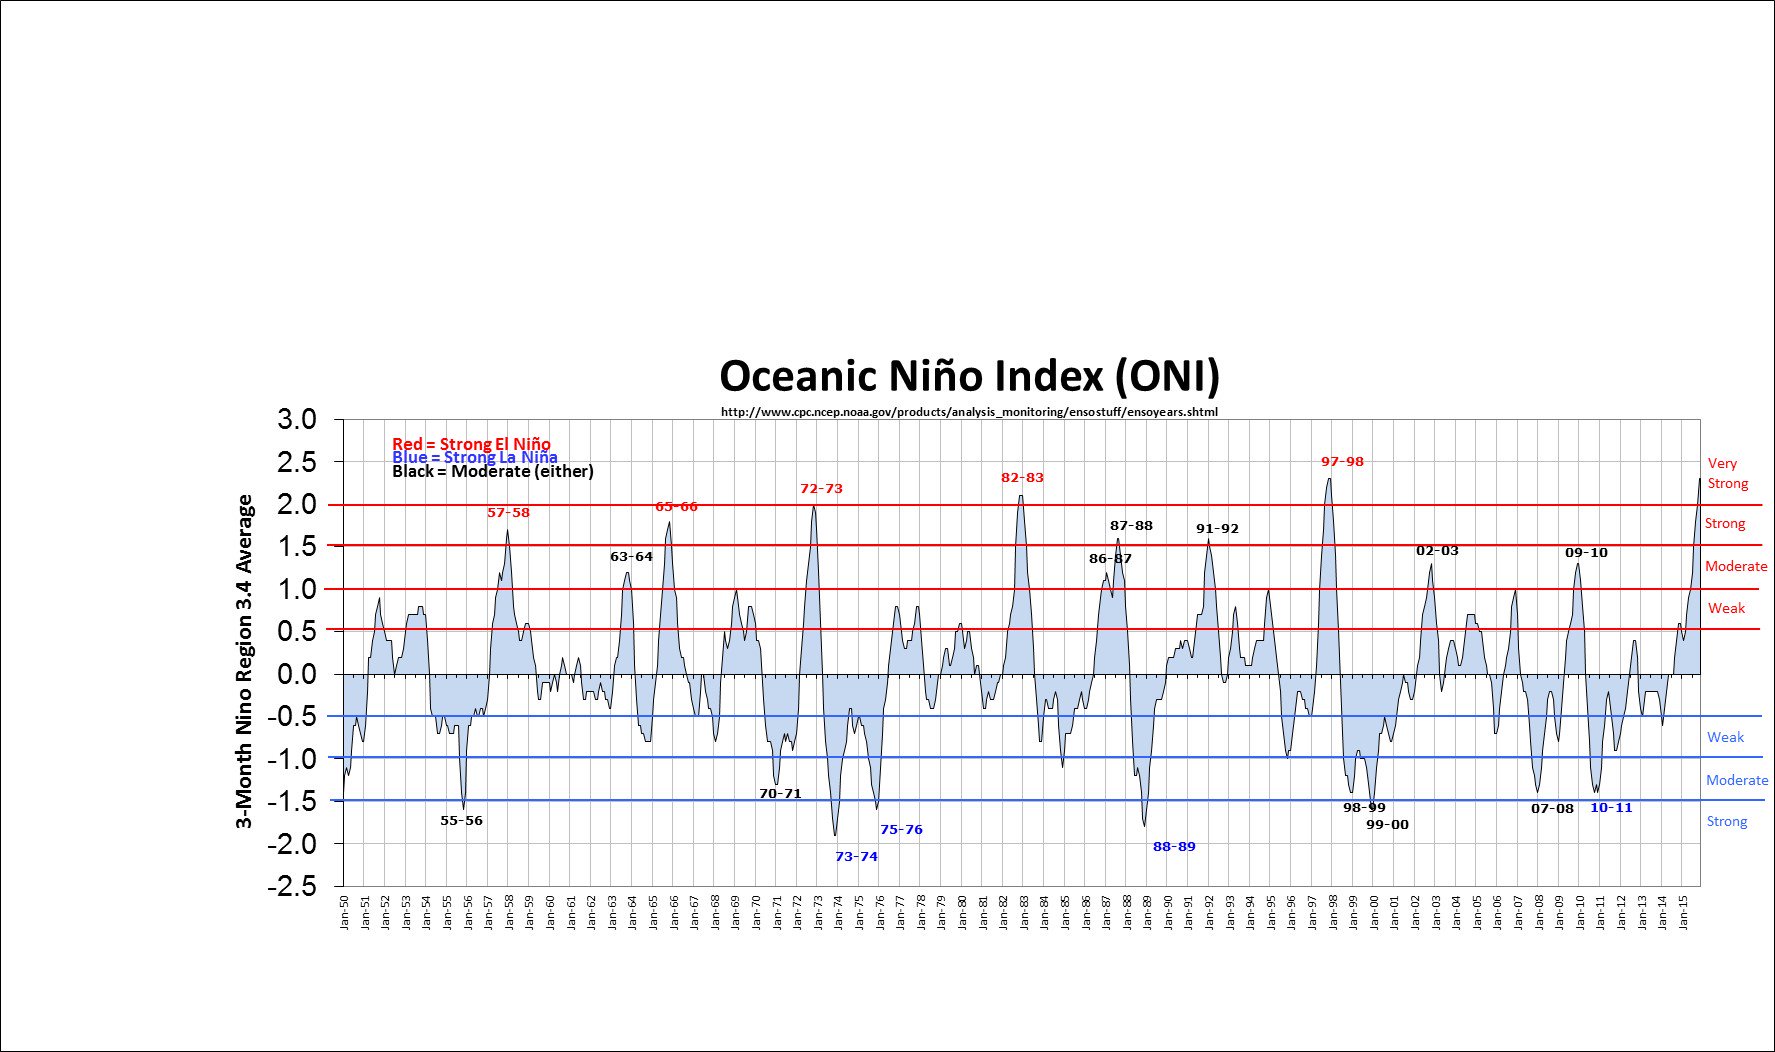
A
thousand miles south of Hawaii, the air at 45,000 feet above the
equatorial Pacific was a shimmering gumbo of thick storm clouds and icy
cirrus haze, all cooked up by the overheated waters below.
In a Gulfstream jet more accustomed to hunting hurricanes in the Atlantic, researchers with the National Oceanic and Atmospheric Administration
were cruising this desolate stretch of tropical ocean where the
northern and southern trade winds meet.
It’s an area that becalmed
sailors have long called the doldrums, but this year it is anything but
quiet.
This
is the heart of the strongest El Niño in a generation, one that is
pumping moisture and energy into the atmosphere and, as a result, roiling weather worldwide.
A satellite image of the area of the Pacific where a NOAA research team would be flying.
Kent Nishimura for The New York Times
The plane, with 11 people aboard including a journalist, made its way
Friday on a long westward tack, steering clear of the worst of the
disturbed air to the south.
Every 10 minutes, on a countdown from Mike
Holmes, one of two flight directors, technicians in the rear released an
instrument package out through a narrow tube in the floor.
Slowed by a
small parachute, the devices, called dropsondes,
fell toward the water, transmitting wind speed and direction, humidity
and other atmospheric data back to the plane continuously on the way
down.
Leonard Miller, a NOAA
technician, left, testing an instrument package called a dropsonde that
was set to be launched from the plane’s delivery system, right.
Credit
Left, Henry Fountain/The New York Times; right, Kent Nishimura for The New York Times
The
information, parsed by scientists and fed into weather models, may
improve forecasting of El Niño’s effect on weather by helping
researchers better understand what happens here, at the starting point.
“One
of the most important questions is to resolve how well our current
weather and climate models do in representing the tropical atmosphere’s
response to an El Niño,” said Randall Dole, a senior scientist at NOAA’s
Earth System Research Laboratory and one of the lead researchers on the project. “It’s the first link in the chain.”
An
El Niño forms about every two to seven years, when the surface winds
that typically blow from east to west slacken.
As a result, warm water
that normally pools along the Equator in the western Pacific piles up
toward the east instead.
Because of this shift, the expanse of water —
which in this El Niño has made the central and eastern Pacific as much
as 5 degrees Fahrenheit hotter than usual — acts as a heat engine,
affecting the jet streams that blow at high altitudes.
That,
in turn, can bring more winter rain to the lower third of the United
States and dry conditions to southern Africa, among El Niño’s many
possible effects.
Aided
by vast processing power and better data, scientists have improved the
ability of their models to predict when an El Niño will occur and how
strong it will be.
As early as last June, the consensus among
forecasters using models developed by NOAA, as well as other American
and foreign agencies and academic institutions, was that a strong El
Niño would develop later in the year, and it did.
But
scientists have been less successful at forecasting an El Niño’s effect
on weather.
This year, for instance, most models have been less certain
about what it will mean for parched California.
So far, much of the
state has received higher than usual precipitation, but it is still
unclear whether Southern California, especially, will be deluged as much as it was during the last strong El Niño, in 1997-98.
Anthony
Barnston, the chief forecaster at the International Research Institute
for Climate and Society at Columbia University, who has studied the
accuracy of El Niño modeling, said that so-called dynamical models,
which simulate the physics of the real world, have recently done a
better job in predicting whether an El Niño will occur than statistical
models, which rely on comparisons of historical data.
With
a dynamical model, Dr. Barnston said, data representing current
conditions is fed into the model, and off it goes.
“You plug it in and
you crank it forward in time,” he said.
This can be done dozens of times
— or as often as money will allow — tweaking the data slightly each
time and averaging the outcomes.
With
any model, good data is crucial.
El Niño models have been helped by the
development of satellites and networks of buoys that can measure
sea-surface temperatures and other ocean characteristics.
When
it comes to forecasting El Niño’s weather effects, however, good data
can be harder to come by.
That’s where the NOAA research project aims to
help, by studying a key process in the El Niño-weather connection: deep
tropical convection.
Alan S. Goldstein, the radar monitor for the mission, with other researchers before the flight.
Credit Kent Nishimura for The New York Times
The
clouds that the NOAA jet cruised past on Friday were a result of this
process, in which air over the warm El Niño waters picks up heat and
moisture and rises tens of thousands of feet.
When the air reaches high
altitudes — about the flight level of the Gulfstream — the moisture
condenses into droplets, releasing energy in the form of heat and
creating winds that flow outward.
Scientists
know that the energy released can induce a kind of ripple in a jet
stream, a wave that as it travels along can affect weather in disparate
regions around the world.
And they know that the winds that are
generated can add a kick to a jet stream, strengthening it. That’s a
major reason California and much of the southern United States tend to
be wetter in an El Niño; the winds from convection strengthen the jet
stream enough that it reaches California and beyond.
But
to study convection during an El Niño, data must be collected from the
atmosphere as well as the sea surface.
That’s a daunting task, because
the convection occurs in one of the most remote areas of the planet. As a
result, there has been little actual data on convection during El Niño
events, Dr. Dole said, and most models, including NOAA’s own, have had
to make what amount to educated guesses about the details of the
process.
“Our
strong suspicion is that our models have major errors in reproducing
some of these responses,” he said.
“The only way we can tell is by going
out and doing observations.”
When
forecasters last year began to predict a strong El Niño, the NOAA
scientists saw an opportunity and started making plans for a
rapid-response program of research.
Dr. Dole estimated that it would normally take two or three years to put together a program they assembled in about six months.
In
a way, he said, they were helped by the developing El Niño, which
suppressed hurricane activity in the Atlantic last fall.
The Gulfstream
flew fewer missions and the available flight hours, as well as extra
dropsondes, were transferred to the project.
In
addition to the jet — which is also equipped with Doppler radar to
study wind — the program is launching other sondes, from a ship and a
small atoll near the Equator.
A large remotely piloted aircraft from
NASA, the Global Hawk, has also been enlisted to study the Pacific
between Hawaii and the mainland.
The
Gulfstream flight Friday was the researchers’ fourth so far, out of
nearly two dozen planned over the next month.
The day began at Honolulu
International Airport five hours before the 11:30 a.m. takeoff when Ryan
Spackman, the other lead investigator, and NOAA colleagues sat down for
a weather briefing with Dr. Dole and other scientists at the agency’s
offices in Boulder, Colo.
The
original plan was to fly due south from Honolulu and around an area of
convection — a “cell” in meteorological terms — near the Equator.
But
when the plane’s three pilots arrived for their briefing several hours
later, the plan was changed out of safety concerns.
There was a risk
they would have no way to get back from the south side of the convection
area without going through a storm, and the Gulfstream, unlike NOAA’s
other hurricane-hunting planes, cannot do that.
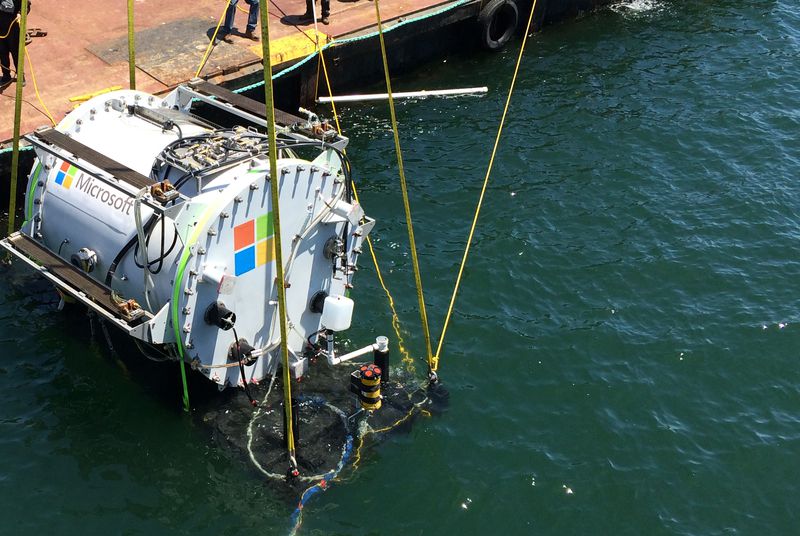
Introducing Microsoft Project Natick, a Microsoft research project to manufacture and operate an underwater datacenter.
The initial experimental prototype vessel, christened the Leona Philpot after a popular Xbox game character, was operated on the seafloor approximately one kilometer off the Pacific coast of the United States from August to November of 2015.
Project Natick reflects Microsoft’s ongoing quest for cloud datacenter solutions that offer rapid provisioning, lower costs, high responsiveness, and are more environmentally sustainable.
Taking a page from Jules Verne, researchers at Microsoft believe the future of data centers may be under the sea.
Microsoft
has tested a prototype of a self-contained data center that can operate
hundreds of feet below the surface of the ocean, eliminating one of the
technology industry’s most expensive problems: the air-conditioning
bill.
Today’s
data centers, which power everything from streaming video to social
networking and email, contain thousands of computer servers generating
lots of heat.
When there is too much heat, the servers crash.
Putting
the gear under cold ocean water could fix the problem.
It may also
answer the exponentially growing energy demands of the computing world
because Microsoft is considering pairing the system either with a
turbine or a tidal energy system to generate electricity.
The
effort, code-named Project Natick, might lead to strands of giant steel
tubes linked by fiber optic cables placed on the seafloor.
Another
possibility would suspend containers shaped like jelly beans beneath the
surface to capture the ocean current with turbines that generate
electricity.
Ben Cutler, left, and Norman Whitaker, both of Microsoft Research, with the “Leona Philpot,” a prototype underwater data center, at the company’s headquarters in Redmond, Wash.
Credit Matt Lutton for The New York Times
“When
I first heard about this I thought, ‘Water ... electricity, why would
you do that?’ ” said Ben Cutler, a Microsoft computer designer who is
one of the engineers who worked on the Project Natick system.
“But as
you think more about it, it actually makes a lot of sense.”
Such
a radical idea could run into stumbling blocks, including environmental
concerns and unforeseen technical issues.
But the Microsoft researchers
believe that by mass producing the capsules, they could shorten the
deployment time of new data centers from the two years it now takes on
land to just 90 days, offering a huge cost advantage.
The
underwater server containers could also help make web services work
faster.
Much of the world’s population now lives in urban centers close
to oceans but far away from data centers usually built in out-of-the-way
places with lots of room.
The ability to place computing power near
users lowers the delay, or latency, people experience, which is a big
issue for web users.
“For
years, the main cloud providers have been seeking sites around the
world not only for green energy but which also take advantage of the
environment,” said Larry Smarr, a physicist and scientific computing
specialist who is director of the California Institute for
Telecommunications and Information Technology at the University of
California, San Diego.
Driven
by technologies as varied as digital entertainment and the rapid
arrival of the so-called Internet of Things, the demand for centralized
computing has been growing exponentially.
Microsoft manages more than
100 data centers around the globe and is adding more at a rapid clip.
The company has spent more than $15 billion on a global data center
system that now provides more than 200 online services.
The “Leona Philpot” prototype was deployed off the central coast of California on Aug. 10, 2015.
In
2014, engineers in a branch of Microsoft Research known as New
Experiences and Technologies, or NExT, began thinking about a novel
approach to sharply speed up the process of adding new power to
so-called cloud computing systems.
“When
you pull out your smartphone you think you’re using this miraculous
little computer, but actually you’re using more than 100 computers out
in this thing called the cloud,” said Peter Lee, corporate vice
president for Microsoft Research and the NExT organization.
“And then
you multiply that by billions of people, and that’s just a huge amount
of computing work.”
The
company recently completed a 105-day trial of a steel capsule — eight
feet in diameter — that was placed 30 feet underwater in the Pacific
Ocean off the Central California coast near San Luis Obispo.
Controlled
from offices here on the Microsoft campus, the trial proved more
successful than expected.
The
researchers had worried about hardware failures and leaks.
The
underwater system was outfitted with 100 different sensors to measure
pressure, humidity, motion and other conditions to better understand
what it is like to operate in an environment where it is impossible to
send a repairman in the middle of the night.
The
system held up.
That led the engineers to extend the time of the
experiment and to even run commercial data-processing projects from
Microsoft’s Azure cloud computing service.
The
research group has started designing an underwater system that will be
three times as large.
It will be built in collaboration with a
yet-to-be-chosen developer of an ocean-based alternative-energy system.
The Microsoft engineers said they expected a new trial to begin next
year, possibly near Florida or in Northern Europe, where there are
extensive ocean energy projects underway.
The
first prototype, affectionately named Leona Philpot — a character in
Microsoft’s Halo video game series — has been returned, partly covered
with barnacles, to the company’s corporate campus here.
It
is a large white steel tube, covered with heat exchangers, with its
ends sealed by metal plates and large bolts.
Inside is a single data
center computing rack that was bathed in pressurized nitrogen to
efficiently remove heat from computing chips while the system was tested
on the ocean floor.
The
idea for the underwater system came from a research paper written in
2014 by several Microsoft data center employees, including one with
experience on a Navy submarine.
Norman
A. Whitaker, the managing director for special projects at Microsoft
Research and the former deputy director at the Pentagon’s Defense
Advanced Research Projects Agency, or Darpa, said the underwater server
concept was an example of what scientists at Darpa called “refactoring,”
or completely rethinking the way something has traditionally been
accomplished.
Even
if putting a big computing tube underwater seems far-fetched, the
project could lead to other innovations, he said.
For example, the new
undersea capsules are designed to be left in place without maintenance
for as long as five years.
That means the servers inside it have to be
hardy enough to last that long without needing repairs.
That
would be a stretch for most servers, but they will have to improve in
order to operate in the underwater capsule — something the Microsoft
engineers say they are working on.
Project Natick vessel being deployed.
They’re
also rethinking the physical alignment of data centers.
Right now,
servers are put in racks so they can be maintained by humans.
But when
they do not need maintenance, many parts that are just there to aid
human interaction can be removed, Mr. Whitaker said.
“The idea with refactoring is that it tickles a whole bunch of things at the same time,” he said.
In
the first experiment, the Microsoft researchers said they studied the
impact their computing containers might have on fragile underwater
environments.
They used acoustic sensors to determine if the spinning
drives and fans inside the steel container could be heard in the
surrounding water.
What they found is that the clicking of the shrimp
that swam next to the system drowned out any noise created by the
container.
One
aspect of the project that has the most obvious potential is the
harvest of electricity from the movement of seawater.
This could mean
that no new energy is added to the ocean and, as a result, there is no
overall heating, the researchers asserted.
In their early experiment the
Microsoft engineers said they had measured an “extremely” small amount
of local heating of the capsule.
“We measured no heating of the marine environment beyond a few inches from the vessel,” Dr. Lee said.
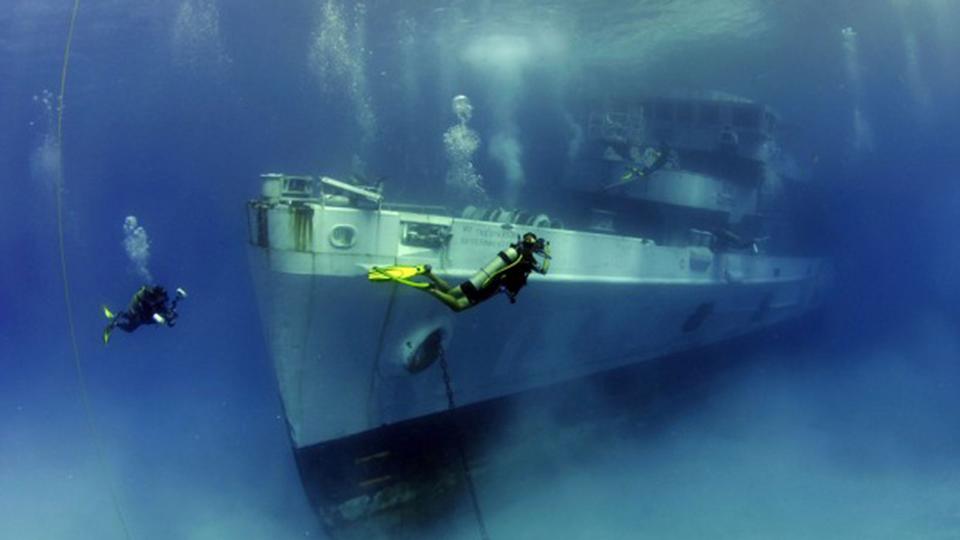
There are so many shipwrecks, in fact, that a search operation for the missing Malaysia Airlines Flight 370 has discovered two by accident.
The Battle of the Atlantic
alone, which spanned nearly six years during World War II, claimed over
3,500 merchant vessels, 175 warships, and 783 submarines.
Particularly
interesting are the cargo ships that literally contain treasure, such
as Spanish galleons that transported gold and jewels across the
Atlantic.
The Uluburun shipwreck
off the coast of southwestern Turkey is roughly 3,300 years old, and
that Late Bronze Age vessel contained gold, silver, jewels, copper and
tin ingots, tools, swords and other weapons, and much more trade
cargo—all of it hauled up over the course of 10 years and 22,413 dives.
But
most wrecks don't receive that kind of attention.
In fact, less than 10
percent of the shipwrecks that we we've located—which account for just
10 percent of all shipwrecks in the world—have been surveyed or visited
by divers.
Fishing trawlers snag on sunken ships, sonar readings pick
them up, historical records tell us where they should be, harbor
dredging operations uncover wrecks that have long been lost below the
seafloor—but there simply isn't enough time and money to explore the
vast majority of them.
The Sweepstakes was built in 1867 as a two-masted schooner in Burlington, Ontario by John Simpson. The ship's length is 36.3m (119ft) and lays just below the surface in Big Tub harbor with a maximum depth of 7m (20ft). The Sweepstakes was damaged off Cove Island, then towed to Big Tub harbor where she sank in 1885. At times, the shipwreck will sit well below the surface of Lake Huron and then when the lake becomes shallower, sections of the Sweepstakes rise up out of the water making parts clearly visible. Throughout Fathom Five National Marine Park, there are 22 shipwrecks and many people come here to snorkel and scuba dive in these pristine waters.
Daunting Task
James
Delgado, the Director of Maritime Heritage at the National Oceanic and
Atmospheric Administration (NOAA), says that there are an estimated
4,300 shipwrecks within NOAA's 14 National Marine Sanctuaries.
Of these,
432 have been dived on and surveyed.
And these are shipwrecks within a mapped area set aside for preservation.
"There
are laws and regulations directing NOAA to find what lies in those
waters and assess it," Delgado said in an email.
Similar to other marine
preservation organizations around the world, NOAA is not only devoted
to discovering what the ships are, but also how their presence
might affect the ecology of the marine environments they lie within.
Outside of marine sanctuaries, there isn't as much of an incentive.
Most
shipwrecks are documented for a much simpler reason: to avoid
collisions or other incidents. NOAA's Office of Coast Survey maintains a
database
of about 20,000 ships that is available to the public, primarily for
the benefit of navigators and researchers.
The information for that
database comes from two organizations within NOAA, the Electronic
Navigational Charts (ENC) and the Automated Wrecks and Obstructions
Information System (AWOIS).
Still,
it's difficult to pinpoint exactly where a shipwreck is on the ocean
floor.
The database lists some limitations, including that it "contains
wreck features from two different sources that were created for
different purposes, and there is not a perfect match of features from
either source. The same wreck may be found in both the ENC wrecks and
AWOIS wrecks layers, although the positions may not necessarily agree."
And that
doesn't include the historical and cultural value of excavating
shipwreck sites.
So why don't we explore more of them?
For
one thing, it's hard to know what's worth the time.
Diving operations
can cost millions of dollars, and before we go down there, we have no
idea what the ship is, what it was carrying, and what condition the
cargo is in. In some cases, we are not even 100 percent sure that the
identified object is a ship at all.
"Not many people follow up on a
target to determine if it is a wreck, and if so what type it is, and
then if possible, which ship it is," says Delgado.
It
is possible, however, that the situation will improve.
As Delgado
points out, 90 to 95 percent of the sea floor itself remains unexplored.
There are a number of efforts to change that, such as the Ocean Discovery XPrize
that is offering $7 million in prize money for private teams that build
an autonomous underwater vehicle (AUV) and create a bathymetric map
(like a topographic map, but of the sea floor).
The Schmidt Ocean Institute,
founded by former Google CEO Eric Schmidt, maintains a 272-foot vessel
outfitted with modern oceanographic equipment that scientists can apply
to use for various research expeditions.
The
good news, for shipwrecks explorers at least, is that the majority of
shipwrecks are actually near the coast, with a large percentage of
incidents occurring in and around the entryways to ports and harbors.
"Some harbors are tough to enter, like Oregon's Columbia River Bar, or
leave, like San Francisco's Golden Gate and Bar, due to shifting winds,
shifting sands, fog, storms, or strong tides," says Delgado.
"But also
for the same reason that most auto accidents seem to happen within a
mile of home, and there are many accidents coming in and out of parking
lots, people seem to be less cautious or more aggressive."
But even with advancing AUV technologies and efforts to
map more of the ocean floor, many shipwrecks are likely to remain
unexplored until they are buried below the sands or decay beyond the
point of recognition.