Saturday, July 19, 2014
Friday, July 18, 2014
Climate data from air, land, sea and ice in 2013 reflect trends of a warming planet

Increases in temperature, sea level and CO2 observed; Southern Hemisphere warmth and Super Typhoon Haiyan among year’s most notable events
In 2013, the vast majority of worldwide climate indicators—greenhouse gases, sea levels, global temperatures, etc.—continued to reflect trends of a warmer planet, according to the indicators assessed in the State of the Climate in 2013 report, released online today by the American Meteorological Society.
Scientists from NOAA’s National Climatic Data Center in Asheville, N.C., served as the lead editors of the report, which was compiled by 425 scientists from 57 countries around the world (highlights, visuals, full report).
It provides a detailed update on global climate indicators, notable weather events, and other data collected by environmental monitoring stations and instruments on air, land, sea, and ice.
“These findings reinforce what scientists for decades have observed: that our planet is becoming a warmer place,” said NOAA Administrator Kathryn Sullivan, Ph.D. “This report provides the foundational information we need to develop tools and services for communities, business, and nations to prepare for, and build resilience to, the impacts of climate change.”
The report uses dozens of climate indicators to track patterns, changes, and trends of the global climate system, including greenhouse gases; temperatures throughout the atmosphere, ocean, and land; cloud cover; sea level; ocean salinity; sea ice extent; and snow cover.
These indicators often reflect many thousands of measurements from multiple independent datasets.
The report also details cases of unusual and extreme regional events, such as Super Typhoon Haiyan, which devastated portions of Southeast Asia in November 2013.
Highlights:

Atmospheric carbon dioxide concentrations in parts per million for the past 800,000 years, with the 2013 annual average concentration as a dashed line.
The peaks and valleys in carbon dioxide levels follow the coming and going of ice ages (low CO2) and warmer interglacials (higher CO2).
Graph by NOAA Climate.gov, based on EPICA Dome C data (Lüthi, D., et al., 2008) provided by NOAA NCDC Paleoclimatology Program.
- Greenhouse gases continued to climb: Major greenhouse gas concentrations, including carbon dioxide (CO2), methane and nitrous oxide, continued to rise during 2013, once again reaching historic high values. Atmospheric CO2 concentrations increased by 2.8 ppm in 2013, reaching a global average of 395.3 ppm for the year. At the Mauna Loa Observatory in Hawaii, the daily concentration of CO2 exceeded 400 ppm on May 9 for the first time since measurements began at the site in 1958. This milestone follows observational sites in the Arctic that observed this CO2 threshold of 400 ppm in spring 2012.

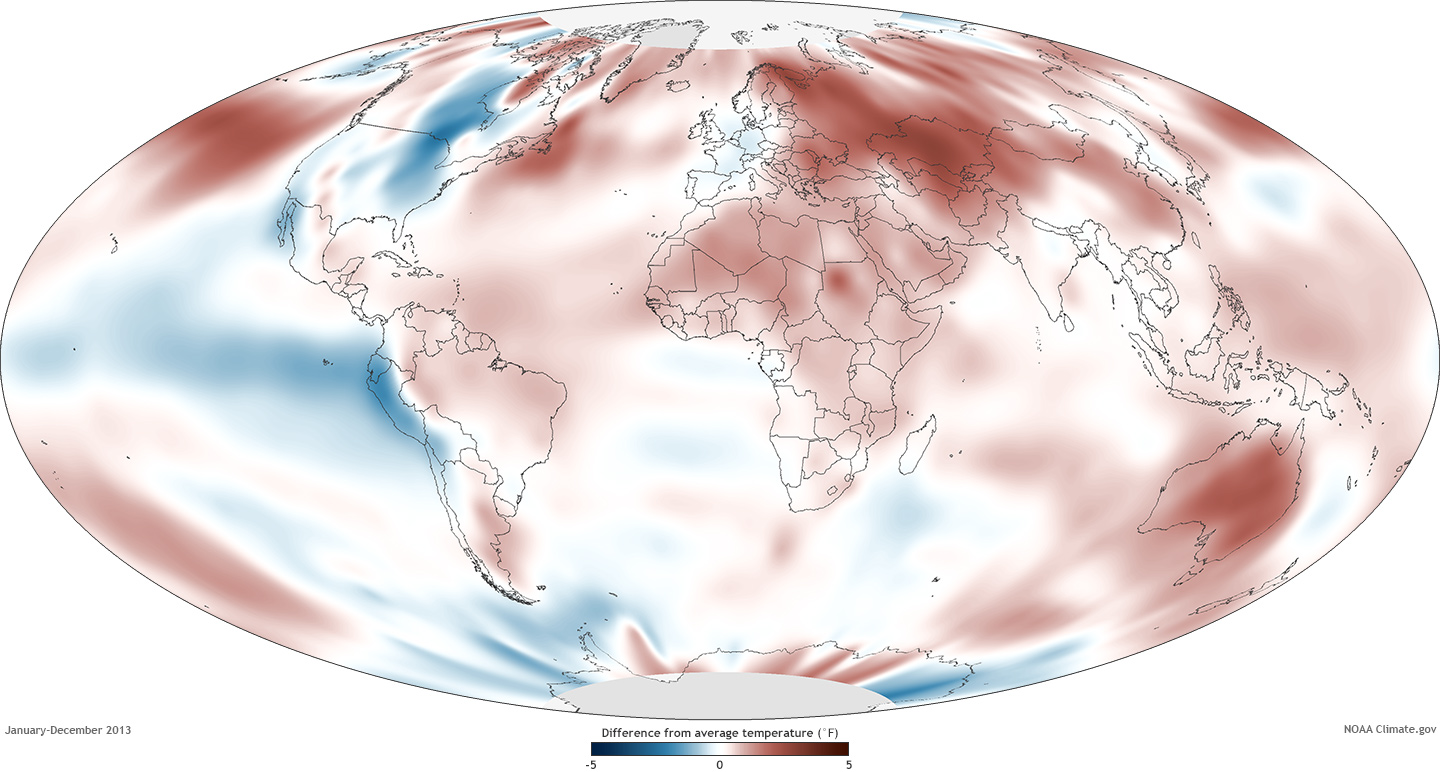
Surface temperatures in 2013 compared to the 1981-2010 average. NOAA map by Dan Pisut, NOAA Environmental Visualization Lab, based on Merged Land and Ocean Surface Temperature data from the National Climatic Data Center. Adapted from Plate 2.1(c) in State of the Climate in 2013.
- Warm temperature trends continued near the Earth’s surface: Four major independent datasets show 2013 was among the warmest years on record, ranking between second and sixth depending upon the dataset used. In the Southern Hemisphere, Australia observed its warmest year on record, while Argentina had its second warmest and New Zealand its third warmest.
Annual sea surface temperature compared to the 1981-2010 average from a variety of sources. Despite year to year variability, all the years in the past decade have been warmer than average.
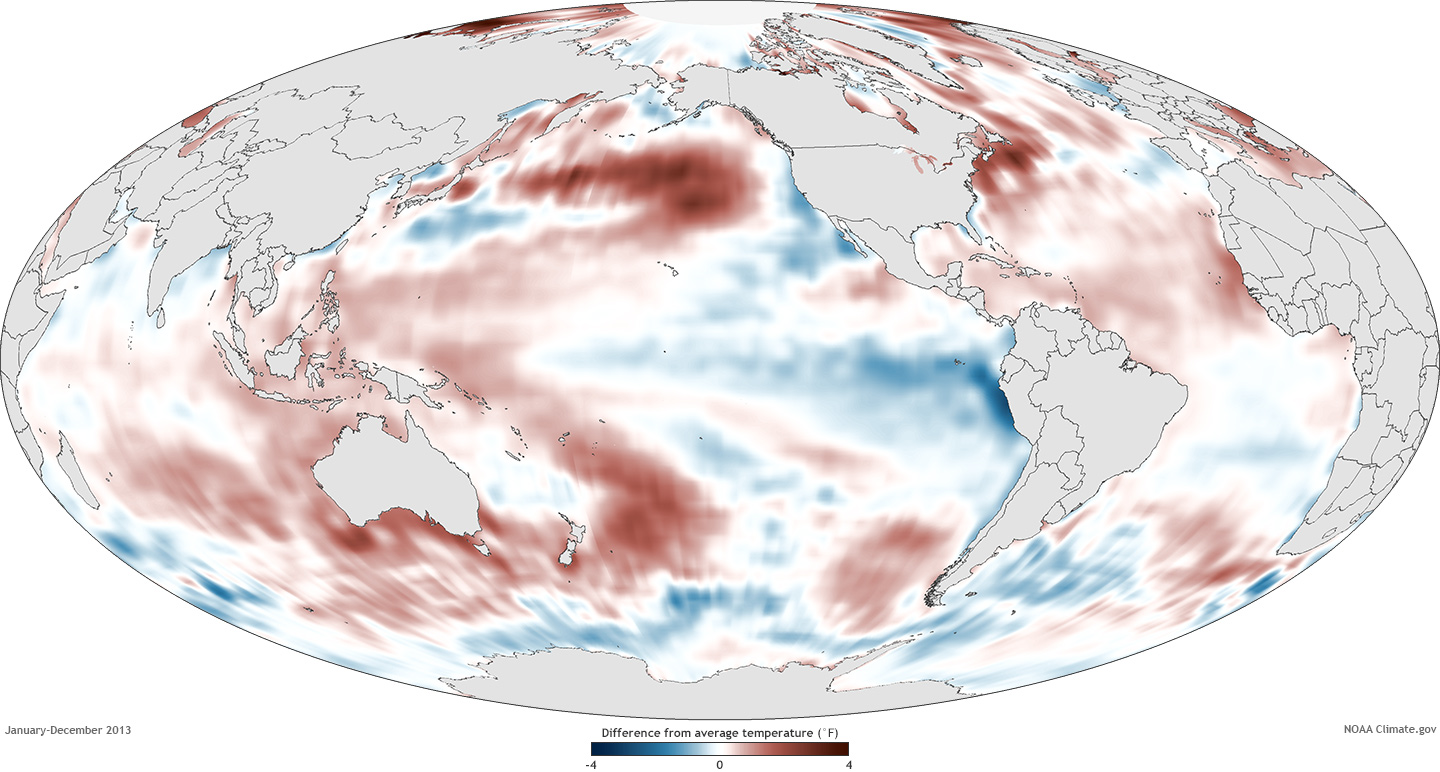
Sea surface temperature in 2013 compared to the 1981-2010 average.
The dark red and blue areas reveal areas of the global ocean that were up to 4º Fahrenheit warmer or cooler than average.
Map by Dan Pisut, based on NOAA OISST data. Adapted from Figure 3.1(a), in State of the Climate in 2013.
- Sea surface temperatures increased: Four independent datasets indicate that the globally averaged sea surface temperature for 2013 was among the 10 warmest on record. El Niño Southern Oscillation (ENSO)-neutral conditions in the eastern central Pacific Ocean and a negative Pacific decadal oscillation pattern in the North Pacific. The North Pacific was record warm for 2013.

Global sea level from 1993 through 2013 compared to 1993-2012 average, based on AVISO data. Graph adapted from Plate 1.1, panel v, in State of the Climate in 2013.
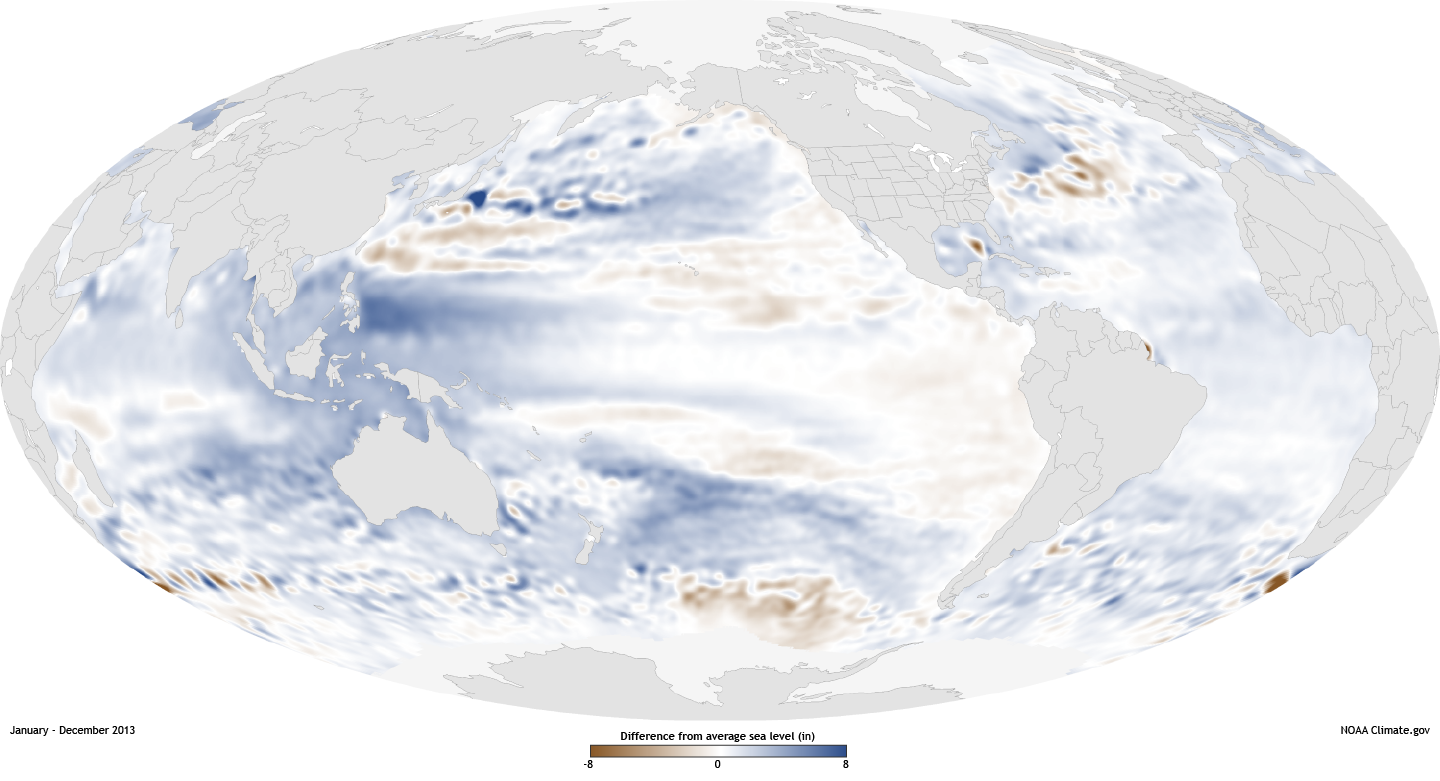
Places where sea level rose up to 8 inches higher than the 1993-2010 average are dark blue, average levels are white, and places where sea level fell below average are brown.
Map by NOAA Climate.gov, based on AVISO data provided by Mark Merrifield.
Adapted from Figure 3.28(a) in State of the Climate in 2013.
- Sea level continued to rise: Global mean sea level continued to rise during 2013, on pace with a trend of 3.2 ± 0.4 mm per year over the past two decades.

Difference in ice extents for each year’s maximum (March, purple line) and minimum (September, blue line) relative to the 1981-2010 average.
Graph adapted from Figure 5.13 in State of the Climate in 2013.
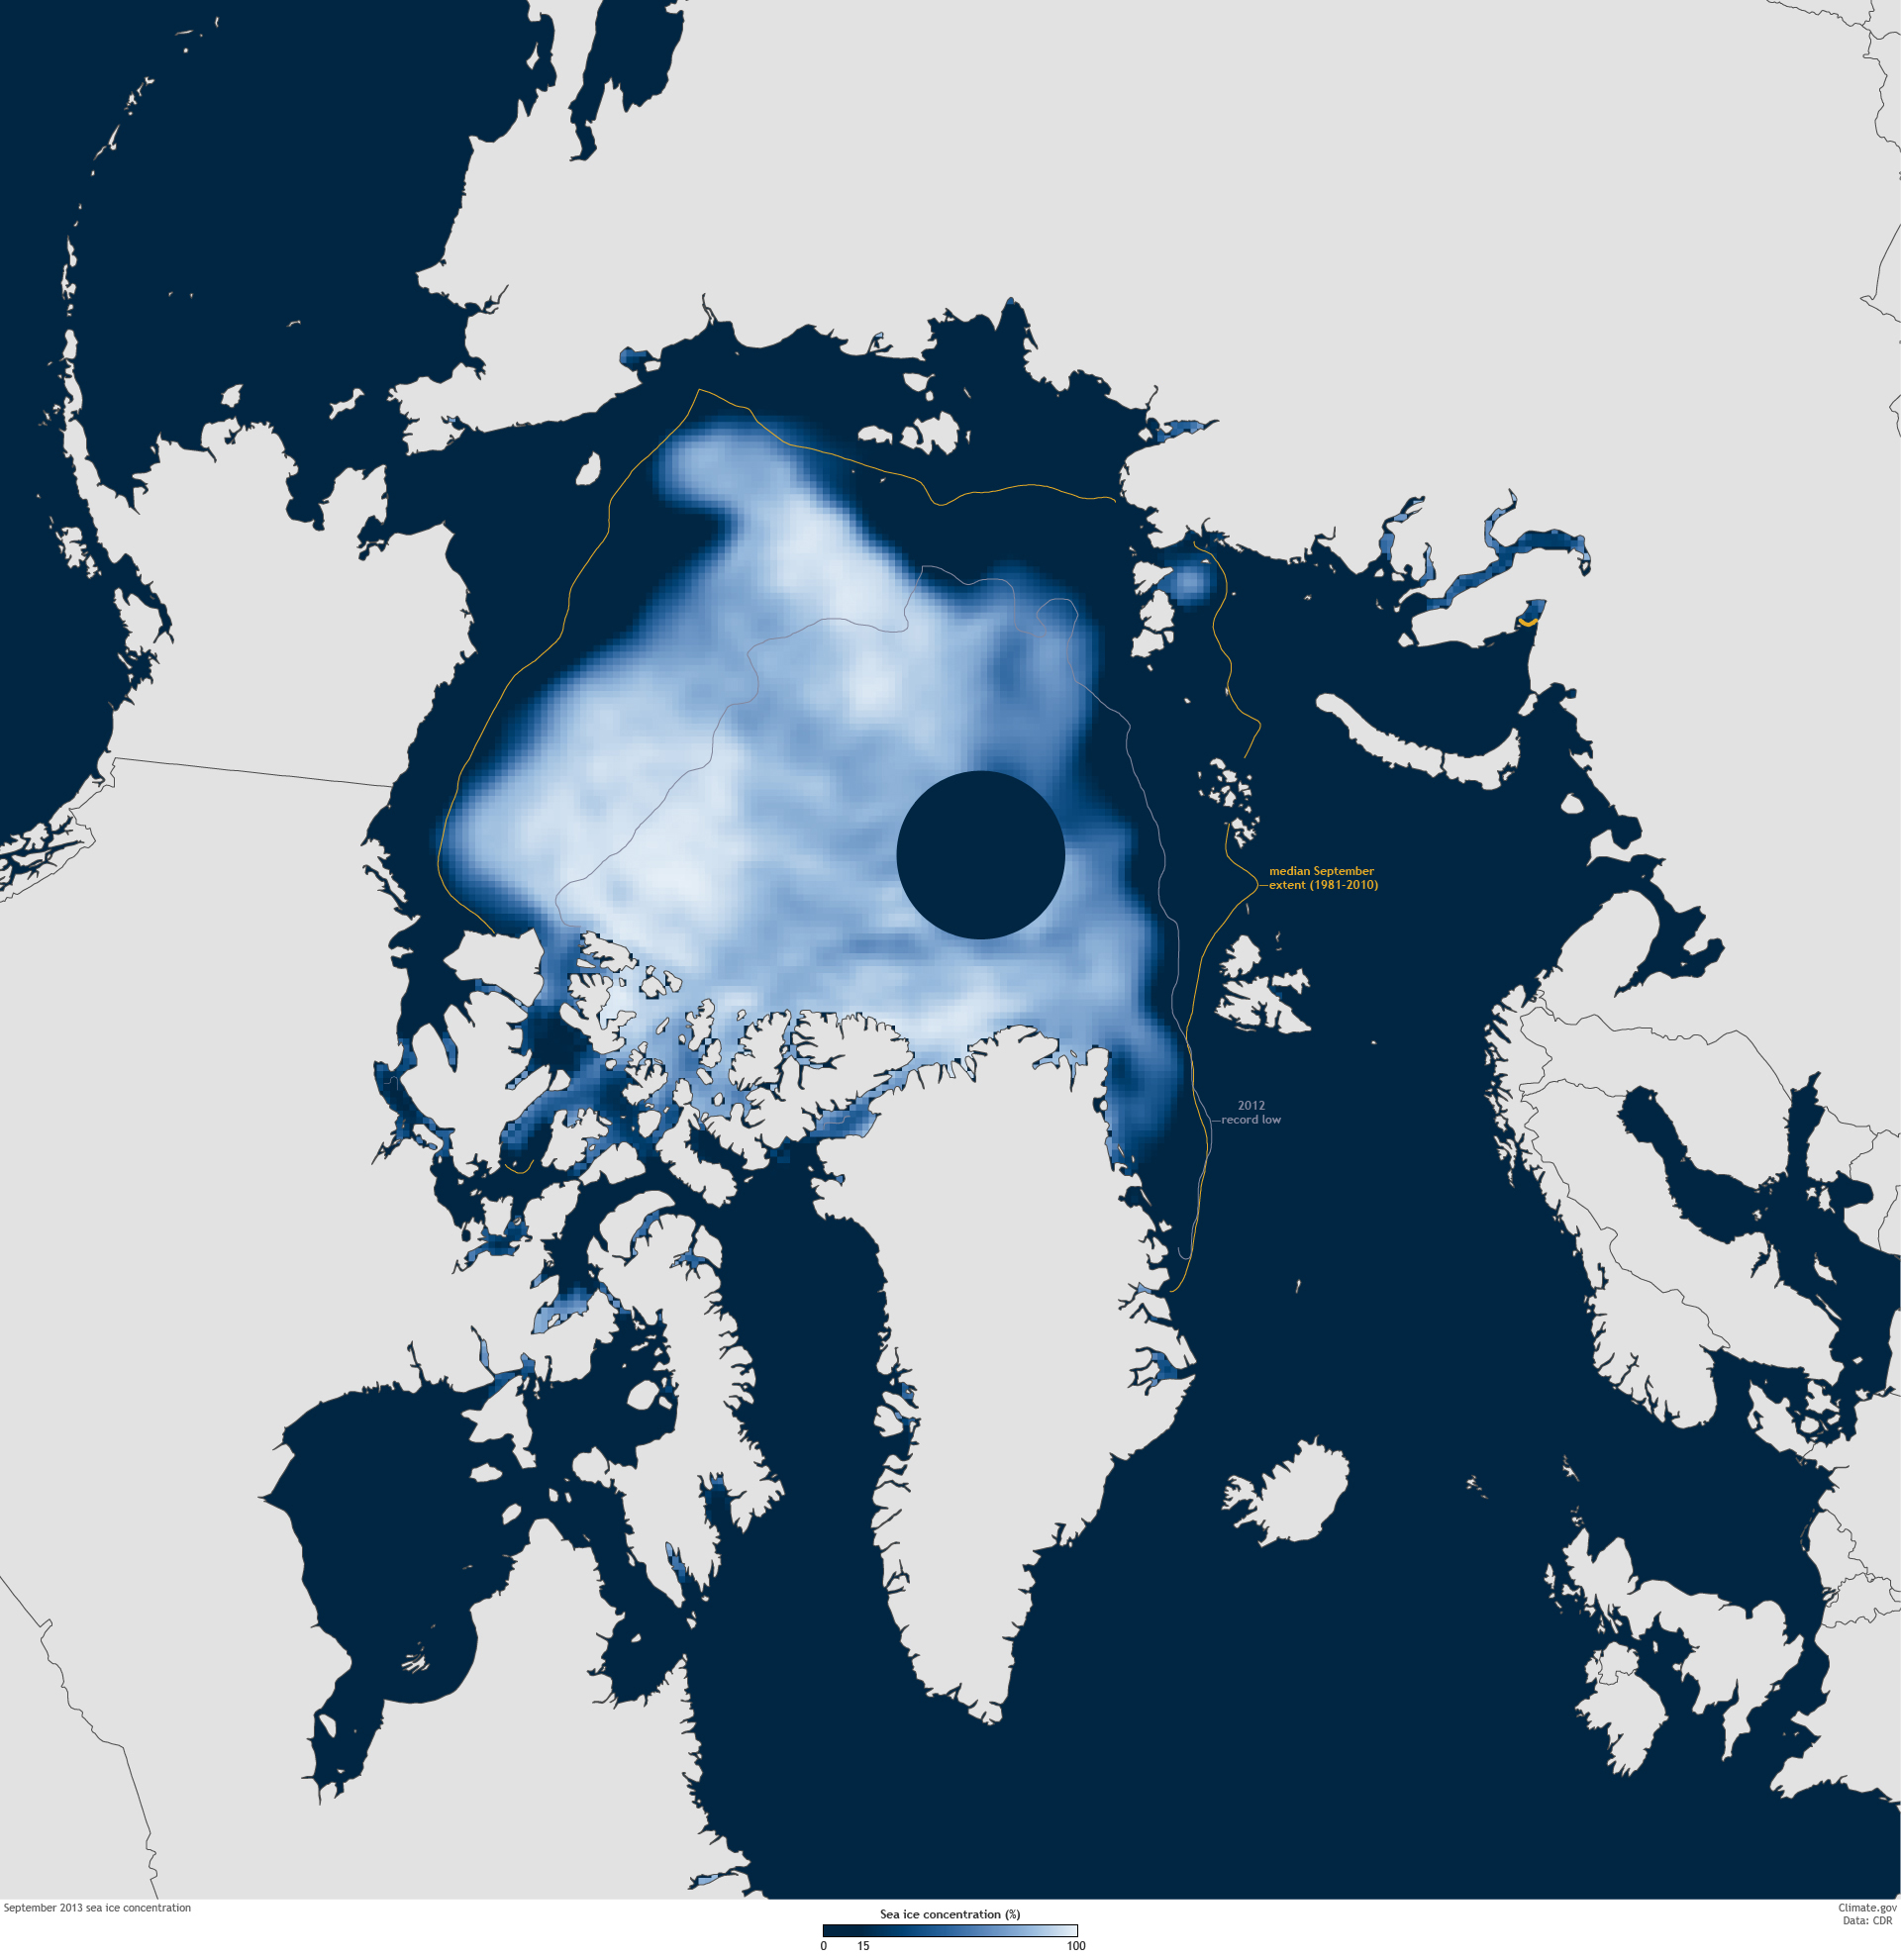
Sea ice concentration in September 2013 compared to the median extent from 1981-2010 (gold line) and the 2012 record low (gray line).
Map by NOAA Climate.gov, based on data provided by the National Snow and Ice Data Center. Adapted from Figure 5.12(b) in State of the Climate in 2013.
- The Arctic continued to warm; sea ice extent remained low:
The Arctic observed its seventh warmest year since records began in
the early 20th century. Record high temperatures were measured at
20-meter depth at permafrost stations in Alaska. Arctic sea ice extent
was the sixth lowest since satellite observations began in 1979. All
seven lowest sea ice extents on record have occurred in the past seven
years.
- Antarctic sea ice extent reached record high for second year in a row; South Pole station set record high temperature: The Antarctic maximum sea ice extent reached a record high of 7.56 million square miles on October 1. This is 0.7 percent higher than the previous record high extent of 7.51 million square miles that occurred in 2012 and 8.6 percent higher than the record low maximum sea ice extent of 6.96 million square miles that occurred in 1986. Near the end of the year, the South Pole had its highest annual temperature since records began in 1957.
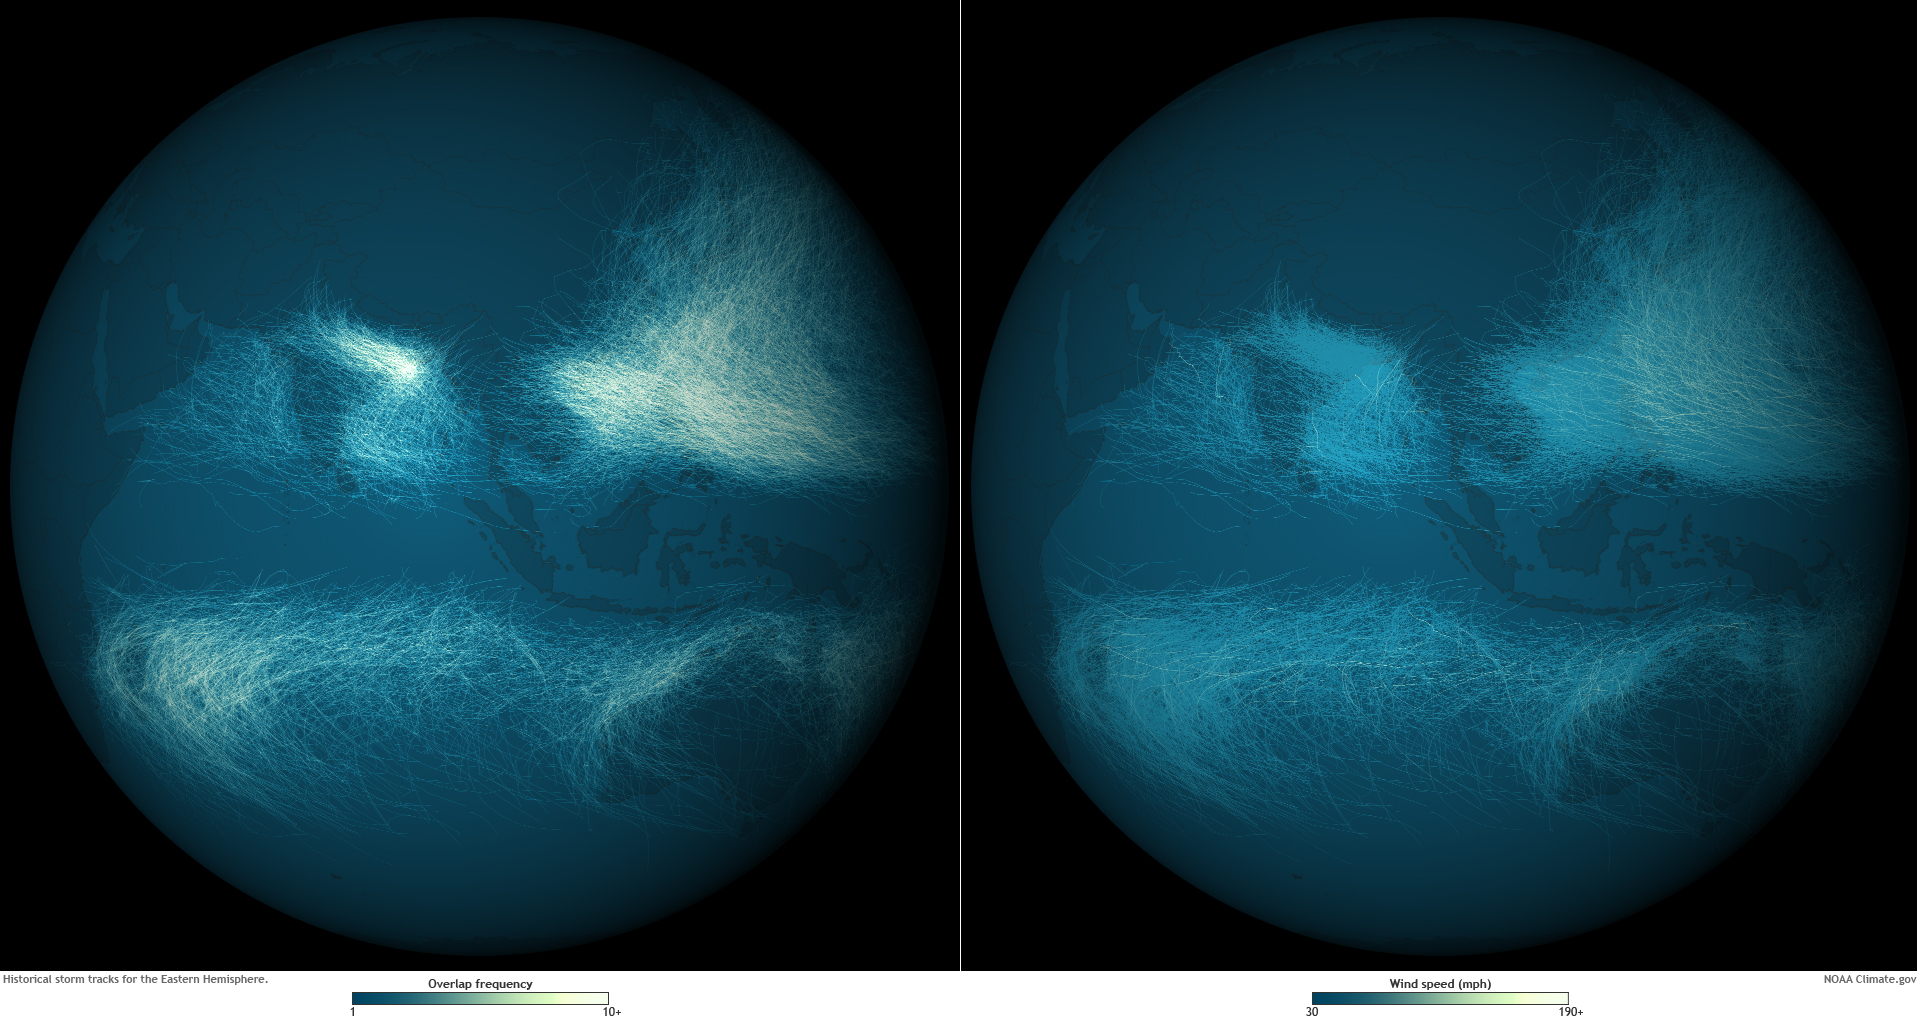
Tracks for the thousands of Eastern Hemisphere tropical cyclones documented in the International Best Track Archive for Climate Stewardship database for 1842-2012.
Rarely do storms form within ~5° of the equator.
Map by Dan Pisut, NOAA Environmental Visualization Lab.
- Tropical cyclones near average overall / Historic Super Typhoon: The number of tropical cyclones during 2013 was slightly above average, with a total of 94 storms, in comparison to the 1981-2010 average of 89. The North Atlantic Basin had its quietest season since 1994. However, in the Western North Pacific Basin, Super Typhoon Haiyan – the deadliest cyclone of 2013 – had the highest wind speed ever assigned to a tropical cyclone, with one-minute sustained winds estimated to be 196 miles per hour.
The journal makes the full report openly available online.
"State of the Climate is vital to documenting the world's climate," said Dr. Keith Seitter, AMS Executive Director. "AMS members in all parts of the world contribute to this NOAA-led effort to give the public a detailed scientific snapshot of what's happening in our world and builds on prior reports we've published."
NOAA’s mission is to understand and predict changes in the Earth's environment, from the depths of the ocean to the surface of the sun, and to conserve and manage our coastal and marine resources.
Thursday, July 17, 2014
Google Maps Street View of Japonese Islands
Island of Hashima on Google Maps
From Google LatLon
Do you remember the villain's secret island hideout in the latest James Bond movie Skyfall, the one that looked like a decaying industrial wasteland?
That fictional location was actually based on a real place — the island of Hashima off the coast of Nagasaki Prefecture in Japan.
Due to its unique flat shape, the island is most widely known in Japan by its nickname Gunkanjima — aka "Battleship Island."

Starting in the late 19th century, Hashima served as a coal mining facility and residential complex for 5,000 people.
Hashima island with the Marine GeoGarage (NGA charts)
Starting in the late 19th century, Hashima served as a coal mining facility and residential complex for 5,000 people.
After the decline of coal mining in the 1970s, however, the island became completely abandoned, only opening up again to tourists in 2009.
Hashima has transformed into an eerie tourist destination where you can see a once thriving town decaying and totally devoid of life.
Apparently, Hashima's buildings are deteriorating so rapidly that you can hear parts of the concrete collapse as the wind blows from the ocean.

While we can't replicate those unearthly sounds on Google Maps, we can now give you 360° panoramas of the Hashima with today's launch of Street View imagery for the island.
Thanks to assistance from Nagasaki City, we were able to collect imagery with the Google Trekker beyond the cordoned-off areas for tourists and into off-limits paths around the island.
We also used our Business Photos technology to let you peek into the abandoned buildings, complete with ancient black-and-white TVs and discarded soda bottles.
Chichi-Jima island on Google Maps
Wednesday, July 16, 2014
Delicate operation to refloat Costa Concordia begins in Italy
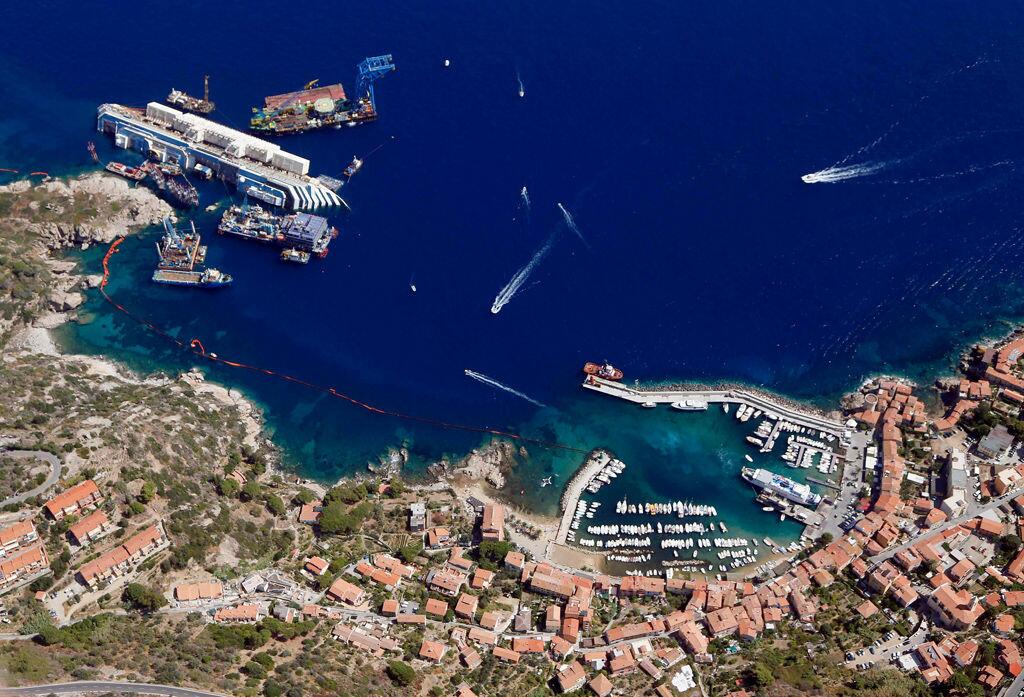
Isola del Giglio
From NYTimes by Gaia Pianigiani
Engineers started refloating the deformed hull of the cruise liner Costa Concordia on Monday, a crucial step before its removal from the Tuscan island where it ran aground 30 months ago, taking 32 lives.
“It’s a paramount engineering attempt not just for Italy, but for the whole world,” said Emilio Campana, the director of the research office for naval and maritime engineering at Italy’s National Research Council.
“The first risk is that the vessel breaks apart as they lift it. Its structure is damaged and warped. It’s impossible to calculate exactly how it will react.”

The authorities said Monday that the first phase of the undertaking had been successful and that the ship was afloat for the first time since it hit a reef and capsized in early 2012, setting the stage for an operation unparalleled in the annals of marine salvage.
A timelapse video filmed on Monday (July 14) shows the first day of the historic salvage operation to move the wreck of the Costa Concordia.
Filmed from the start of the operation on Monday morning until nightfall, the video clearly picks up the small zigzag movements showing that the 114,500 tonne Concordia was moving away from the coastline of Giglio Island.
Filmed from the start of the operation on Monday morning until nightfall, the video clearly picks up the small zigzag movements showing that the 114,500 tonne Concordia was moving away from the coastline of Giglio Island.
On Monday morning, the Italian authorities blocked the water and airspace around the island of Giglio, to ensure safety and prevent any interference with the refloating operation.
In the first six or seven hours of the operation, the wreck will be lifted about seven feet using a pneumatic system, detaching the hull from a platform built nearly 100 feet underwater.
The ship has been resting there since September, when engineers managed to right the ship in a spectacular 19-hour operation.

Nick Sloan, senior salvage master
Nick Sloane, the senior salvage master for Titan Salvage, the American company in charge of the operation, said Monday that he was relieved the weather was cooperating after a night of light rain.
“Nervous? A little,” Mr. Sloane said to reporters on Giglio, according to the Italian news agency ANSA.
“Today we’ll find out if the calculations are right, or at least how distant they are from our predictions.”


Over the past few months, as the cost of the removal has swollen from the $300 million initially budgeted to more than $1 billion, workers have fitted 30 huge steel stabilizing containers, known as sponsons, on both sides of the Concordia that will function as floats.
As pneumatic devices gradually empty the sponsons of water and fill them with air on both sides, the hull will be lifted upward.

Costa Concordia shipwreck refloated
Over the next week, the ship will be raised deck by deck until only 50 feet remains submerged.
At that point, the Costa Concordia should be ready to be towed away by tugboats — two at the bow and two at the stern — for its final cruise of nearly 200 nautical miles to the port of Genoa.
“This operation will end only after the ship has been transported to Genoa,” warned Gian Luca Galletti, Italy’s environment minister. “We can’t let our guard down.”

ADUS DeepOcean survey
An Italian official said on Sunday that once the ship is lifted, it will be thoroughly searched for the body of an Indian waiter, the only one of the 32 known fatalities from the accident that has not been recovered.
Further complicating the salvage operation is the potential for environmental damage, particularly the leakage of fuel oil.
“Of course we are worried about the refloating operation, as it is not entirely clear how possible leaks of the Concordia’s toxic liquids will be handled,” Alessandro Giannì, campaign director at Greenpeace Italy, said.
“But the weather conditions during the navigation are also a concern.”
After the ship leaves the Tuscan island, workers will begin the environmental recovery phase, which should last several months.
Under the current plan, salvage workers will attempt to clean the sea floor and replant the rare marine flora that attracted recreational divers.
It was still unclear whether the underwater platform would be left on the island’s sea bottom and used as a diving facility or would be removed.
The ship’s captain, Francesco Schettino, is facing trial on multiple charges of manslaughter, causing a shipwreck and abandoning the vessel before everyone had disembarked, and in recent months hundreds of witnesses have been giving testimony in court.
A company official and four crew members have pleaded guilty to reduced sentences.
Links :
- The Parbuckling Project : Concordia wreck removal project informative website
- Live Concordia
- GeoGraage blog : Stricken Costa Concordia ship set upright in Italy / Costa Concordia salvage begins: Will it stay in one piece during righting / Stunning images of Costa Concordia captured by drone reveal the work underway to salvage hulking wreck / Costa Concordia: marine paradise threatened by cruise ship
Tuesday, July 15, 2014
Polar Vortex in summer? Not exactly, experts say

A cold front blowing across the United States this week could bring temperature drops of 20 degrees and trigger huge thunderstorms in some areas.
Credit: Climate Reanalyzer/Climate Change Institute, University of Maine
Credit: Climate Reanalyzer/Climate Change Institute, University of Maine
From LiveSciences by Kelly Dickerson
A blast of cold air that blew in from the Gulf of Alaska and swept across the Great Lakes is now making its way south.
Headlines warn that the cold front could herald a return of the "polar vortex," but experts are saying otherwise.
Those who endured the winter's Polar Vortex may be in for a repeat performance of sorts.
Polar vortexes typically develop around the North Pole during most winters.
They form in a pattern similar to that of tropical hurricanes, except the winds spinning around the calm center of a polar vortex are freezing cold.
The Polar Vortex explained in 2 minutes
In January, a polar vortex blasted the northern United States with frigid air and caused bitterly cold temperatures farther south than normal.
This week's cold front is following a similar pattern, where cold air from the Arctic is sweeping down south.

The Suomi-NPP satellite captured this image of the super typhoon churning toward Okinawa and southern Japan on July 7, 2014, at 4:55 Universal Time (1:55 p.m. local time on July 8).
Credit: NASA Earth Observatory
Credit: NASA Earth Observatory
Typhoon Neoguri, which battered southern Japan with strong wind and rains last week, likely set off the wacky weather pattern that is interfering with the jet stream over the Midwest.
TheMidwestern jet stream is a strip of air that forms when cool air masses from the north meet warm air masses from the south.
An unusual amount of cold air can drive the jet stream further south and trigger thunderstorms.
Polar Vortex to make July comeback
By this Wednesday (July 16), the unusual weather could turn what is normally one of the hottest weeks of the summer into a pleasant autumnlike week in parts of the western United States and Northern Plains, where highs may be about 65 to 70 degrees Fahrenheit (18 to 21 degrees Celsius).
The cold front will likely deal the Northeast only a glancing blow, and temperatures in this region may dip about 10 degrees below average.
Strictly speaking, the cold front is not a polar vortex, according to experts.
The impending cold front is called a "high meridional event," but there are some similarities.
"It's the same general circulation pattern, but the effects are extremely different," Bob Oravec, a senior forecaster at the National Oceanic and Atmosphere Administration (NOAA) Weather Prediction Center, told Live Science.
"In the summer, if you go outside in 20 degrees (Fahrenheit) below normal weather, you won't really care, but in the winter, the effects were significantly different because it was already so cold."

NOAA is predicting below-normal temperatures for a huge swath of the East Coast this week.
The cool air is expected to roll through tomorrow (July 15), and should keep temperatures between 70 and 80 degrees Fahrenheit (21 to 27 degrees Celsius) on the East Coast.
The unusual summer chill could also trigger some extreme and dangerous weather in the United States, experts say.
The cold temperatures will likely send thunderstorms sweeping across much of the country this week.
Hail and tornadoes are possible in southern New England down to the mid-Atlantic.
In the West, severe lightning, flash floods and dust storms are possible, according to the Weather Channel.
Despite the wild weather in store for this week, Oravec said the cold front could bring some significant benefits.
The predicted downpour may finally quench the severe drought in the western United States.
While parts of the country may welcome a change from the sweltering July heat, temperatures are expected to climb back up soon.
"No weather pattern lasts forever, and we'll likely see temperatures return to normal by the weekend," Oravec said.
Monday, July 14, 2014
Superyachtcup 2014
The Superyacht Cup in Palma de Mallorca at the end of June 2014 was a fantastic event for all who participated.
However we tried to convey the splendid sight of seeing 26 of the world's great sailing yachts in in full flow, words and photographs cannot do justice to the spectacle, video can, though, which is why we would love the share this dramatic footage of the five beauties from the Claasen stable that performed so well in Palma. (see corporate video)
The first stunning and timelessly lined F-class yacht Firefly was launched in May 2011, the first in an exciting new series of F-class one designs.
Combining the spirit of the J-class with the performance of a maxi racer, the design brief for these race classics called for the smallest sized vessel that could challenge a J on the water in both light and heavy winds.
Combining the spirit of the J-class with the performance of a maxi racer, the design brief for these race classics called for the smallest sized vessel that could challenge a J on the water in both light and heavy winds.
Take a couple of minutes out of your day and imagine being onboard Atalante, Heartbeat, Lionheart, Drumfire or Firefly.
You'll be glad you did!
Links :
- Vimeo : Superyacht Cup Palma 2014
Sunday, July 13, 2014
Massive school of anchovies looks like oil slick
An aggregation of anchovy amassed near Scripps Pier
at Scripps
Institution of Oceanography, UC San Diego in La Jolla, Calif. on July 8,
2014.
Footage from Scripps Pier by Scripps staff and underwater
by
Scripps graduate students Julia Fiedler, Sean Crosby and Bonnie Ludka.
From Grindtv by David Strege
Appearance of baitfish near shore off La Jolla amazes marine experts, who can’t recall seeing such a sight in more than 30 years
From a distance, the ocean near Scripps Pier off La Jolla, California, appeared to be the site of a catastrophic oil spill on Tuesday.
Initially, Robert Monroe thought it was a red tide.

Massive school of anchovies appears to be an oil slick.
Photo from Scripps Institution of Oceanography
But it was neither.
Making a long, dark cloud in the shallow water off San Diego County was a massive school of Northern anchovies the likes of which has not been seen hugging the coast in more than 30 years.
Monroe, a communications officer with Scripps Institution of Oceanography at UC San Diego, saw the unusual sight and raced to the pier with a GoPro camera, according to the Los Angeles Times.
“It was remarkable,” Monroe told the Los Angeles Times. “From a distance it looked like an oil slick and you think, ‘What happened?’ and then you get up close and it’s amazing.
“It’s like watching the motion of a lava lamp.”

A massive school of anchovies initially looked like a red tide to Robert Monroe of Scripps.
On its Facebook page, Scripps said, “Even veteran fisheries oceanographers were amazed. This is not an oil slick off Scripps Pier. It’s a school of anchovy no one can recall seeing this close to shore in 30 years.”
Phil Hastings, a marine biologist professor and curator of the Scripps Marine Vertebrate Collection, told City News Service the millions of anchovies were first spotted Monday by lifeguards, but they were mostly dissipated by Tuesday evening.
“Leopard sharks [one is seen in the video] were feeding on them this morning,” Hastings told CNS.
Hastings said the water at the pier was 74 degrees and “pretty much the warmest water the species has been reported in.”
The Scripps Marine Vertebrate Collection collected specimens so they could be studied, but Hastings told CNS that he doubted the mystery of the baitfish’s appearance along the shore would ever be solved.
Links :
Subscribe to:
Posts (Atom)