Saturday, July 5, 2025

Hidden Antarctic lakes could supercharge sea level rise

The following animation helps to explain the dynamics of subglacial water exchange and what it looks like from space.
Starting from an artist's concept of the Antarctic surface we move down to a cross section of the ice sheet with lakes hidden deep beneath.
As pressure is exerted on one lake, the water in it is forced to an adjacent lake.
This water movement results in elevation changes at the surface over both lakes, detectable by NASA satellites.
The camera then moves to a 'top-down' view of a system of these hidden lakes and streams before dissolving into observed satellite data.
Credit: NASA/Goddard Space Flight Center Conceptual Image Lab
 
From ScienceNews by Nikk Ogasa

Subglacial water may boost sea levels by over 2 meters by 2300

Beneath the great, white expanse of the Antarctic Ice Sheet, a mysterious realm of streams and lakes lies out of sight.
Much about this hidden water world remains poorly understood.
But a new study suggests that if scientists continue to overlook it, they might greatly underestimate global sea level rise.

Factoring this subglacial water into computer simulations could boost projections of sea level rise over the next two centuries by about two meters, researchers report April 7 in Nature Communications.
For context, scientists estimate that climate warming has raised sea levels by about 0.2 meters over the last century.

“This hidden water beneath Antarctica plays a much more significant role than we thought,” says Chen Zhao, a glaciologist at the University of Tasmania in Hobart, Australia.
Policymakers are basing their decisions on current projections of sea level rise, she says, “but what if we largely underestimated it?”

While the Antarctic Ice Sheet may be frozen, it is not static.
The ice sheet deforms under its own weight, and in some places its frigid base slides along the ground like a sled on snow.
This process, known as basal sliding, accounts for most of the movement of the fastest Antarctic glaciers flowing into the ocean.
Understanding basal sliding is crucial for estimating future sea level rise.


The Antarctic Ice Sheet holds around 90 percent of all ice on Earth.
But human-caused climate change is driving it to shed an average of 150 billion metric tons of ice each year, raising sea levels around the world.
 
Researchers already knew that subglacial water can boost a glacier’s basal sliding speed.
Similar to how an air hockey table effuses a thin cushion of air for a puck to glide over, the pressure exerted by subglacial water counters some of the overlying glacier’s weight, easing its flow toward the sea. 
“It’s sort of lubricating the ground for the ice,” says glaciologist Mathieu Morlighem of Dartmouth College, who was not involved in the study.

But it remains uncertain just how much basal water enhances glacier flow and sea level rise.
Many Antarctic Ice Sheet computer simulations — or models — that predict sea level rise ignore the effects of subglacial water and are probably underestimating its impact, Zhao says.

She and her colleagues simulated the Antarctic Ice Sheet’s evolution as it flowed over channels and lakes.
Because so little is known about the distribution of the water beneath the ice sheet, they tested different ways of simulating the pressure it exerts.

For instance, in one test, the researchers assumed the water under the ice sheet could flow essentially unhindered into the ocean.
In others, they factored in the topography beneath the Ice Sheet, considering places where water would accumulate to construct a more intricate picture of how pressure was distributed.
And in some tests, the team increased the water pressure near the grounding line, where the ice sheet meets the ocean.

“It makes physical sense,” Morlighem says. 
“They’re making the bed more slippery … as the ice starts to float.”

This increased slipperiness contributed to the most extreme result.
Compared with the standard approach used in current Ice Sheet models, one simulation with a slippery grounding line generated 2.2 additional meters of sea level rise by 2300.

“It’s not crazy at all,” Morlighem says. Those two meters represent only 4 percent of what the Antarctic Ice Sheet — which contains about 90 percent of all ice on Earth — could deliver if it all melted, he explains. The rest of the tests yielded a wide range of contributions to sea level rise.

Determining exactly how much subglacial water will contribute to future sea level rise will require further investigation into what lies beneath the Antarctic Ice Sheet. 
“Without knowing what’s under the ice, we have to make assumptions in our simulations that can have big impacts on the predictions,” Zhao says.

Friday, July 4, 2025

Ocean model simulations shed light on long-term tritium distribution in released Fukushima water

 Using a global ocean model, researchers from the Institute of Industrial Science, The University of Tokyo, and the Institute of Environmental Radioactivity, Fukushima University, found that short- and long-term contribution of treated water released from the Fukushima Daiichi Nuclear Power Plant on oceanic tritium concentration beyond the vicinity of the discharge site is negligible, even in climate change scenarios. 
Credit: Institute of Industrial Science, by University of Tokyo

From Phys by Stephanie Baum, reviewed by Robert Egan

Operators have pumped water to cool the nuclear reactors at the Fukushima Daiichi Nuclear Power Plant (FDNPP) since the accident in 2011 and treated this cooling water with the Advanced Liquid Processing System (ALPS), which is a state-of-the-art purification system that removes radioactive materials, except tritium.

As part of the water molecule, tritium radionuclide, with a half-life of 12.32 years, is very costly and difficult to remove.
The ALPS-treated water was accumulating and stored at the FDNPP site and there is limited space to store this water.
Therefore, in 2021, the Government of Japan announced a policy that included discharging the ALPS-treated water via an approximately one-kilometer-long tunnel into the ocean. Planned releases of the ALPS-treated water diluted with ocean water began in August 2023 and will be completed by 2050.

In a new numerical modeling study, researchers have revealed that the simulated increase in tritium concentration in the Pacific Ocean due to the tritium originating from the ALPS-treated water is about 0.1% or less than the tritium background concentration of 0.03-0.2 Bq/L in the vicinity of the discharge site (within 25 km) and beyond.

This is below detection limits (i.e., so small that the difference due to the presence or absence of ALPS-treated water added to the original seawater cannot be measured), far below the WHO international safety standard of 10,000 Bq/L and consistent with the results of tritium concentration monitoring in seawater conducted in conjunction with the discharge of ALPS-treated water.

The results appear in the Marine Pollution Bulletin.

The researchers are from the Institute of Industrial Science, The University of Tokyo, in collaboration with Fukushima University.

"Since the government's announcement in 2021 to discharge the ALPS-treated water, several studies have investigated the radiological impact of ALPS-treated water discharge on tritium concentration in seawater and marine biota, but there were no global ocean simulations with anthropogenic tritium concentration using a realistic discharge scenario and for a period long enough to consider long-term impacts such as global warming," explains lead author of the study Alexandre Cauquoin.

"In our global ocean simulations, we could investigate how ocean circulation changes due to global warming and representation of fine-scale ocean eddies influence the temporal and spatial distribution of tritium originating from these treated-water releases."

Climate change and eddies in the water currents speed up the tritium movement through the ocean. However, the researchers found that the concentrations of tritium from ALPS-treated water discharge remain similar and very low.

"Our simulations show that the anthropogenic tritium from the discharge of ALPS-treated water would have a negligible impact on the tritium concentration in the ocean, both in the short and long term," says Maksym Gusyev from the Institute of Environmental Radioactivity, Fukushima University.

This study may help in building models to understand how tritium as a tritiated water molecule moves through water vapor and ocean water.
Tritium is useful for tracing the dynamics of the water cycle, so climate models that can simulate tritiated water can help studies of precipitation patterns, atmospheric and oceanic circulation, moisture sources, river catchments, and groundwater flow in the future.

Links :

Thursday, July 3, 2025

Iran made preparations to mine the Strait of Hormuz, US sources say

Oil tankers pass through the Strait of Hormuz, December 21, 2018. 
REUTERS/Hamad I Mohammed//File Photo

From Reuters by Gram Slattery and Phil Stewart in Washington; Additional reporting by Michelle Nichols at the United Nations and Jonathan Saul in London; Editing by Don Durfee and Matthew Lewis


  • Mines loaded last month, raising fears of blockade
  • Mining would have severely harmed global commerce
  • U.S. has not ruled out possibility that loading the mines was a ruse
-The Iranian military loaded naval mines onto vessels in the Persian Gulf last month, a move that intensified concerns in Washington that Tehran was gearing up to blockade the Strait of Hormuz following Israel's strikes on sites across Iran, according to two U.S. officials.
The previously unreported preparations, which were detected by U.S. intelligence, occurred some time after Israel launched its initial missile attack against Iran on June 13, said the officials, who requested anonymity to discuss sensitive intelligence matters.

The loading of the mines - which have not been deployed in the strait - suggests that Tehran may have been serious about closing one of the world's busiest shipping lanes, a move that would have escalated an already-spiraling conflict and severely hobbled global commerce.

About one-fifth of global oil and gas shipments pass through the Strait of Hormuz and a blockage would likely have spiked world energy prices.
Global benchmark oil prices have instead fallen more than 10% since the U.S. strikes on Iran's nuclear facilities, driven in part by relief that the conflict did not trigger significant disruptions in the oil trade.

On June 22, shortly after the U.S. bombed three of Iran's key nuclear sites in a bid to cripple Tehran's nuclear program, Iran's parliament reportedly backed a measure to block the strait.
That decision was not binding, and it was up to Iran's Supreme National Security Council to make a final decision on the closure, Iran's Press TV said at the time. Iran has over the years threatened to close the strait but has never followed through on that threat.
Reuters was not able to determine precisely when during the Israel-Iran air war Tehran loaded the mines, which - if deployed - would have effectively stopped ships from moving through the key thoroughfare.
It is also unclear if the mines have since been unloaded.
The sources did not disclose how the United States determined that the mines had been put on the Iranian vessels, but such intelligence is typically gathered through satellite imagery, clandestine human sources or a combination of both methods.


Iran has in the past threatened to close the Strait of Hormuz but has never followed through on the move, which would restrict trade and impact global oil prices.
But what is the strait and why is it so important for oil?

Asked for comment about Iran's preparations, a White House official said: "Thanks to the President’s brilliant execution of Operation Midnight Hammer, successful campaign against the Houthis, and maximum pressure campaign, the Strait of Hormuz remains open, freedom of navigation has been restored, and Iran has been significantly weakened."
The Pentagon did not immediately respond to a request for comment.
The Iranian mission at the United Nations also did not respond to requests for comment.

KEY THOROUGHFARE

The two officials said the U.S. government has not ruled out the possibility that loading the mines was a ruse. The Iranians could have prepared the mines to convince Washington that Tehran was serious about closing the strait, but without intending to do so, the officials said.
Iran's military could have also simply been making necessary preparations in the event that Iran's leaders gave the order.


A map showing the Strait of Hormuz and Iran is seen in this illustration created on June 22, 2025. REUTERS/Dado Ruvic/Illustration/File Photo
 
The Strait of Hormuz lies between Oman and Iran and links the Persian Gulf with the Gulf of Oman to the south and the Arabian Sea beyond.
It is 21 miles (34 km) wide at its narrowest point, with the shipping lane just 2 miles wide in either direction.
OPEC members Saudi Arabia, the United Arab Emirates, Kuwait and Iraq export most of their crude via the strait, mainly to Asia. Qatar, among the world's biggest liquefied natural gas exporters, sends almost all of its LNG through the strait.

Iran also exports most of its crude through the passage, which in theory limits Tehran's appetite to shut the strait.
But Tehran has nonetheless dedicated significant resources to making sure it can do so if it deems necessary.
As of 2019, Iran maintained more than 5,000 naval mines, which could be rapidly deployed with the help of small, high-speed boats, the U.S. Defense Intelligence Agency estimated at the time.
The U.S. Fifth Fleet, which is based in Bahrain, is charged with protecting commerce in the region.
The U.S. Navy has typically kept four mine countermeasure vessels, or MCM vessels, in Bahrain, though those ships are being replaced by another type of vessel called a littoral combat ship, or LCS, which also has anti-mine capabilities.
All anti-mine ships had been temporarily removed from Bahrain in the days leading up to the U.S. strikes on Iran in anticipation of a potential retaliatory attack on Fifth Fleet headquarters.
Ultimately, Iran's immediate retaliation was limited to a missile attack on a U.S. military base in nearby Qatar.
U.S. officials, however, have not ruled out further retaliatory measures by Iran.
 
Links :

Wednesday, July 2, 2025

New evidence reveals America’s discovery long before Columbus


New analysis of ancient writings suggests that sailors from the Italian hometown of Christopher Columbus knew of America 150 years before its renowned ‘discovery’. 
(CREDIT: CC BY-SA 4.0)

From TheBrighterSide by Joseph Shavit

Sailors from the same region as Christopher Columbus may have known about North America more than a century before his 1492 voyage.

A newly analyzed medieval manuscript suggests that sailors from the same region as Christopher Columbus may have known about North America more than a century before his 1492 voyage.
The revelation stems from a little-known text written in the 14th century that challenges long-held views about when Europeans first learned of lands across the Atlantic.

The document, Cronica universalis, was written around 1345 by a Milanese friar named Galvaneus Flamma. Professor Paolo Chiesa, a scholar of Medieval Latin literature, recently brought it to light through a detailed study. 
“The reference is astonishing,” Chiesa said, noting that the text appears to describe a part of the North American continent.

In the chronicle, Flamma refers to a distant land called “Marckalada,” a name scholars have connected to “Markland,” which appears in Icelandic sagas.
This term has long been associated with parts of the Atlantic coast such as Newfoundland and Labrador. Chiesa’s interpretation positions this as the earliest Mediterranean mention of the Americas.

Landing of Columbus, oil on canvas by John Vanderlyn, 1846 (CREDIT: Architect of the Capitol)

Trade and travel likely played a role in spreading the story.
According to Chiesa, Genoese sailors—well-traveled and deeply involved in maritime commerce—may have picked up tales of this distant land from their northern counterparts.
These rumors could have been passed through docks and taverns, woven into the everyday conversations of seafarers.

The findings, published in Terrae Incognitae, offer more than just an intriguing footnote.
They contribute to ongoing debates over what Columbus actually hoped to find.
Was his voyage purely exploratory, or was it guided by fragments of preexisting knowledge?
This rediscovered manuscript adds weight to the idea that the Americas weren’t entirely unknown.

These questions are especially relevant today. Each year, Columbus Day draws new scrutiny, with many cities and states instead observing Indigenous Peoples’ Day.
Statues of Columbus have been toppled or defaced, reflecting deeper reassessments of European colonization and its aftermath.

Though the Cronica universalis offers only glimpses, Chiesa believes the fragmentary references are significant.
They suggest that Europe’s awareness of the Western lands may have been more widespread—and far earlier—than most history books admit.

He explains that Genoa, the city where Columbus was born, was a hub of maritime trade, serving as a gateway for news and stories from far-off lands, including Greenland and other northern territories.

Galvaneus Flamma, the author of the document, was well-connected to the ruling family in Milan and wrote extensively on historical subjects.
His writings provide a unique perspective on Milanese history and beyond.

The document itself was unfinished, but it attempted to chronicle the history of the world from creation onward.
In one passage, Galvaneus makes reference to rumors of lands to the northwest, believed to be for the potential of commercial gain.

He describes these lands as being “rich in trees” and inhabited by animals, characteristics not unlike those of the Markland mentioned in the GrÅ“nlendinga Saga, a medieval Icelandic text.
Galvaneus’s detailed description of Greenland, coupled with his mention of Marckalada, reflects the knowledge circulating among Genoese sailors at the time.

 
Miniature from a 14th-century Italian manuscript identified as Triv.1438 by the Archivio Storico Civico e Biblioteca Trivulziana, entitled Cronica de antiquitatibus civitatis mediolanensis, depicting Italian chronicler and friar Galvaneus Flamma. (CREDIT: CC BY-SA 4.0)

“What makes the passage exceptional is its geographical provenance: not the Nordic area, as in the case of the other mentions, but northern Italy,” Chiesa says.

He adds that while many of the rumors Galvaneus recorded were too vague to be included in maps or scholarly texts, this discovery demonstrates how information from Nordic sources may have reached Italy long before Columbus set sail.

The mention of Marckalada suggests that tales of this distant land traveled from the northern harbors, carried by Scottish, British, Danish, and Norwegian sailors trading with Genoese merchants.

Chiesa emphasizes that Cronica universalis is a reliable source, as Galvaneus is careful to note when he is recounting oral stories, often supporting his claims with elements from both legendary and factual accounts.
This level of detail, Chiesa believes, lends credibility to the friar’s account of the Genoese sailorshaving heard about North America from their northern trading partners. 

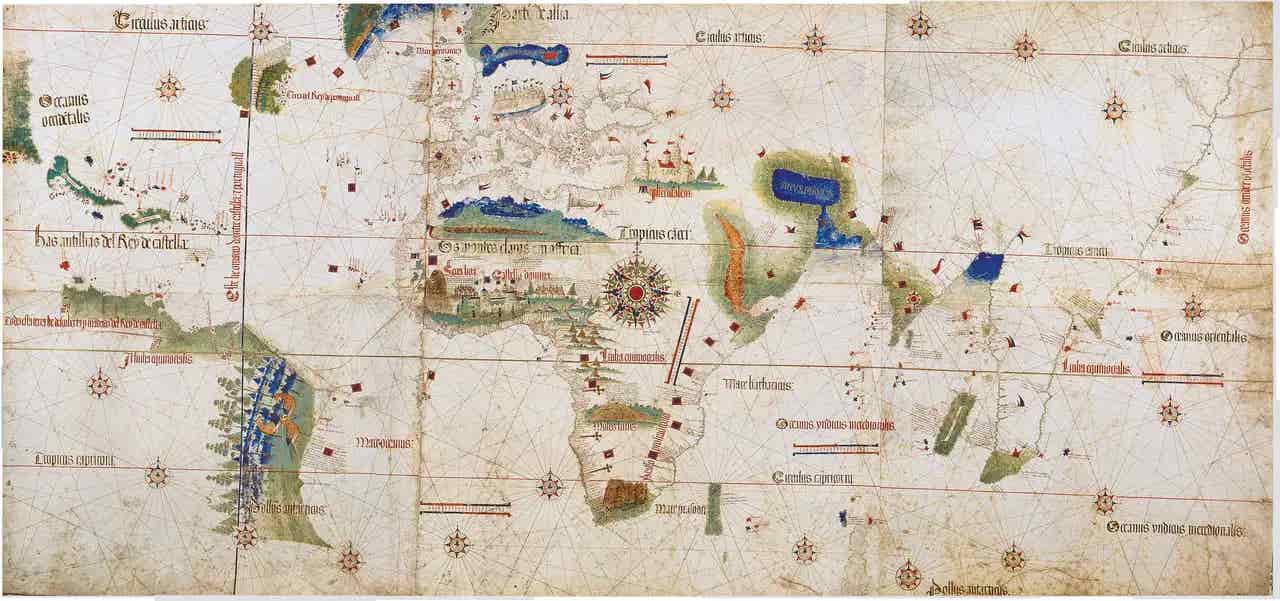
Milan, Italy, found in 1340 manuscript a mention of America 150 years before Columbus.
(CREDIT: CC BY-SA 4.0)

Though there is no evidence that Italian sailors themselves reached these northern lands, the Genoese were well positioned to gather news and goods from northern Europe and transport them to the Mediterranean.

Chiesa also highlights the advanced geographical knowledge of the north possessed by Genoese and Catalan sailors, as evidenced by their detailed nautical charts from the fourteenth century.

“It has long been noticed that the fourteenth-century portolan charts drawn in Genoa and in Catalonia offer a more advanced geographical representation of the north,” Chiesa explains, indicating that this knowledge likely came from direct contact with northern European traders.

Although the exact extent of Genoese sailors’ understanding of the American continent remains uncertain, the discovery of Cronica universalis opens the door to new interpretations of European exploration in the Middle Ages.
It suggests that Italian merchants and sailors may have been aware of lands beyond Greenland long before Columbus embarked on his voyage.

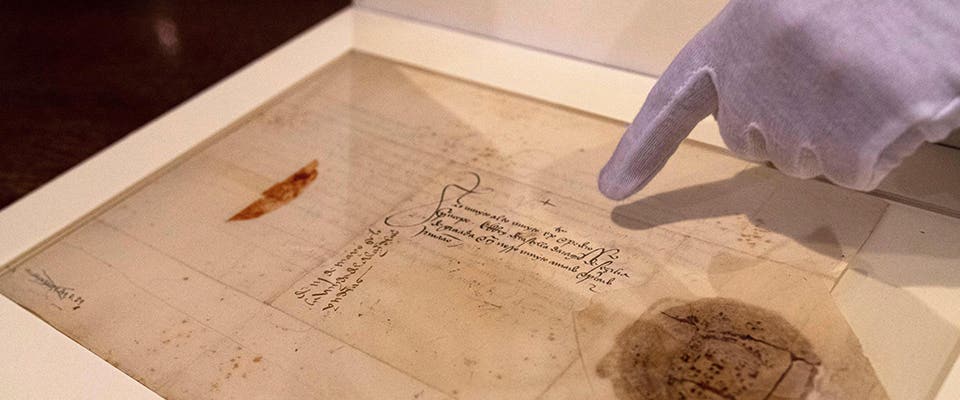
While the information in Cronica universalis is fragmentary, it provides important context to the notion that knowledge of the Americas may have been circulating in Europe well before Columbus. (CREDIT: Archivos Estatales, mecd.es)

As of now, Cronica universalis remains unpublished, but there are plans for a future edition as part of a scholarly program at the University of Milan.

This forthcoming publication will likely spur further discussion on the global exchanges of knowledge that took place in the centuries leading up to the age of exploration.

5 key facts about the Cronica Universalis:
  • Authorship and Period: The Cronica Universalis was written by Giovanni da Carignano, a Genoese cleric and cartographer, in the early 14th century. It offers a historical perspective on global events and geography during the medieval period.
  • Geographical Knowledge: The text reflects Giovanni's knowledge of geography, highlighting early European understanding of distant lands, including Africa, Asia, and even hints of lands across the Atlantic.
  • Mentions of the New World: It is notable for its early references to regions west of Greenland, possibly alluding to Norse exploration of North America. This predates Columbus's voyages by more than a century.
  • Integration of Maps and Text: Giovanni combined written accounts with cartographic insights, creating a blend of historical narrative and geographical representation. This approach was advanced for his time, showing an effort to document the known world comprehensively.
  • Historical Significance: The Cronica Universalis provides valuable insights into medieval European worldviews and early knowledge of lands beyond Europe. It is considered a precursor to later explorations and expansions of global awareness.
Links :

Tuesday, July 1, 2025

The blue whale: the world's most versatile measuring stick?


from a reader who proposes an ingenious new unit of data – but we have some quibbles with the maths

From NewScientist by Josie Ford

Whales not Wales

Feedback has been a science journalist for more years than we care to remember, and as a result we have come across our fair share of bizarre units of measurement.
The human mind struggles with the very large and the very small, so as a writer it is tempting to say that huge icebergs have an area that is X times the size of Wales, or a mountain is Y times the height of the Burj Khalifa, or a bad book contains Z times more plot holes than Fourth Wing.

In this spirit, Christopher Dionne wrote in to highlight a CNN article about the Blue Ghost lunar lander sending its final message from the moon.
He notes that the writer tries to convey the amount of data the probe sent by saying it “beamed a total of about 120 gigabytes of data — equivalent to more than 24,000 songs — back to Earth”.

“This got me thinking,” says Dionne. Nowadays a lot of music is streamed, so the size of the song files “doesn’t generally matter”. 
The size of the files will also vary depending on the compression method, and on a song’s length.
We can surely all agree that All Too Well (10-minute Version) is going to be a slightly larger file than Love Me Do – so you can’t use songs as a standardised unit of dataset size.

Happily, Dionne has come up with a solution. 
“Why don’t we use the internationally agreed upon standard of measurement – the blue whale?” The blue whale genome is 2.4 billion bases in length. “So it seems that the Blue Ghost has sent back 50 blue whales of data from the moon.”

Feedback likes the idea, partly because we enjoy the Douglas-Adams-esque image of a torrent of whales hurtling to Earth from the moon. But we are going to quibble Dionne’s maths. A base in a genome isn’t equivalent to a byte in a dataset. Each byte is eight bits, and it is the bits that are analogous to bases. DNA isn’t binary, either: there are four possible choices (A, C, G or T) for each position in the genome. That means you can encode a byte using half as many bases as bits. So, multiply by 8 and divide by 2, and we think Blue Ghost sent back about 200 blue whales.

We encourage readers to submit, as Dionne suggests, “other comparative units of digital measurement… which may be even better at communicating the scale of information”, and we look forward to “a thoughtful discourse around this most pressing issue”.
 
Goodbye, Alice and Bob

Few things are more likely to kill a joke than the need to meticulously explain it.
So Feedback is a bit nervous about this one, since it involves both a topical event and a cryptographic in-joke.

Let’s start with the cryptography thing, because we think this is the one readers might need a refresher on. When explaining how secure messaging systems work, it has become traditional to refer to the two main agents as “Alice” and “Bob”. 
For example: “How can Alice send a secure message to Bob using the Signal messaging app?”

The names have been in use since 1978 and are so widespread they have their own Wikipedia page.
As well as describing the history of the device, this page delineates the hugely extended list of additional characters that can become involved in these thought experiments: from Chad, “a third participant, usually of malicious intent” all the way to Wendy, “a whistleblower”.

Basically, if you are a regular New Scientist reader, you will probably have read stories that used Alice and Bob (and their friends/enemies/acquaintances/lovers) to explain complicated ideas in cryptography and physics.
You are familiar with this.
Parodies of it are therefore amusing.

We aren’t going to bother naming the relevant news event.
It was widely covered and discussed.
Although, who knows: we are writing this on 27 March, so by the time you read this you might have forgotten about it, because the news moves so fast these days.
Maybe the US has invaded Svalbard in the interim because Donald Trump forgot which Arctic landmass he wanted.

Anyway, here we go. Posting on Bluesky, software developer John VanEnk shared a screenshot of a Wikipedia page.
It read: “Hegseth and Waltz are fictional characters commonly used as placeholders in discussions about cryptographic systems and protocols, and in other science and engineering literature where there are several participants in a thought experiment. 
The Hegseth and Waltz characters were created by Jeffrey Goldberg in his 2025 article ‘The Trump Administration Accidentally Texted Me Its War Plans’. 
Subsequently, they have become common archetypes in many scientific and engineering fields…” 
This was accompanied by a diagram, described as an “example scenario where communication between Hegseth and Waltz is intercepted by Goldberg”.

If, after all that buildup, you didn’t find it funny, Feedback encourages you to send your comments to our Signal account, which we don’t have.

What a lark

Readers Patrick Fenlon and Peter Slessenger both wrote in to highlight the same article in The Guardian, on how migrating birds use quantum mechanics to navigate.
Apparently most “migrate at night and by themselves, so they have no one to follow”, according to a biologist quoted in the article.
Her name is Miriam Liedvogel, which of course means “songbird”.

As Fenlon put it: “Wunderbar”.

Links :


Monday, June 30, 2025

Earth’s clouds on the move

 
Marine storm cloud zones have shifted poleward and narrowed, and the changes are contributing to our planet’s growing energy imbalance.
Image of the Day for June 17, 2025
 Instruments: Aqua — MODIS / Meteosat Model
 
From NASA

For much of his career, George Tselioudis, a researcher at NASA’s Goddard Institute for Space Studies, has analyzed decades of satellite observations to understand where clouds occur, whether their distribution has changed, and how changes might affect Earth’s energy budget and climate.
The implications of two of his recent studies, he says, are worrying.

Clouds are common on Earth, but they are ephemeral and challenging to study.
Remote sensing has helped scientists tremendously by enabling consistent, global tracking of the elusive features, even over inaccessible areas like the poles and open ocean.

The first study, published in August 2024, showed that Earth’s cloudiest zones over the oceans have shifted and contracted over the past 35 years, allowing more of the Sun’s energy to reach and warm the ocean instead of being reflected back to space by storm clouds. 
“The pattern is clear. Where storm clouds form has changed,” Tselioudis said. The implications for the climate, he added, are significant: “This has added a large amount of warming to the system.”

The analysis focused on three major storm zones: a band of thunderstorms near the equator known as the ITCZ (Intertropical Convergence Zone), and two broader mid-latitude zones in the northern and southern hemispheres between roughly 30 and 60 degrees latitude, where comma-shaped storm systems—sometimes called extratropical cyclones—swirl over the oceans.

The illustration at the top of the page depicts where clouds typically form, based on several years (2002-2015) of averaged cloud fraction observations from the MODIS (Moderate Resolution Imaging Spectroradiometer) sensor on NASA’s Aqua satellite.
Stormy areas where the sensor observed clouds more frequently are shown with white; less cloudy areas appear in shades of blue.

1984 - 2018


Earth’s storm clouds typically form near the edges of certain large-scale atmospheric circulation features—the Hadley, Mid-latitude (also called Ferrel), and Polar cells, depicted above—where winds converge and air is forced upward.
Clouds are less common and less reflective where dry air descends in the subtropics, roughly below 30 degrees north and south of the equator.
Though tropical cyclones—hurricanes, typhoons, and cyclones—can reach the subtropics, they do so infrequently.
The image below highlights different storm types as seen by the EPIC (Earth Polychromatic Imaging Camera) on the DSCOVR satellite on June 10, 2025.

The new research shows that areas over the ocean where storm clouds often form have contracted by between 1.5 to 3 percent per decade.
The ITCZ narrowed, and the mid-latitude storm zones moved poleward as they contracted.
Meanwhile, subtropical zones with fewer clouds expanded.

These changes are depicted in the chart above: white areas show where storm clouds were common, and shades of blue indicate less cloudy areas.
The trend line colors depict the degree of cloudiness.
Areas that were cloudy 85 percent or more of days are bounded by black dotted lines.
Drier areas that were cloudy on 65 percent or less of days are bounded by white dotted lines.
The chart is based on data from the combined record of several geostationary and polar-orbiting satellites that are part of the ISCCP (International Satellite Cloud Climatology Project).

In a second analysis published in May 2025, Tselioudis and colleagues examined the effect of these cloud changes on Earth's energy budget.
They found that the shift increased the amount of energy absorbed by the oceans by about 0.37 watts per square meter per decade—a substantial amount on a planetary scale.


June 10, 2025

Past analysis of data from NASA’s CERES (Clouds and the Earth’s Radiant Energy System) instruments has shown that since 2005, there has been an increase of 0.47 watts per square meter per decade in the amount of solar energy Earth absorbs compared to the amount that exits as thermal infrared radiation.
This increase is part of a growing energy imbalance—a more than doubling since 2001—that has heated the oceans and contributed to global warming.

While the accumulation of greenhouse gases in the atmosphere and changes in sea ice cover explain a portion of that imbalance, pinpointing how much other processes have contributed has been a source of uncertainty and debate among scientists.
Changes to airborne particles, the reflectivity of land surfaces, clouds, and oceans are among several possible factors that may be contributing to the growing energy imbalance.

These new findings suggest that the loss of oceanic storm clouds is a key driver of the imbalance, Tselioudis said.
He describes the loss of the reflective clouds detailed in his papers as a “crucial missing piece” in the puzzle of the 21st century energy imbalance.
He added that this change to clouds is also likely a key reason that unusually warm ocean and global temperatures in 2023 surprised scientists by exceeding expectations so much.
“These findings will provide a key test for the latest generation of climate models to see whether they are getting the right answer for the right reasons,” said Gavin Schmidt, director of NASA’s Goddard Institute for Space Studies.

The big question now, Tselioudis said, is what has caused the reduction in reflective storm clouds and whether the trend will continue.
One possibility, long predicted by climate models, is that different rates of warming in the Arctic compared to the equator in recent decades may be expanding the size of Hadley cells and driving the poleward shift of the storm zones. 
“We can't prove this yet,” said Tselioudis. 
“The system is complicated, and other dynamics might be in play.”

Links :

Sunday, June 29, 2025

France & misc. (SHOM) layer update in the GeoGarage platform

4 nautical raster charts updated

Secrets of WWII revealed | Drain the oceans | U-Boats, Warships, & Pearl Harbor

0:46:34 D-Day - A survey of the D-Day shipwrecks sheds light on the biggest amphibious invasion in history. 
1:33:37 The Battle of Britain - Uncovered wrecks reveal how Britain defeated Adolf Hitler and the Nazis. 2:20:28 The Killer U-Boats - Draining the oceans sheds light on the world’s first stealth weapon — German U-Boats. 
3:07:29 Hitler's Killer Warships - Drain the Oceans sheds new light on Hitler’s reign of terror and ultimate demise. 
3:54:31 Japan's Surprise Attack - Japan dominated the Pacific, crushing the Allies, but how did they do it? 4:41:34 Pearl Harbor - Secrets of Pearl Harbor are revealed in wrecks of ships, subs and planes.