Saturday, September 24, 2016
Friday, September 23, 2016
Computing the ocean's true colors
Modeled phytoplankton types on cubed sphere
The data is from a simulation of the Darwin model in a physical run of the MITgcm by the ECCO2 group.
The model has 78 types of phytoplankton, nutrients, zooplankton and disolved and particulate organic matter.
(other video)
From Phys.org by Mark Dwortzan
When she was 17, Stephanie Dutkiewicz set sail from her native South Africa to the Caribbean islands.
Throughout a three-month journey, she noticed that the color of the ocean shifted from place to place, but it wasn't until she took up oceanography in college that she came to understand why.
Early on in her studies, she learned that ocean color varies from green to blue, depending on the type and concentration of phytoplankton (algae) in the area.
As they use chlorophyll, a green pigment, to generate organic carbon through photosynthesis, these "plants of the sea" reflect light; the more phytoplankton in the ocean, the less blue and more green the color of the water.

Stephanie Dutkiewicz in her office with a display of her phytoplankton model simulation.
Credit: MIT Joint Program on the Science and Policy of Global Change
Now a principal research scientist in MIT's Joint Program on the Science and Policy of Global Change and Department of Earth, Atmospheric and Planetary Sciences (EAPS), Dutkiewicz remains focused on these drivers of ocean color.
For more than a decade, she and her main research partner, EAPS Associate Professor Mick Follows, have been leading a team of a dozen MIT researchers and several collaborators from universities around the world to advance the Darwin Project, which aims to model the growth, loss, and movement of phytoplankton around the world, the environments that they inhabit, and how they affect one another.
Dutkiewicz is systematically probing phytoplankton behavior to home in on what traits distinguish one of thousands of phytoplankton species from another, which types will survive and thrive under different environmental conditions, and where different types are likely to live.
Dutkiewicz is systematically probing phytoplankton behavior to home in on what traits distinguish one of thousands of phytoplankton species from another, which types will survive and thrive under different environmental conditions, and where different types are likely to live.
Guided by laboratory, ship, and satellite observations, she has represented as many as 100 different types of phytoplankton—other groups typically model no more than five—in complex computer models that simulate phytoplankton population dynamics in the ocean and project how those dynamics will change in coming decades.
Producing results that square with actual observations, these models, which comprise hundreds of thousands of lines of code, are generating the world's most complex 2-D and 3-D global maps of phytoplankton activity and ocean color.
Producing results that square with actual observations, these models, which comprise hundreds of thousands of lines of code, are generating the world's most complex 2-D and 3-D global maps of phytoplankton activity and ocean color.
Visually arresting, the maps suggest profound implications for the future of the planet, from the sustainability of the ocean's food web to the pace of global warming.
"Since they are at the base of the food web, understanding which types of phytoplankton live where and projecting how these populations are likely to change will help us understand what will happen further up the food chain," Dutkiewicz explains.
"Since they are at the base of the food web, understanding which types of phytoplankton live where and projecting how these populations are likely to change will help us understand what will happen further up the food chain," Dutkiewicz explains.
"And because the process by which these phytoplankton take carbon and sink it down into the deep ocean is responsible for storing about 200 parts per million (ppm) of carbon dioxide, they play an important role in the Earth's climate system."
Size matters
Size matters
In an ongoing phytoplankton modeling study funded by the National Science Foundation, Dutkiewicz and Follows are investigating several distinguishing traits and their potential impact on the planet.
Traits they've identified include those based on behavior, such as rates of nutrient uptake, temperature tolerance and light tolerance, and those based on size.
In the phytoplankton world, size matters.
In the phytoplankton world, size matters.
While all are microscopic, individual phytoplankton range in diameter from under 1 micrometer to more than 1,000 micrometers—akin to the size difference between a mouse and Manhattan.
As the ocean warms, its upper layers are expected to interact less with lower layers where nutrients are concentrated.
As a result, smaller phytoplankton, which are best equipped to tolerate compromised nutrient conditions, will likely outnumber larger phytoplankton, which are more effective at storing carbon. Such changes may not only shift the oceanic food web to one based on smaller phytoplankton but also reduce the ocean's effectiveness as a carbon sink.

Computer simulations based on Dutkiewicz’ phytoplankton models have produced global maps of ocean color like this “Living Liquid” exhibit at the San Francisco Exploratorium — an interactive touchscreen table showing phytoplankton types in different colors. Credit: San Francisco Exploratorium
Most phytoplankton models, including those used by the Intergovernmental Panel on Climate Change (IPCC), usually resolve just two phytoplankton types: small and large.
So when the ocean warms to a certain point in the coming decades, the modelled phytoplankton populations appear to shift dramatically, with small ones far outnumbering large ones. In reality, however, these shifts are expected to occur gradually.
"Because we include a more diverse size distribution in our model, we find that as we run out the 21st century, phytoplankton sizes don't quickly shift from big to small, but rather from big to slightly smaller," says Dutkiewicz.
"Because we include a more diverse size distribution in our model, we find that as we run out the 21st century, phytoplankton sizes don't quickly shift from big to small, but rather from big to slightly smaller," says Dutkiewicz.
"So the impact might not be as large as the IPCC models predict."
To assess the impact of phytoplankton size and function on the climate, Dutkiewicz and her collaborators represent the global ocean as a set of location-based grid cells, each sized at a resolution that's fine enough to validate the model through satellite and ship observations.
To assess the impact of phytoplankton size and function on the climate, Dutkiewicz and her collaborators represent the global ocean as a set of location-based grid cells, each sized at a resolution that's fine enough to validate the model through satellite and ship observations.
Within each grid cell, the model solves a set of equations that account for phytoplankton growth, movement, loss, carbon cycling and other population dynamics.
Comparison of modeled and SeaWiFs Chl
True colors
With funding from NASA, Dutkiewicz is also using the computer model to "ground-truth" satellite observations of phytoplankton concentrations in different parts of the ocean, which are based on how much light is emitted from the ocean surface.
The light is reflected by chlorophyll in phytoplankton, which absorb more blue than green light.
By measuring how much blue versus green light is emitted, the satellites estimate how much chlorophyll is present at a given location.
Such estimates are crude at best, so Dutkiewicz is working to assess the level of uncertainty in chlorophyll ocean maps by representing reflected light in her phytoplankton models.
Her models produce true colors of the ocean today, and project ocean colors throughout the 21st century based on changes in phytoplankton population dynamics.
Her models produce true colors of the ocean today, and project ocean colors throughout the 21st century based on changes in phytoplankton population dynamics.
For example, as the ocean warms and becomes more acidic, phytoplankton populations will change, thus altering chlorophyll levels and impacting how much light is reflected from the ocean surface.
"Tracking this could help us identify a real, climate-change-driven signal that stands out from the year-to-year, natural variability in phytoplankton populations across the globe," she says.
Dutkiewicz' career path as an oceanographer has uniquely positioned her to pinpoint such signals.
As a PhD student in physical oceanography at the University of Rhode Island, she originally focused on capturing the movement of ocean currents.
When she came to MIT in 1998 as a postdoc in EAPS, she studied how physics alters the biology of phytoplankton (e.g. how ocean currents move their biological cargo), and built a numerical model of the marine ecosystem based on one type of phytoplankton.
Now modeling up to 100 times as many types, she is perhaps the most qualified person in the world to explain not only why the colors of the ocean vary from place to place, but also what those colors might portend for the future of the planet.
Links :
- Phys.org : Study reveals 'two faces' of phytoplankton
- NASA : Ocean color
- GeoGarage blog :NASA's PACE mission will uncover new information about health of our oceans / Image of the week : winter blooms in the Arabian Sea / Earth pictures from space / Image of the week : Plankton bloom, Black Sea / Image of the week : plankton arrives in Scandinavia / Scientists point out reason behind North Atlantic phytoplankton bloom
Thursday, September 22, 2016
Greenland's huge annual ice loss is even worse than thought
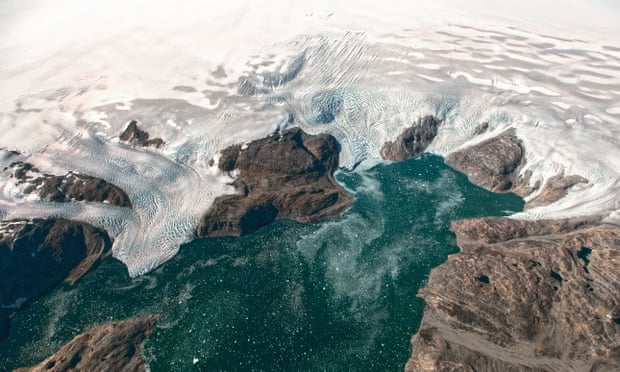
Aerial surveys show two glaciers flowing into Johan Petersen fjord in
south-eastern Greenland.
The melting of the ice sheet would cause oceans
to rise by six metres around the world if it was lost entirely.
Photograph: Jeremy Harbeck/Icebridge/NASA
From The Guardian by Damian Carrington
Ice cap is disappearing far more rapidly than previously estimated, and is part of a long-term trend, new research shows
The huge annual losses of ice from the Greenland cap are even worse than thought, according to new research which also shows that the melt is not a short-term blip but a long-term trend.
The melting Greenland ice sheet is already a major contributor to rising sea level and if it was eventually lost entirely, the oceans would rise by six metres around the world, flooding many of the world’s largest cities.
The new study reveals a more accurate estimate of the ice loss by taking better account of the gradual rise of the entire Greenland landmass.
When the ice cap was at its peak 20,000 years ago, its great weight depressed the hot, viscous rocks in the underlying mantle.
As ice has been shed since, the island has slowly rebounded upwards.
Previous satellite estimates of modern ice losses tried to take this into account, but precise new GPS data showed much of Greenland is rising far more rapidly than thought, up to 12mm a year.
This means 19 cubic kilometres more ice is falling into the sea each year, an increase of about 8% on earlier figures.
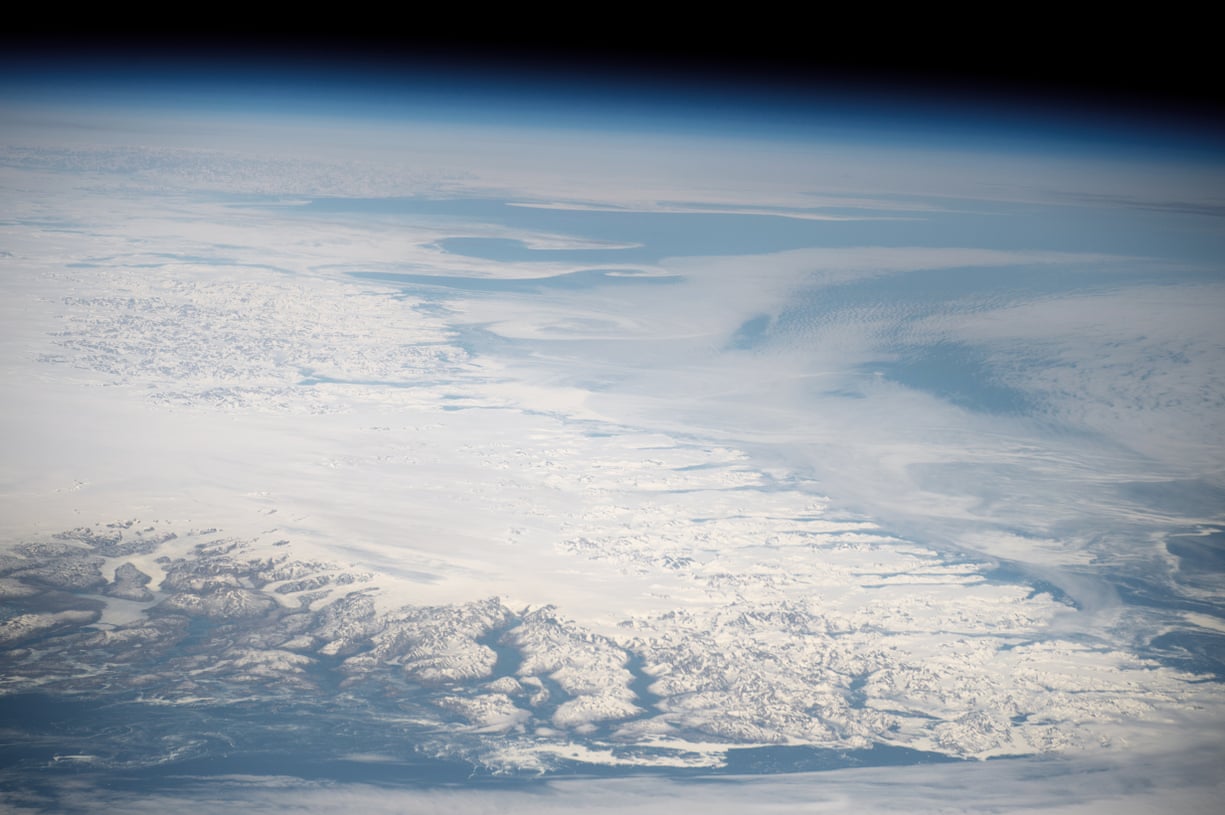
The southern tip of Greenland seen from space.
Photograph: ISS/NASA
The new work was also able to reconstruct the ice loss from Greenland over millennia and found that the same parts of Greenland - the north-west and south-east - were where most ice is being lost both in the past and today.
This means the rapid ice loss recorded by satellite measurements over the last 20 years is not likely to be a blip, but part of a long-term trend being exacerbated by climate change.
Global warming is driving major melting on the surface of Greenland’s glaciers and is speeding up their travel into the sea.
“The fact that we are seeing such a similarity of past and present behaviour suggests we could lose ice in these regions for decades into the future,” said Prof Jonathan Bamber, at the University of Bristol, UK, and one of the international team of scientists who carried out the new study, published in Science Advances.
Aerial Camera views from shore visits on the east and west coasts of Greenland, August 2016.
“The headlines of climate change and melting polar ice are not going to change,” said Dr Christopher Harig, at the University of Arizona, who was not involved in the study.
“The new research happening now really speaks to the question: ‘How fast or how much ice can or will melt by the end of the century?’ As we understand more the complexity of the ice sheets, these estimates have tended to go up. In my mind, the time for urgency about climate change [action] really arrived years ago, and it’s past time our policy reflected that urgency.”
Melt water on the surface of Greenland ice sheet 10 June, 2014 and 15
June, 2016.
Every spring or early summer, the surface of the sheet
transforms from a vast white landscape of snow and ice to one dotted
with blue meltwater streams, rivers, and lakes.
In 2016, the transition
started early and fast.
Credits: OLI/Landsat 8 and ALI/Earth
Observing-1/Nasa
Dr Pippa Whitehouse, at the University of Durham and also not involved in the new research, said: “This study highlights the powerful insight that GPS measurements can give into past and present ice loss. Using such measurements, this study demonstrates that some of the highest rates of ice loss across Greenland - both in the past and at present - are found in areas where the ice sheet flows directly into the ocean, making it dangerously susceptible to future warming in both the atmosphere and the ocean.”
This video shows images from a science flight on August 27, 2016, over a heavily crevassed portion of the Rink Glacier in western Greenland.
NASA's Operation IceBridge flies with a high-resolution camera on board, pointing straight down and taking overlapping images during the entire flight. These images represent a data product in their own right, and also provide a visual reference to help researchers better understand the data they get from other instruments.
(NASA/Rob Russell)
In April, very high temperatures led to a record-breaking early onset of glacier melting in Greenland, while another satellite study in August reaffirmed the rapid loss of ice.
Links :
- YouTube : Greenland's Glaciers on the Loose: Fiamma Straneo
- NASA : Southern Greenland
- Washington Post : Greenland may be losing ice even faster than scientists thought
- University Buffalo : What’s happening beneath Greenland?
- GeoGarage blog : Global warming is melting the Greenland ice sheet, fast / Greenland's ice layers mapped in 3D / New NASA model maps sea level rise like never before /Greenland: Like the most beautiful woman / Greenland glacier calves island four times the size of Manhattan
Wednesday, September 21, 2016
Faroe islands in the GeoGarage platform

DGA raster maps in the GeoGarage platform
 ENC Faroë coverage in the GeoGarage platform (ArcGIS JS viewer) :
more raster charts than ENCs available

more raster charts than ENCs available
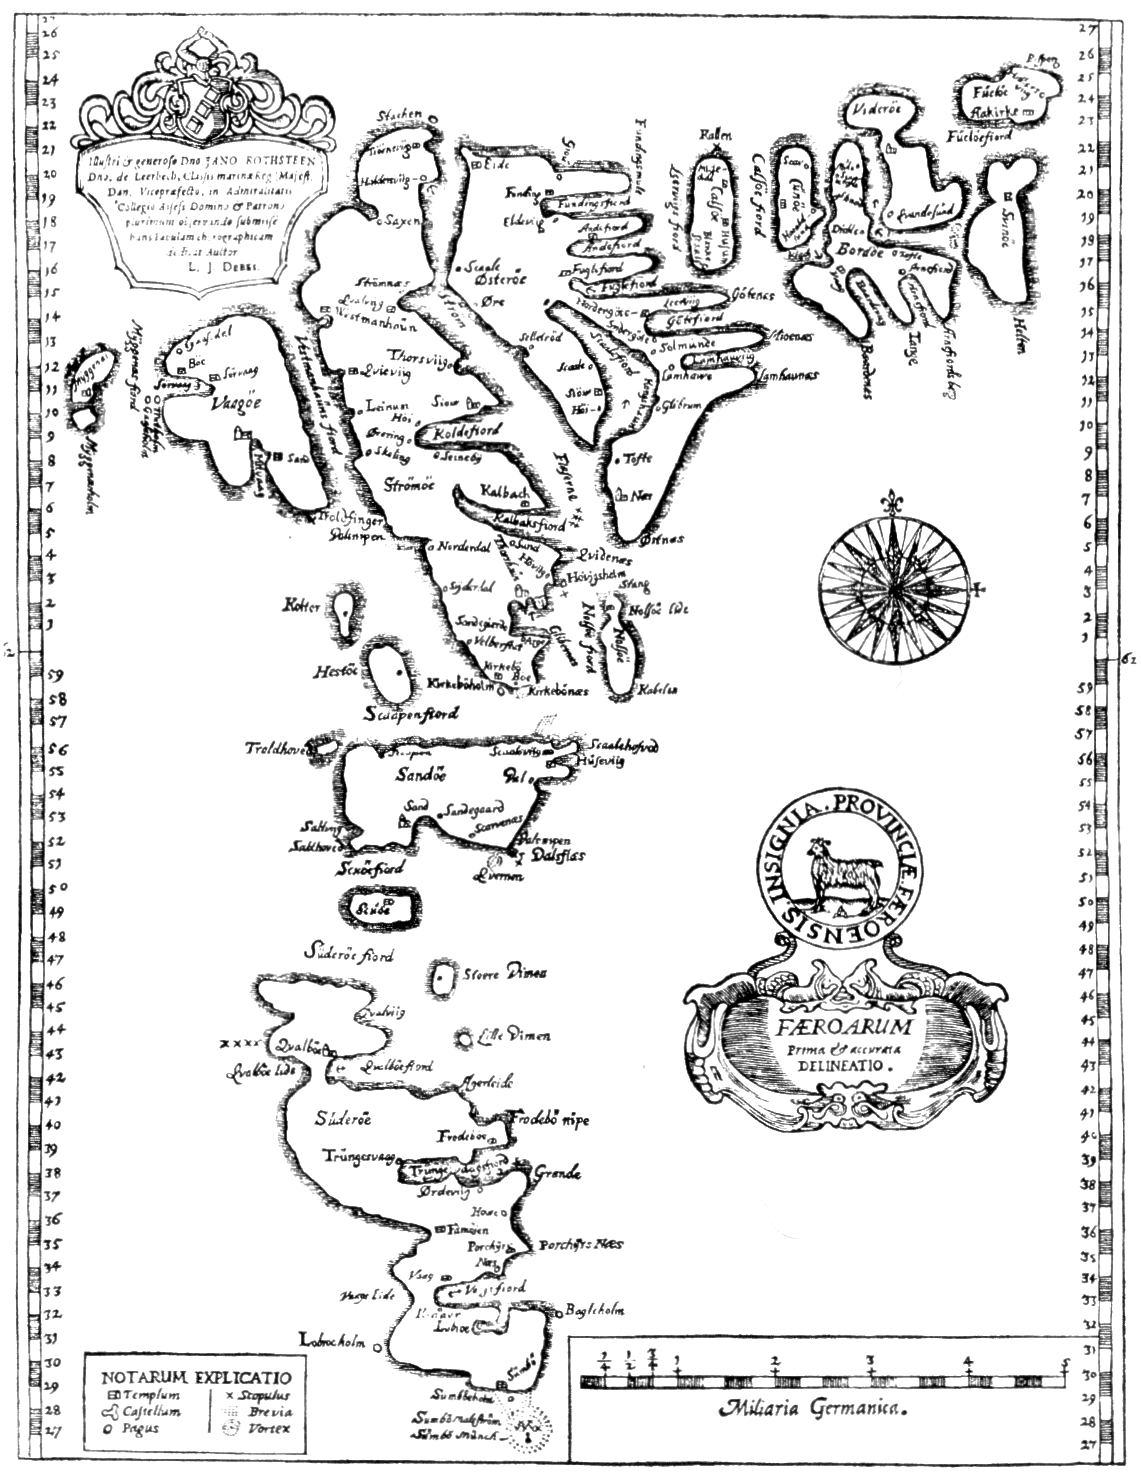
FÆROARUM – Prima & accurata delineatio.
Hanc veterrimam tabulam insularum Lucas Debes anno 1673 fecit.

Fisrt accurate triangulation of the Faroes

The Faroe islands (Føroyar) became a self governing community of the Danish Commonweath
on April 1, 1948 and are administrated from Tórshavn.
(raster chart with the GeoGarage and Google Maps viewer)

on April 1, 1948 and are administrated from Tórshavn.
(raster chart with the GeoGarage and Google Maps viewer)

comparaison with ENC chart in the GeoGarage platform and Bing maps imagery
La Niña might not be coming after all
Sea surface temperature patterns of the 2015 El Niño
don’t show any signs of an impending La Niña this year.
Image: NASA
From Gizmodo by Maddie Stone
After promising biblical rains and instead giving California crabs, El Niño passed away quietly last spring. But while early data suggested La Niña would rise to fill the chasm El Niño’s departure had left in our meteorological newsfeeds, NOAA is now starting to think La Niña might not happen at all.
As the spring wore on, our confidence in the anti-El Niño climate pattern grew stronger, bolstered by the expansion of a telltale, cold water undercurrent in the equatorial Pacific.
When that cold water mass started to breach the surface last May, ending the reign of El Niño’s hot blob once and for all, climatologists forecasted a 75 percent chance La Niña would be here by the end of the year.
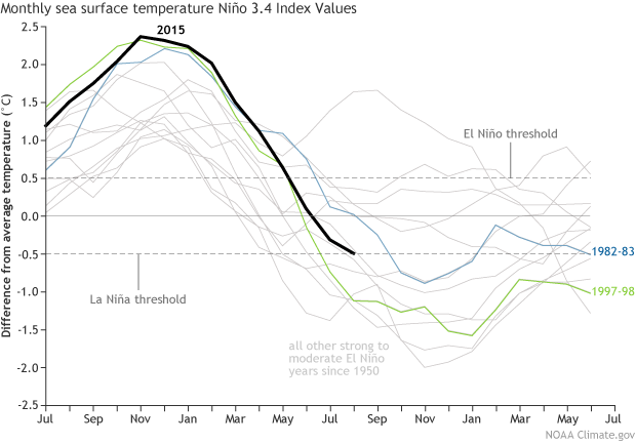
Monthly sea surface temperature anomalies in the Niño 3.4 region of the
tropical Pacific, with El Nino and La Nina threashold conditions
indicated by dashed lines.
Image: Climate.gov
But late last week, NOAA’s Climate Prediction Center poured some cold water on our hope that lots and lots of cold water would spread across the Pacific’s midsection, perhaps even making a temporary dent in our global, carbon emissions-fueled heat wave.
Last week, the La Niña watch was officially taken down. Forecasters are now placing their bets on ENSO-neutral conditions (aka, neither El Niño nor La Niña) persisting through the winter.
As a blog post by NOAA explains, we’re still measuring cooler-than-average temperatures across the so-called Niño 3.4 region of the tropical Pacific, which are considered typical for La Niña. But that temperature dip hasn’t been accompanied by the La Niña atmospheric response.
By this point, we should be seeing an amping up of the Walker circulation pattern, meaning cool air should be sinking more vigorously in the central and eastern Pacific as warm air rises more vigorously over the western Pacific.
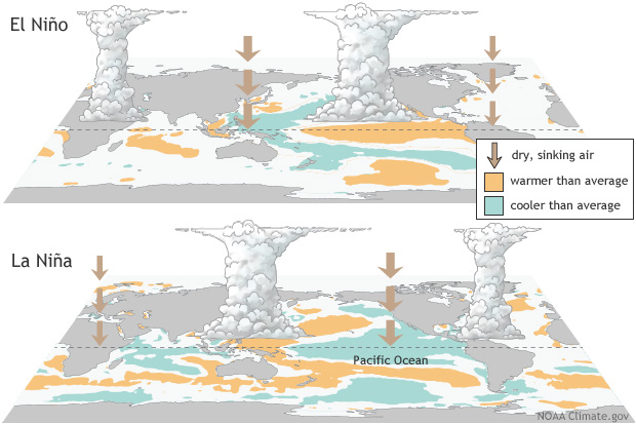
El Niño and La Niña, the warm and cool phases of the El Niño-Southern
Oscillation, disrupt large-scale air movements in the tropics, impacting
weather patterns across the world.
Image: Climate.gov
“So far, there have only been some very weak indications of this intensification,” NOAA writes. And without these atmospheric acrobatics, the cool subsurface waters in the Niño 3.4 region are likely to fizzle out.
La Niña could still happen—it might just be a late bloomer.
But the probability that we’ll be welcoming a La Niña into the world this winter has been downgraded significantly to about 40 percent.
Despite having virtually tied the 1997-98 El Niño in terms of strength, our planetary party guest didn’t end California’s drought, although that may have been an unreasonable expectation. It sorta figures that El Niño’s alter ego would be a no-show.
Links :
- NASA : After strong El Niño, NASA sees return to normal
- Climate.gov : September 2016 ENSO update: Cooling our heels
- ClimateCentral : Is La Niña Here? Depends Who You Ask
Tuesday, September 20, 2016
World leaders meet to protect oceans

Obama Creates Atlantic Ocean's First Marine Monument
Riley D. Champine, NG staff
sources: the pew charitable trusts, esri, delorme,
general bathymetric chart of the oceans, noaa ncei
Riley D. Champine, NG staff
sources: the pew charitable trusts, esri, delorme,
general bathymetric chart of the oceans, noaa ncei
The foreign secretaries from more than 90 countries will converge on the State Department today for the Obama administration’s third and final summit on the health of the world’s oceans.
The Our Ocean summit will focus on the nexus of climate change and ocean issues—a link U.S. Special Envoy for Climate Change Jonathan Pershing told reporters yesterday is not well-understood.
“While climate change is a huge issue, in many ways we should think about it as an exacerbating factor for things that are already problematic,” said Pershing.
The world’s oceans are already threatened by overfishing and pollution from industry and agriculture. But they have also absorbed 40 percent of the man-made carbon dioxide that has entered Earth’s atmosphere since the Industrial Revolution, leading to higher levels of acidification that have damaged coral reefs and shellfish populations.
The seas have also absorbed heat, sometimes causing fisheries to migrate out of their traditional range and away from fishermen that rely on them.
Secretary of State John Kerry launched the summit two years ago to shine a light on what he considers to be the foreign policy and national security priorities related to oceans management.
Last year’s gathering was hosted by Chile.
Kerry will open the conference today, with President Obama giving a keynote address in the morning.

President Obama visited Turtle Beach on Midway Atoll in the Pacific this month to promote his expansion of the Papahanaumokuakea Marine National Monument.
On Thursday, the president declared a marine monument in the Atlantic that is the size of Connecticut.
Credit A.J. Chavar/The New York Times
The two-day summit at State Department headquarters will include more than 100 new commitments by a variety of stakeholders, organizers said.
They include new marine protected zones and a proposed ban on disposable plastic bags put forward by France.
Countries will also discuss ways to incorporate ocean health issues into the commitments they made in last year’s Paris climate agreement.
Undersecretary of State for Economic Growth, Energy and the Environment Catherine Novelli told reporters yesterday that one way to compensate for the stress being placed on marine environments by climate change is to remove other pressures on the system, by scaling back pollution and creating more marine protected areas.
Countries around the world have introduced protected areas in recent years, and “we’re going to have many more that will be announced at this conference,” she said.
“We’re trying to lead by example in doing that.” Obama last month expanded the Papahnaumokukea marine protected area in Hawaii, making it the world’s largest ecologically protected area.
And yesterday, the White House announced the designation of another marine national monument off the coast of Cape Cod in Massachusetts that will protect an additional 4,913 square miles.
It will preclude activities like commercial fishing and deep-sea mining.
A small number of lobstermen and red crab fishermen operate in the area, though the White House claimed it had not included the most active areas in the monument.
Republicans say the administration has prioritized environmental aims over economic development. House Natural Resources Chairman Rob Bishop (R-Utah) described the Hawaii designation as “a sweeping expansion” in an op-ed in The Hill yesterday.
OCEANS ARE ‘IN TROUBLE’
In addition to protecting ocean ecosystems, these sanctuaries boost the role oceans can play in regulating the climate by contributing to the health of marine vegetation that sequesters carbon, Novelli said. Mangrove forests do more to sequester carbon than rainforests.
“We know that the ocean is in trouble, but we also know that the ocean is resilient,” she said.
“And if we do the right thing, it can come back.”
International climate leaders and technical experts met yesterday at National Geographic’s headquarters to begin work on recommendations for how countries can integrate ocean concerns into their nationally determined contributions (NDCs) to the Paris Agreement.
A handful of countries already refer to ocean issues in their submissions, but most don’t.
Climate advocates hope the summit can help persuade countries to increase the ambition of their commitments early.
The Moroccan presidency of the next round of climate talks in Marrakech has designated an Oceans Day during the November conference.
The recommendations will be introduced then.
French Ambassador Laurence Tubiana and Moroccan Ambassador Hakima El Haite, who together lead the Global Climate Action Agenda heading into this year’s talks, said they hope that businesses, cities and other non-state actors will make voluntary commitments to reduce the impact of climate change on the seas.
Tubiana said yesterday that Marrakech would “put the ocean in the right place in the agenda.”
El Haite said oceans should be “put in the heart of the development and human rights agenda” of Paris, including both mitigation and adaptation plans.
“Including oceans in NDCs would be a clear political signal and commitment and would encourage more programs and initiatives from the private sector, the financial community and all the non-state actors,” she said.
In addition to increased acidification and changing ecosystems, climate change is projected to contribute as much as 4 feet to sea-level rise by the end of the century.
Solutions to both climate change and ocean ecosystem degradation include protection of mangrove forests and other so-called “blue sinks” that sequester carbon, better monitoring and investments in research, and the speedy implementation of Paris.
The global climate deal takes effect when 55 countries totaling 55 percent of the world’s emissions join.
The current tally is 27 countries totaling 40 percent of emissions.
But more than 30 additional countries are expected to become parties next week at a Sept. 21 summit at U.N. headquarters in New York City.
WARMING REDUCES ACCESS TO PROTEIN IN AFRICA
A global oceans summit that draws foreign ministers rather than environmental secretaries is part of Kerry’s legacy at State.
In remarks at the first conference in 2014, Kerry recounted how, as a child growing up in Massachusetts, “I first dipped my toes into the mud off Woods Hole Oceanographic in that area of Buzzards Bay and the Cape and was introduced to clamming and to fishing and all of those great joys of the ocean.”
“I have had this enormous love and respect for what the ocean means to us,” he said then.
He continued to focus on ocean issues as a member of the Senate Commerce, Science and Transportation Committee and chairman of its Oceans, Atmosphere, Fisheries and Coast Guard Subcommittee.
Pershing said on yesterday’s call that during his recent trip to Senegal, he was told that fisheries supplying 90 percent of that country’s protein are migrating out of reach of its fishermen as the ocean warms.
“And if you start to think about that magnified by the extent of those coastal nations, which, in many poor countries, rely on their fishing capacity to provide a substantial share of their people’s food supply, you get one window into the extent of the damages,” he said.
Tubiana, who was one of the architects of last year’s climate deal, pointed to the summit as another part of Obama’s legacy.
“I think all of us will have a big debt to President Obama and his legacy, on his capacity to really have focused the global agenda to these key issues and make the link,” she said.
“I think he’s using his last days and even the last minute to do that.
“Whatever the result of your election is, you will have provided an enormous advance in the global agenda,” she said.
Europe will host next year’s summit, and countries in other regions are lined up to do so in coming years—so its continued existence does not depend on who wins the U.S. presidential election.
But if Republican presidential nominee Donald Trump wins the election, it is likely he’ll be less invested in climate issues, both domestically and internationally.
But Pershing said on the call that international momentum would continue on climate change regardless of the outcome.
Escalating damage from climate change and cheaper low-carbon solutions will continue to drive progress, he said.
“And it’s independent, quite frankly, of whether we are able in the next administration to take a president who likes it or doesn’t like it,” he said, adding, “And I’m not seeing any backing down from that, independent of what happens here in the United States.”
Links :
- National Geographic : John Kerry Says Saving the Oceans Is a 'Life or Death' Issue / Obama Creates Connecticut-Size Ocean Park, First in Atlantic
- HuffingtonPost : Ocean Champions for Healthy Oceans
- NYTimes : Obama Creates Atlantic Ocean's First Marine Monument
Monday, September 19, 2016
Denmark DGA NEW layer in the GeoGarage platform

197 nautical charts added
see : News

but no more map monsters on the GeoGarage modern maps
see this Northern Europe sheet of Atlas by Antoine Lafréry (1575)
Antoine Lafréry, 1575
Relief shown pictorially.
Some maps entirely in Italian, some maps entirely in Latin.
Title derived by cataloger from title page of bound Lafréry atlas.
Seventeen loose sheets that appear in atlases sold by Antoine Lafréry.
- Library of Congress
Global Fishing Watch lets you track 35000 fishing boats in real time
From Oceana
Oceana, SkyTruth and Google today launched the public Beta of Global Fishing Watch, a new online technology platform that allows anyone in the world free access to monitor and track the activities of the world’s largest commercial fishing vessels in near real-time.
By providing the first free global view of commercial fishing*, Global Fishing Watch delivers a powerful and unprecedented tool that can help to rebuild fish stocks and protect our oceans, which are threatened by global overfishing, illegal fishing and habitat destruction.
The announcement was made in conjunction with the Our Ocean Conference in Washington, D.C., an international gathering of ocean leaders hosted by Secretary of State John Kerry. The product of a partnership between Oceana, SkyTruth and Google, Global Fishing Watch is an intuitive and free interactive online tool that shows the apparent fishing activity of 35,000 (and counting) commercial fishing vessels operating throughout the world.
The platform is regularly updated to show vessel tracks and fishing activity from January 1, 2012 through three days prior to present time.
By sharing this critical information publically for the first time, Global Fishing Watch will have immeasurable and wide-ranging positive impacts on ocean health.
From allowing fishery managers to better understand and manage fishing activity in their waters to aiding enforcement agencies in deterring illegal fishing, Global Fishing Watch is a powerful tool to help restore our oceans. “Global Fishing Watch will revolutionize the way the world views commercial fishing,” said Jacqueline Savitz, Vice President for the United States and Global Fishing Watch at Oceana.
“Now, in the hands of everyone, this free tool can be used by governments, journalists, citizens, researchers and the seafood industry.
It will allow governments to track suspicious vessels, enforce rules and reduce seafood fraud.
Journalists and everyday citizens will be able to identify behavior that may be related to illegal fishing or overfishing.
Global Fishing Watch is a powerful tool in the fight against illegal fishing and has tremendous potential to preserve and protect our world’s delicate marine ecosystem for generations to come.” Global Fishing Watch uses public broadcast data from the Automatic Identification System (AIS), collected by satellite and terrestrial receivers, to show the movement of vessels over time.
Every day, more than 20 million data points are added to AIS.
Global Fishing Watch uses this information to track vessel movement and classify it as “fishing” or “non-fishing” activity.
"Working with Oceana and Google has enabled us to take a good idea and build it into something that will improve the lives of hundreds of millions of people around the planet,” said John Amos, President and Founder of SkyTruth.
“Global Fishing Watch will catalyze the science, policy-making and public pressure necessary to make our oceans sustainable."
Global Fishing Watch is collaborating with governments, private industry, and scientific and international agencies to enable additional transparency and sustainability policies.
Indonesia, a leader in fisheries reform and management, has committed to making all of their registered fishing vessels with trackers public to the world through the platform because they believe so strongly in transparency.
Trace Register, the leading traceability solution provider for the global seafood industry, is working with Global Fishing Watch to enable its customers to verify that their seafood was legally and responsibly produced. Armed with new global datasets and access to massive cloud computing resources, leading scientific institutions around the world are collaborating in the Global Fishing Watch Research Program to model economic, environmental, policy and climate change implications on fisheries.
The Food and Agriculture Organization of the United Nations is exploring new methodologies to more accurately report global vessel registries and fishery statistics and will be proposing transparency tools to support States in improving their monitoring, control and surveillance of fishing activities.
"While many of the environmental trends in the ocean can be sobering, the combination of cloud computing, machine learning, and massive data is enabling new tools to visualize, understand and potentially reverse these trends,” said Brian Sullivan, Sr. Program Manager at Google Ocean & Earth Outreach.
“We are excited to contribute a Google-scale approach toward ocean sustainability and public awareness."
Links :
By providing the first free global view of commercial fishing*, Global Fishing Watch delivers a powerful and unprecedented tool that can help to rebuild fish stocks and protect our oceans, which are threatened by global overfishing, illegal fishing and habitat destruction.
The announcement was made in conjunction with the Our Ocean Conference in Washington, D.C., an international gathering of ocean leaders hosted by Secretary of State John Kerry. The product of a partnership between Oceana, SkyTruth and Google, Global Fishing Watch is an intuitive and free interactive online tool that shows the apparent fishing activity of 35,000 (and counting) commercial fishing vessels operating throughout the world.
The platform is regularly updated to show vessel tracks and fishing activity from January 1, 2012 through three days prior to present time.
By sharing this critical information publically for the first time, Global Fishing Watch will have immeasurable and wide-ranging positive impacts on ocean health.
From allowing fishery managers to better understand and manage fishing activity in their waters to aiding enforcement agencies in deterring illegal fishing, Global Fishing Watch is a powerful tool to help restore our oceans. “Global Fishing Watch will revolutionize the way the world views commercial fishing,” said Jacqueline Savitz, Vice President for the United States and Global Fishing Watch at Oceana.
“Now, in the hands of everyone, this free tool can be used by governments, journalists, citizens, researchers and the seafood industry.
It will allow governments to track suspicious vessels, enforce rules and reduce seafood fraud.
Journalists and everyday citizens will be able to identify behavior that may be related to illegal fishing or overfishing.
Global Fishing Watch is a powerful tool in the fight against illegal fishing and has tremendous potential to preserve and protect our world’s delicate marine ecosystem for generations to come.” Global Fishing Watch uses public broadcast data from the Automatic Identification System (AIS), collected by satellite and terrestrial receivers, to show the movement of vessels over time.
Every day, more than 20 million data points are added to AIS.
Visualization of 2014 Indonesian Vessel Monitoring System (VMS) data
in the Global Fishing Watch platform, as featured in the Jakarta Globe
Global Fishing Watch uses this information to track vessel movement and classify it as “fishing” or “non-fishing” activity.
"Working with Oceana and Google has enabled us to take a good idea and build it into something that will improve the lives of hundreds of millions of people around the planet,” said John Amos, President and Founder of SkyTruth.
“Global Fishing Watch will catalyze the science, policy-making and public pressure necessary to make our oceans sustainable."
Global Fishing Watch is collaborating with governments, private industry, and scientific and international agencies to enable additional transparency and sustainability policies.
Indonesia, a leader in fisheries reform and management, has committed to making all of their registered fishing vessels with trackers public to the world through the platform because they believe so strongly in transparency.
Trace Register, the leading traceability solution provider for the global seafood industry, is working with Global Fishing Watch to enable its customers to verify that their seafood was legally and responsibly produced. Armed with new global datasets and access to massive cloud computing resources, leading scientific institutions around the world are collaborating in the Global Fishing Watch Research Program to model economic, environmental, policy and climate change implications on fisheries.
The Food and Agriculture Organization of the United Nations is exploring new methodologies to more accurately report global vessel registries and fishery statistics and will be proposing transparency tools to support States in improving their monitoring, control and surveillance of fishing activities.
"While many of the environmental trends in the ocean can be sobering, the combination of cloud computing, machine learning, and massive data is enabling new tools to visualize, understand and potentially reverse these trends,” said Brian Sullivan, Sr. Program Manager at Google Ocean & Earth Outreach.
“We are excited to contribute a Google-scale approach toward ocean sustainability and public awareness."
Links :
- GeoGarage blog : How satellites and big data can help to save the oceans / 15 huge ocean conservation victories of 2015 /How satellite technology is helping to fight illegal fishing / Google's global fishing watch is using 'manipulated data' / The plan to map illegal fishing from Space
- Google : Mapping global fishing activity with machine learning
- Mashable : Leonardo DiCaprio unveils new tool for tracking illegal fishing
- Scientific America : Activists Open an Online Window onto the Global Fishing Fleet
- NYTimes : How Digital Tracking of Rogue Fishing Can Safeguard Vast Ocean Reserves
Sunday, September 18, 2016
Snøhvit CO2 Solution
Interested in learning more about the first offshore development in the Barents Sea?
Check out this video about Snøhvit, the first major development
without surface installations.
 Snøhvit on the Norwegian Continental Shelf (Kertverket chart)
Snøhvit (English: Snow White) is the name of a natural gas field in the Norwegian Sea,
situated 140 kilometres (87 mi) northwest of Hammerfest, Norway.
without surface installations.

Snøhvit (English: Snow White) is the name of a natural gas field in the Norwegian Sea,
situated 140 kilometres (87 mi) northwest of Hammerfest, Norway.
Subscribe to:
Posts (Atom)