This visualization, narrated by Dr Hayley Evers-King of the Plymouth
Marine Laboratory, shows a year of ocean chlorophyll measurements, as
observed by satellites such as the Copernicus Sentinel-3 series, which
are operated by EUMETSAT.
A variety of ocean colour products are available from the Copernicus
Marine Environment Monitoring Service (CMEMS), operated by Mercator
Ocean on behalf of the European Commission. For more information, visit
the CMEMS website at http://marine.copernicus.eu/
The Copernicus Sentinel-5P satellite carries the state-of-the-art Tropomi instrument to map a multitude of trace gases such as nitrogen dioxide, ozone, formaldehyde, sulphur dioxide, methane, carbon monoxide and aerosols – all of which affect the air we breathe and therefore our health, and our climate.
With a swath width of 2600 km, it maps the entire planet every day.
Information from this mission is used through the Copernicus Atmosphere Monitoring Service for air quality forecasts and for decision-making.
Tropomi – a spectrometer – maps the global atmosphere every day with a resolution as high as 7 km × 3.5 km.
At this resolution, air pollution over cities can be detected. It will be the autumn before S5P-Tropomi is fully operational for all the gases it monitors
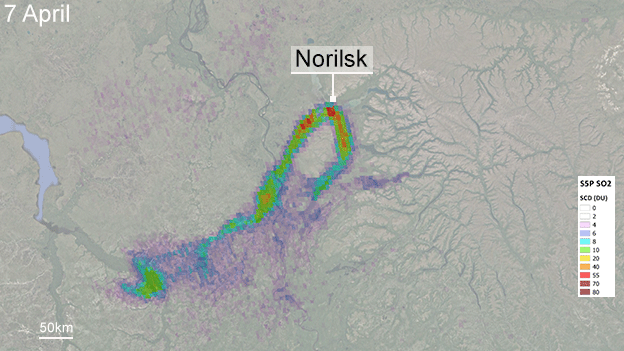
What must it be like to live in the Siberian town of Norilsk on a "bad air day"?
They say the local smelting industry produces 1% of all the sulphur dioxide (SO₂) going into the air globally, something close to two million tonnes a year.
SO₂ is particularly unpleasant if breathed in; but it also washes out of the sky as "acid rain", damaging plant-life and denuding the quality of water in streams and rivers.
The extent of Norilsk's pollution problem is captured in remarkable new maps from Europe's Sentinel-5P satellite.
The spacecraft was put up last year to track the gases responsible for dirty air - with SO₂ being one of the prime culprits.
Launched on 13 October 2017, the Copernicus Sentinel-5P satellite has been used to map atmospheric carbon monoxide around the globe.
Assembled in the UK and carrying the Dutch-led Tropomi instrument, S5P promises to be a game-changer in monitoring what's happening in our atmosphere.
It has much higher resolution than its predecessors and acquires data on such a scale that its maps can be assembled very quickly.
Image copyright Copernicus Data 2018/TROPOMI/BIRA-IASB/DLR Wind takes the sulphur dioxide south of the city, splitting the plume around mountains
"What's very interesting about the Norilsk data is that they show you the different transport pathways," explained Dr Nicolas Theys from the Royal Belgian Institute for Space Aeronomy (BIRA-IASB).
"You can see how the emissions follow the topography, moving around the mountains. People could use this information to better assess the environmental impact in this region."
The SO₂ concentrations in the air over Norilsk are very large - one-hundred to a thousand times higher than what you would see anywhere in Europe, for example.
The city's Norilsk Nickel company has been told to cut emissions by 75% by 2023 (compared with 2015) or face huge fines. What are the different SO₂ sources?
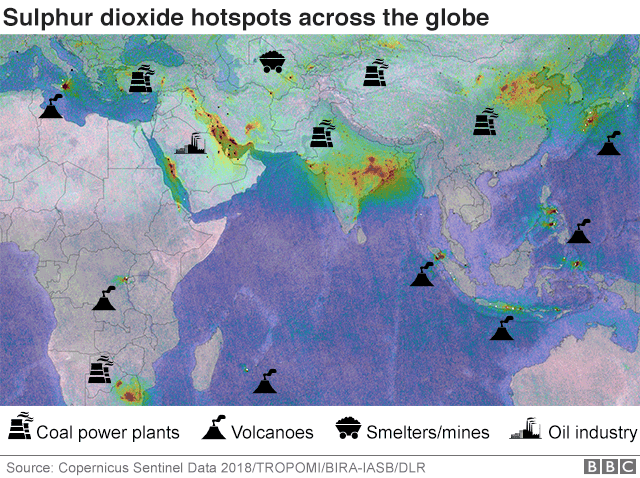
This partial map of the globe comprises 6 months worth of data
So, smelting is clearly one big emitter.
The gas is driven off as metal ores that also contain sulphur compounds are heated to high temperature.
Other major contributors include the burning of coal and oil.
Again, these include sulphur in their composition, which will be emitted as SO₂ when the fossil fuels are burned - unless the gas is caught, or "scrubbed", in some way.
The map above represents six months of S5P-Tropomi data.
In this partial picture of the globe, many familiar hotspots for SO₂ become apparent.
The step-change now being provided is the ability to differentiate sources.
"We can clearly distinguish the different power plants," said Dr Theys.
"As we get better with the data and reduce the noise, we will probably be able to estimate the quantity of emissions coming from individual power stations and complexes."
Such information will apply further pressure on the dirtiest sources to clean up their act.
Satellites like S5P-Tropomi are making it increasingly difficult for polluters to hide their activity.
And the kind of data you see on this page will all be worked into services that inform people about air quality, through channels such as TV weather forecasts and smartphone apps.
Image copyright Copernicus Data 2018/TROPOMI/BIRA-IASB/DLR
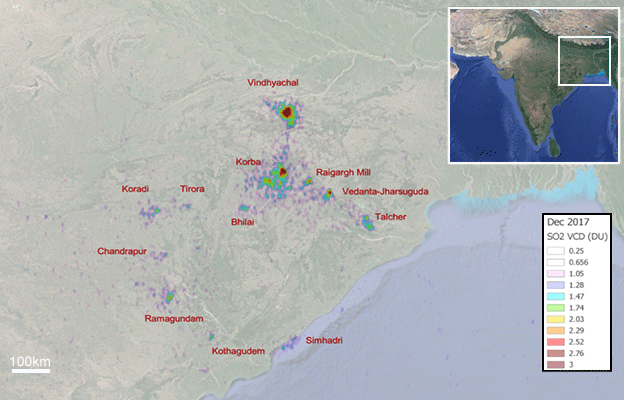
Northeast India's power stations are obvious to the Sentinel satellite
What about SO₂ from volcanoes?
This is the main natural source of sulphur dioxide in the atmosphere.
Looking again at the world map, it is easy to pick out the regions of recurrent volcanic activity, such as at Etna in Italy and Nyiragongo in the Democratic Republic of the Congo.
Climate modellers are interested in this kind of data because very large sulphur emissions can actually work to cool the planet.
Just seeing where the SO₂ plumes go also tells you something about where the volcanic ash thrown out by volcanoes is headed.
This is important to the aviation sector.
Everyone remembers the disruption to air travel that resulted from the 2010 eruptions of Eyjafjallajökull in Iceland.
The Copernicus Sentinel-5P satellite imaged sulphur dioxide from the Mount Agung volcanic eruption on Bali, Indonesia, between 8 and 29 November 2017.
As well as detecting different air pollutants, the mission also measures aerosols, as this sequence of images shows.
Credits: This sequence of images contains modified Copernicus Sentinel data (2017), processed by ESA/DLR.
Show me something really smart
Image copyright Copernicus Data 2018/TROPOMI/BIRA-IASB/DLR Improved resolution enables the different source locations to be identified
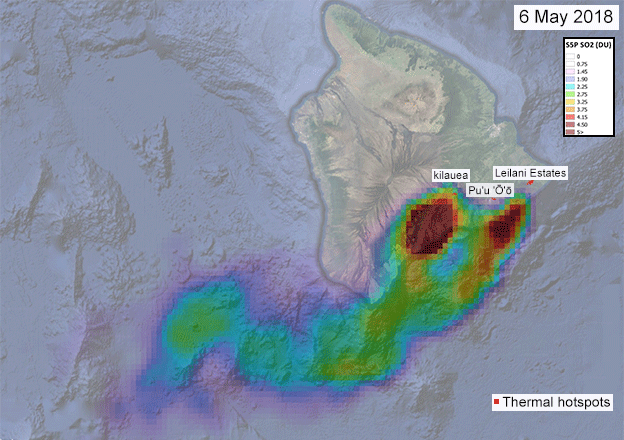
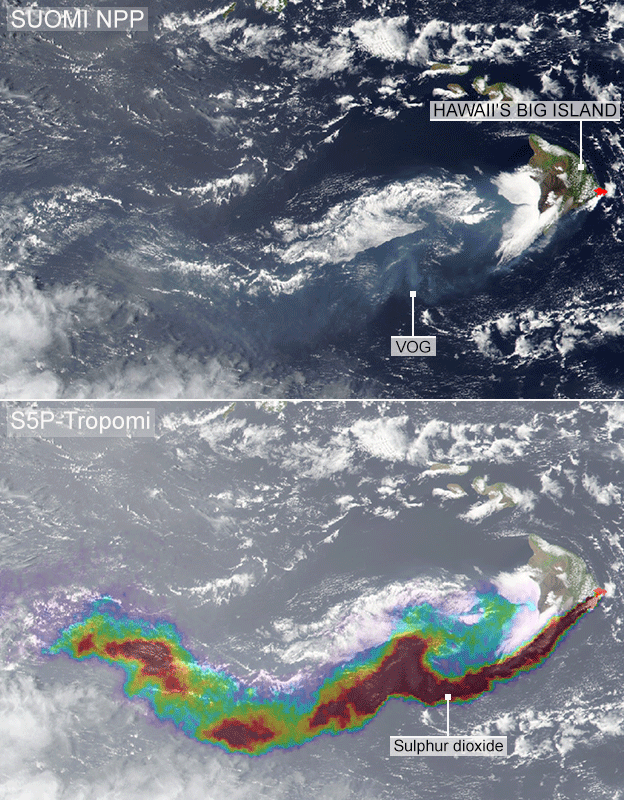
In recent weeks, Tropomi has also had a very good view of the major ongoing eruption on Hawaii's Big Island.
The instrument has been able to discriminate between the SO2 coming from the main volcanic edifice of Kilauea and those emanating from the troublesome new fissures in the populated Leilani Estates district to the east.
What is particularly clever is the way the Tropomi data has been combined with observations from the American Suomi-NPP weather satellite.
In the observations from this US spacecraft, you can just make out the volcanic smog, or "Vog", drifting away to the south of Big Island.
Vog is a respiratory irritant that is made when SO₂ combines with oxygen and water vapour in the atmosphere, in the presence of sunlight.
Suomi-NPP's Vog data maps perfectly on to Tropomi's direct sensing of SO2.
"[Suomi-NPP] and Tropomi are separated by just four minutes as they fly overhead," explained Dr Theys.
"We've shown this to the emergency response team and they are very interested in what we can do, not just because there is information in here about the eruption but because there are impacts for air quality. In truth, though, the volcano has come a bit early for us because we are not yet in the full operational phase and it is not possible for us at the moment to produce such maps in near-real time and deliver them to the people working in the field."
Image copyright Copernicus Data 2018/TROPOMI/BIRA-IASB/DLR
The American (top) and European (bottom) satellites fly almost on top of each other
What now for S5P-Tropomi?
After a test and commissioning phase, S5P-Tropomi is about to go operational for some of its data products.
These include pollutants such as nitrogen dioxide (NO₂) and carbon monoxide (CO).
The SO₂ observations, however, still need some work and they will not be released until the autumn.
Overall, the Tropomi investigations on S5P are led from the Netherlands Met Office (KNMI).
Dr Theys' institution in Belgium heads up the analyses of sulphur dioxide and another of the mission's trace-gas targets, formaldehyde (HCHO).
The bus, or chassis, of the satellite was assembled by Airbus in the UK, making S5P Britain's biggest single industrial contribution so far to the Sentinel series of satellites that have been procured for the European Union's Copernicus Earth-monitoring programme.
Many of the UK's scientists are also heavily involved in this Europe-wide project.
The hope is that this collaboration will continue after Brexit, although this will depend on the type of association Brussels and London are able to negotiate in their separation pact.
With a range of new marine tech—from mighty motors to stomach-easing gyros and virtual anchors—boat builders are leaving the auto industry in their wake. Dan Neil goes aboard to test the innovations
Whe I was a kid my father would take me offshore fishing in his small outboard boat and I would get seasick.
This was a cruel fate, because I loved boats, the sea and being with my dad.
But our quality time was always cut short.
Somewhere between the dock and the first ocean rollers I’d go pale, fall to my knees like James Brown, and hang my head over the side.
Uhh…
It never got better, not with Dramamine or scopolamine patches or wristbands.
I would just wind up in the bottom of the boat with purple hands.
My friends teased me, called me “Chum.” I’m sure my daylong, edge-of-death fugues were no fun for dad either.
But where medicine has failed to help seasickness sufferers—about a third of the general population—technology has at last succeeded, sort of.
This year a company called Seakeeper, based in California, Md., began offering an aerospace-inspired gyroscopic stabilization system for boats of trailerable size—that is, 27 to 32 feet long, the heart of the recreational powerboat market.
The Seakeeper is part of a digital transformation in boating that addresses apprehensions of new boaters with a variety of boathandling aids and assists.
And it’s not just newbies.
I grew up on boats without GPS positioning, without point-to-point autopilot, virtual anchors and auto-docking.
You know what? We hit the dock a lot.
But the technology my younger self covets most is the Seakeeper.
The company claims the device eliminates “up to 95 percent of all boat roll, the rocking motion that causes seasickness, fatigue and anxiety.”
My stomach had to see for itself.
I made arrangements to meet company rep Kelsey Albina at the city marina in Morehead City, N.C., the weekend before the Big Rock Blue Marlin Tournament (June 8-16).
These are home waters for me so I had a baseline.
I know where I usually throw up.
On the brilliant Sunday morning of our appointment, seas were 3 to 5 feet, winds southwest at 5 knots, and the marina was gunnel-to-gunnel with white-hulled 50-foot fish killers, staging for the tournament.
These guys worry me.
Power boating is booming in the U.S., with record sales in 2017 of more than 262,000 boats.
But the post-2008 rebound exposed a dangerous skills deficit among the rising class of boat owners.
In 2017 the United States Coast Guard reported 4,291 recreational boating accidents (just 3.9% down from the 2016 record) and 658 fatalities.
The top three types of accidents, in order: collision with another boat; collision with a fixed object; and flooding/swamping.
The primary causes: “operation inattention,” “improper lookout” and “operator inexperience.” This is the least salty generation of boat-buyers yet.
As for me, I would have run Dad’s boat up on the rocks and walked home to escape the horrors of my inner ear.
“We don’t claim it is a cure for seasickness,” cautioned Ms.
Albina, when we met aboard the company’s 29-foot cabin cruiser demonstrator.
For one thing, the system only restricts movement in one of six degrees of freedom.
It doesn’t restrict the boat’s pitch motions, for example, the tail up/nose down motions, nor should it; otherwise the boat wouldn’t ride over ocean swells but try to punch through them.
Inside what looks like a beach ball, a 500-pound, donut-shaped flywheel spins in a vacuum, clocking 8,450 revolutions every minute to counteract the force of the waves
As for the accelerative forces in the Z axis—rising and falling, the up and down, urp!—the boat floats on the water.
You really wouldn’t want it any other way.
The demonstrator boat—a sleek Albemarle 29 Express cabin cruiser—conceals the Seakeeper 3 (for boats up to 10 tons displacement) under its rear deck.
However, the company says the devices can be installed almost anywhere on the boat and work the same.
The device consists of an aluminum-cased sphere about the size of a Pilates ball, rotating back and forth on side bearings.
Inside the sphere is a 288-pound steel flywheel spinning in a near vacuum at a “tip speed” of 836 mph, within nanometer-scale tolerances.
As a boat rolls, the angular momentum of the flywheel creates a reaction force that transmits through the mounts to the hull of the boat.
As Ms. Albina explained, gyro stabilizers have been around since the early part of the 20th century in oceangoing vessels.
The innovation is the packaging of the device in an average-size boat.
The Seakeeper 2 is currently the smallest such unit in production; the design team’s mission is “20 by 21”; that is, a device that can fit in a 20-foot boat by 2021.
Take a ride and be amazed when you experience the Seakeeper Demo Boat!
Go from rolling to stable with the push of a button.
Stability doesn’t come cheap.
The Seakeeper 2 ($22,700, not including installation) is the range-starter, fitting boats up to 7 tons displacement.
The largest such system, the 35, for boats up to 100 tons displacement, costs $216,300 out of the box.
But as Ms.
Albina noted, the bigger the boat the lower the incremental cost of the stabilization.
By the time I got aboard the demonstrator boat the device was humming quietly (<68 dB) with 2,000 Newton-meters/sec of angular momentum.
It takes 36 minutes and 85 amps (12V system) to spool the device up to operational speed of 7,185 rpm.
When our captain, George Penna, fired up the big twin Yamaha outboards, the hum disappeared.
He then cautiously joy-sticked us into the busy channel between Radio Island and Fort Macon.
‘The anti-seasickness device is part of a technical transformation in recreational boating that addresses apprehensions of new boaters.’
There was a light chop in the channel through which the boat moved eerily affected, the bowrail level as the horizon.
Every few minutes a big sportfisherman or ferry churned up deep-troughed wake, over which the boat floated level like a duck.
In a few minutes more we rounded Radio Island and motored into Back Sound.
A jouncy 3-foot chop slapped the hull.
On such a day when I was a kid, it was right about here that I’d get my sea-knees.
But I felt fine.
We trolled around for a while.
Still OK.
We stopped for a few minutes, as if bottom fishing.
The device spun hectically, but there was no roll.
“Do you want to me to turn it off?” asked Mr. Penna.
The device can be locked in such a way to disable the gyro effect.
“Do I?” I said.
A few seconds later the boat, as if released by some invisible hand, starting rolling under my feet like a board on a ball.
Whoa.
The horizon waggled, the waves suddenly got higher.
Roll movement may be only one of six degrees of freedom but it is the one most directly tied to motion sickness.
I tried to fight it off—this one’s for you, Dad!—but within a couple minutes I got that old familiar feeling.
Please, Captain, would you reactivate your magic orb.
INNOVATION, AHOY!
THE LATEST IN MARINE TECHNOLOGY THROWS A LIFELINE TO UNEASY NEW CAPTAINS
Mega Multi Motors
illustration : Arthur Mount
At the 2015 Miami International Boat Show, Seven Marine unveiled its outboard motor for the End Times: the 627s, a horizontally mounted, supercharged and direct-injected 6.2-liter V8 producing the eponymous 627 hp and 600 lb-ft of torque.
This Poseidon of prop-spinners—under a carbon-fiber cowling pinstriped with LED lightbars—is currently the world’s most powerful production outboard motor.
But the mega-motor space is filling up.
In May Yamaha announced the XTO Offshore: a 5.6-liter, 425-hp V8 with integrated electric steering, no less.
Such engines can run solo but are typically ganged together in groups of two to four.
These arrays power the emerging class of extra-large center console fishing yachts (30 to 50+ feet).
The HCB Speciale, for example, is a 39-foot center console with a horsepower rating of 1,400 hp and a top speed of more than 60 mph.
It’s the smallest boat the company makes.
Gyroscopic Stabilization
illustration : Arthur Mount
This technology addresses a vast untapped market in recreational boating: landlubbers, which is to say, those prone to seasickness, perhaps as much as a third of the population.
But even old salts will appreciate not getting thrown around as much.
The Italian company Gyro Marine offers the following example involving a typical flybridge cruiser: Such a boat would typically have a maximum roll angle of about 12 degrees and a roll rate of 25 degrees per second, which is rocking pretty good.
With stabilization, the roll rate would be 2.5 degrees per second and maximum roll angle of a negligible 1.2 degrees.
Gyrostabilization is used in commercial shipping, military vessels and cost-is-no-object megayachts, and the devices are easily ganged together.
A fun fact, though counterintuitive: Gyrostabilizers work the same regardless of where they are placed in the ship.
They don’t need to be on the center line or at the center of buoyancy.
Seamless Self-Docking
illustration : Arthur Mount
“Docking is one of the most challenging boat handling maneuvers—getting it wrong can be embarrassing, expensive and precarious,” said Björn Ingemanson, president of Volvo Penta, which this month revealed self-docking technology for its Inboard Performance System.
The system augments joystick-controlled maneuverability with GPS awareness and sensors allowing the boat to see its surroundings, not unlike such systems in cars.
Scheduled to come to market by 2020, the hands-free system will move the boat into docking position and then hold there against tide, wind and current, until the captain signals the go-ahead.
Four sensors are on the dock to help guide the ship to its moorings.
The onboard computers make constant micro adjustments in power and steering angle of the IPS drive to keep the boat on its intended course into a safe berth.
“Even in changing sea conditions it can make the sea appear to stand still,” said Mr.
Ingemanson.
Virtual Anchors
illustration : Arthur Mount
One of the advantages of having multiple outboard motors is the boat’s ability to coordinate forward-reverse thrust at low speeds to hold a GPS-located position.
(Note: This is a trick electric bass-trolling motors—e.g., Minn Kota’s Spot-Lock—can do all by their lonesome because they can rotate 360 degrees.) In 2013 Mercury introduced the Skyhook, a push-button anchor that holds the boat in position against wind, tide or current.
The Skyhook function also allows the boat to hold heading but drift with the current; or the other way, stay in position but swing freely in heading.
Such station-keeping allows boats to be electronically parked over a fishing hole, for example.
But it’s also hugely helpful—to say nothing of safer—while pilots are waiting for a bridge to open in close quarters with other boats; or perhaps holding position in high winds in a busy marina full of more-expensive-than-yours boats.
For millennia, maps have held talismanic powers, helping to form spatial concepts and advance exploration.
They have shaped geopolitical ideas, triggered international disputes and created pictures of the world both large and detailed.
Today, satellites and digital mapping tools have turned modern cartography -- the science and art of map-making -- into a technology-driven field.
With accuracy all but guaranteed, new ways of visualizing space have emerged in the process.
They mix art, experience and topography, approaching the physical world through the lens of time, perspective and storytelling.
Qiu Zhijie: China's master mapmaker Artist Qiu Zhijie discusses his diverse artistic career and how his practice of drawing maps unites different aspects of his work.
He also describes his newly commissioned work "Map of 'Art and China after 1989: Theater of the World'” (2017), which traces “several decades of contemporary Chinese art.”
"We've entered a new era for cartography," Zhou Qiming, a professor and director of the Centre for Geo-Computation Studies at Hong Kong Baptist University, said in a phone interview.
"Previously, map-making focused solely on projecting the Earth and its sphericality on a flat plane.
That's taking a less crucial role now.
"We're approaching geographical environments from different directions, and (finding) ways of presenting geospatial locations that aren't maps in the traditional sense, but rather map-like visualizations.
It's no longer just about a spatial display, although that remains the main reference point for any cartographer.
Maps are getting smarter, and showing us the world under different parameters."
From Babylon to GPS
The earliest known maps were, given the limited knowledge of their creators, produced as artistic expressions rather than accurate representations.
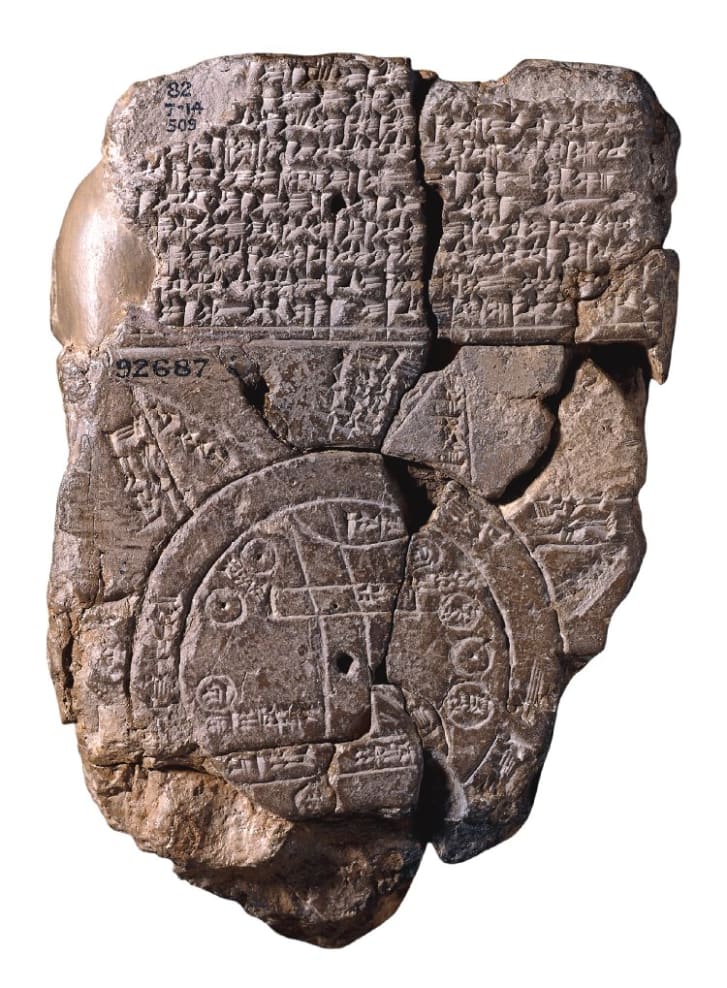
The "Babylonian Map of the World," a clay tablet created in Mesopotamia around 700 to 500 B.C., depicts Babylon as the center of the known world ringed by a circular waterway labelled "Salt-Sea" and surrounded by eight triangular regions.
The "Babylonian Map of the World," a clay tablet created in Mesopotamia around 700 to 500 B.C., shows the known world ringed by a circular waterway labelled "Salt-Sea" and surrounded by eight triangular regions.
Credit: Courtesy of The British Museum
Map-making took a turn for the realistic in the second century, when Greek scholar Claudius Ptolemy used math and geometry to devise a system of latitude and longitude for almost 10,000 locations in Europe, Asia and North Africa.
But even as cartography became an increasingly accurate science, maps were often more concerned with cultural traditions, storytelling and religious views.
A 12th-century map by the Islamic scholar Al-Sharif al-Idrisi portrayed a world with south at its top (as that's where Mecca was), with the northern hemisphere divided into seven climatic zones.
In the Middle Ages, the so-called "mappa mundi" often organized the world according to biblical time, with Christ looming over Jerusalem at their center.
Cartography made a technological leap during World War I with the development of aerial photography.
Then came radars and GPS, as maps moved into the digital sphere.
Through this technology, our understanding of maps has changed entirely, according to Eric Gunderson, CEO of Mapbox, a platform that provides mapping tool to companies like Foursquare, Evernote and Snapchat.
"They are instantly available, customized, interactive," he said in a phone interview.
"And users are at the center of them: We can make specific maps that aggregate elements we are interested in, and discard those we find irrelevant.
Maps compile data, but also behaviors and human experiences."
Alternative cartography
This may account for the future of cartography as a science, but what about map-making as an art?
Good City Life, a collective of researchers with no background in cartography, has been making maps according to how people feel about their cities.
"We've approached map-making from a different set of metrics," said co-founder Daniele Quercia in a phone interview.
"Taking into consideration things like sensory data, emotions, beauty (and) visual pleasure.
Maps aren't just two-dimensional."
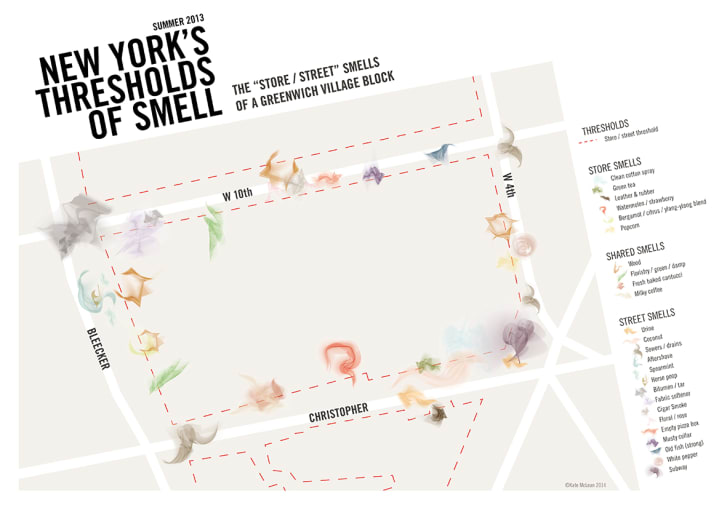
Smelly maps, taking one's nose as a big data machine, capture the entire urban smellscape from social media data.
Smelly maps, taking one's nose as a big data machine, capture the entire urban smellscape from social media data.
Credit: Courtesy Good City Life
One of the resulting cartographies is Happy Maps, a series of online maps that use algorithms to sort through geotagged images and calculate the most scenic routes.
Another is Chatty Maps, a project that documents what people hear on the streets and considers how soundscapes influence their perception of their environments.
Each map is color-coded, with noises rendered in different hues.
Smelly Maps, a third experiment by Good City Life, works on a similar premise, but focuses on tracking smells.
"Maps can improve people's lives," Quercia said.
"Today, they can be conceived to work around people's psychologies and to convey experiences."
Smells also underpin the maps made by Kate McLean, program director for graphic design at the UK's Canterbury Christ Church University.
Her charts guide people on city walks -- or "smellwalks" -- after which she gathers their olfactory impressions and uses them to visualize the "smellscape."
"New York's Thresholds of Smell" shows an exploration of the smells found in the doorways and windows of a Greenwich Village Block in the summer of 2013.
"From a design perspective, smell is such an under-researched sense -- perhaps because it's so difficult to represent," McLean said in a phone interview.
"I was intrigued by how it could help us understand the world we live in
"I base all my work on physical experiences, rather than algorithms," she added.
"Mine is certainly an artistic kind of cartography, but I am intrigued by how maps can maybe bring alternative realities into being, rather than presenting a fixed record of things."
Creating 'personal geographies'
Chelsea Nestel, a PhD student specializing in cartography at the University of Wisconsin-Madison, thinks of modern map-making in similar terms.
"The first rule of geography is that everything is related to everything else," she said in a phone interview.
"Today's cartography reflects exactly that: It combines design, geography, anthropology, human impressions and ideas within spatial contexts.
It's a connector, an aggregator.
And, increasingly, it's a way of telling stories."
Nestel produced a one to one scale scientific map of her body based on radiography and research.
The cartographer also used collaged memories to create a personal map of emotions.
Credit: Courtesy Chelsea Nestel
Nestel's creations span graphic design, comics and traditional mapping techniques.
One of her hand-drawn creations shows the territories of the United States according to the mythical beasts and monsters that supposedly inhabit them.
Another presents the world through the flow of tweets that followed earthquakes in Haiti, Chile, Japan and Turkey between 2010 and 2011.
Her most personal map, titled "Sum," is a depiction of her own body based on X-ray scans, blended with a collage of words and personal memories.
"Mapping tools are so advanced that there's no really limit to what maps can show and do," she said.
"And that includes exploring emotions and subjectivity."
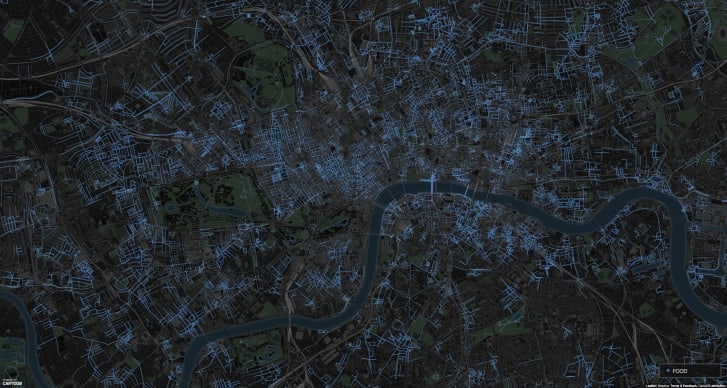
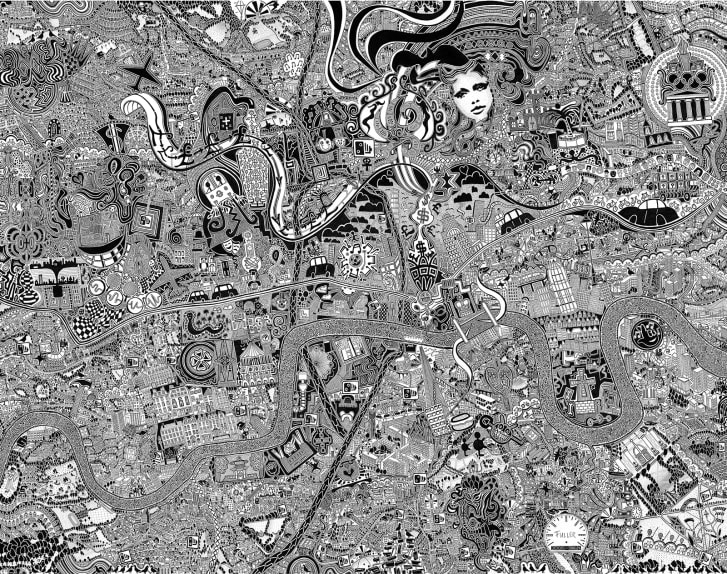
Welsh-born artist Gareth Wood, who goes by the name Fuller, borrows the tools of cartography to create geo-pictorial maps of world cities and present "the sense of a place." His huge, detailed artworks depict landmarks alongside pop culture symbols and other curiosities.
Artist Fuller charted the changing structures of London between 2005 and 2015.
Credit: Courtesy Fuller
"My maps blend my personal experiences with the culture and society of the place I am in," he said in a phone interview.
"They are snapshots of what I feel or see."
To create his most recent work -- a map of Beijing, where he is currently based -- Fuller circumnavigated a 140-kilometer outer-city ring road, before sitting down to sketch.
"Wandering helps me understand the people, as well as the different economic, environmental and social strata I need to represent," he said.
"I'm not a traditional map-maker.
But I create personal geographies and observe human stories, and isn't cartography supposed to be doing that?"
The Australian government is investing in GPS technology that will create jobs and support Australian industry.
Minister for Resources and Northern Australia, Senator Matt Canavan, said the government is investing over $260 million to develop the satellite technology.
“We rely on satellite and GPS technology for just about every aspect of our lives — from Google Maps on our individual phones, through to air traffic control at the busiest airports,” Canavan said.
“More precise technology will make Australian businesses more productive, safer and more efficient.
Specifically, Canavan said,
“More accurate GPS will improve productivity by allowing new technology to be created and used across the economy. Growing Australia’s digital economy will also benefit developed sectors such as mining, transport, construction, aviation and agriculture.
“This investment will improve competitiveness and secure jobs across the Australian economy.”
SBAS Testbed.
Under the package, $160.9 million will deliver a Satellite-Based Augmentation System (SBAS) to improve the reliability and the accuracy of positioning data from five meters to 10 centimeters across Australia and its maritime zone.
The $160.9 million includes funding over four years from 2018-19 and $39.2 million in ongoing funding from 2022-23.
It will realize the SBAS testbed, which is currently running across Australia-New Zealand.
CRCSI is an international research and development centre set up in 2003 under the Australian Government Business Cooperative Research Centres Programme.
The CRCSI is managing the industry-based demonstrator projects of the SBAS testbed and the economic benefits study.
The infrastructure management is being led by Geoscience Australia in partnership with Land Information New Zealand and the global technology companies GMV, Inmarsat and Lockheed Martin.
“We have been coordinating multiple trials of first and second generation SBAS and Precise Point Positioning correction signals since mid-2017,” said Graeme Kernich, CRCSI CEO.
“Our industry partners are crying out for this technology because a more precise positioning capability brings far-reaching and lasting impacts.
SBAS Testbed (Image : Geoscience Australia)
“Data analysis results and the economic benefits reported from the testbed are very promising and will translate across agriculture, aviation, consumer, construction, maritime, mining, rail, road, spatial and utilities.
“This is a formidable technology story and a practical demonstration of downstream space applications.
We are looking forward to continuing the testbed over the coming nine months and assessing the economic and social benefits the operational system will bring to Australia, and possibly New Zealand,” Kernich said.
“The CRCSI has a strong track record of bringing the best people together from the private sector, government and academia to solve the most complex spatial problems; the SBAS testbed is one of the finest examples of this,” Kernich said.
“More accurate and reliable satellite positioning technology will improve the safety and efficiency of many sectors across Australia and New Zealand,” he said.
“There are 28 projects across 10 sectors, with over 150 collaborating organizations currently involved in the testbed, making the footprint of this world-first trial truly trans-Tasman.”
National Positioning Infrastructure.
A $64 million investment in the National Positioning Infrastructure Capability (NPIC) will complement SBAS to improve GPS to an accuracy as precise as 3 centimeters in areas of Australia with access to mobile coverage.
The national positioning infrastructure project will establish additional ground stations and augment GNSS signals to deliver high accuracy positioning.
This will ensure nationally consistent and accurate positioning of 3 centimeters can be provided across Australia in areas with mobile coverage.
The project will achieve this by:
building new GNSS ground stations and integrating existing stations to enable multiple GNSS signals to be received for precise positioning across Australia.
establishing a GNSS data analytics capability to verify and correct the positioning signals for the user. This will ensure Australian industry has access to world-leading software tools for positioning.
engaging existing and new industries and service providers to raise awareness of the opportunities positioning opens up for businesses through increased productivity, safety and innovation.
The NPI consists of the ground infrastructure to enhance accuracy to 3 centimetres by utilising signals from global navigation satellites and the mobile phone network across Australia.
(Image: Geoscience Australia)
“Our investment in this world-standard technology will have direct benefits including virtual fencing for farms and better management of cattle and livestock over vast distances,” Canavan said.
“It also has applications for regional aviation such as improved access to regional areas by enabling planes to land on smaller airstrips and navigate difficult terrain such as canyons.
“The increased reliability provided by better GPS will improve safety for aircraft flying into regional and remote aerodromes, such as the Royal Flying Doctor Service fleet.
It will reduce the impact of weather on flight cancellations and diversions, and improve the safety of landings.
“The resource sector will also benefit through better control of mine infrastructure, safety and more precise data for environmental rehabilitation.
“This is a practical investment to improve the lives of Australians and make businesses more productive.
This technology provides instant, reliable and accurate positioning information, anytime and anywhere around Australia.”
Digital Earth Australia.
A further $36.9 million is for Digital Earth Australia, a technology that will give Australian businesses greater access to reliable, standardized satellite data that identifies physical changes to the Australian environment.
“The practical benefits of this investment will extend across our economy.
This data will help researchers, governments and business better understand environmental changes, such as coastal erosion, crop growth and water quality,” Canavan said.
“For example, information drawn from satellites is vital to help graziers increase the capacity of paddocks and make their farms more viable and sustainable.
“Our investment in satellite imagery will ensure a range of Australian industries have access to data that can help them tailor their investments, create jobs in target regions and increase their competitiveness.”
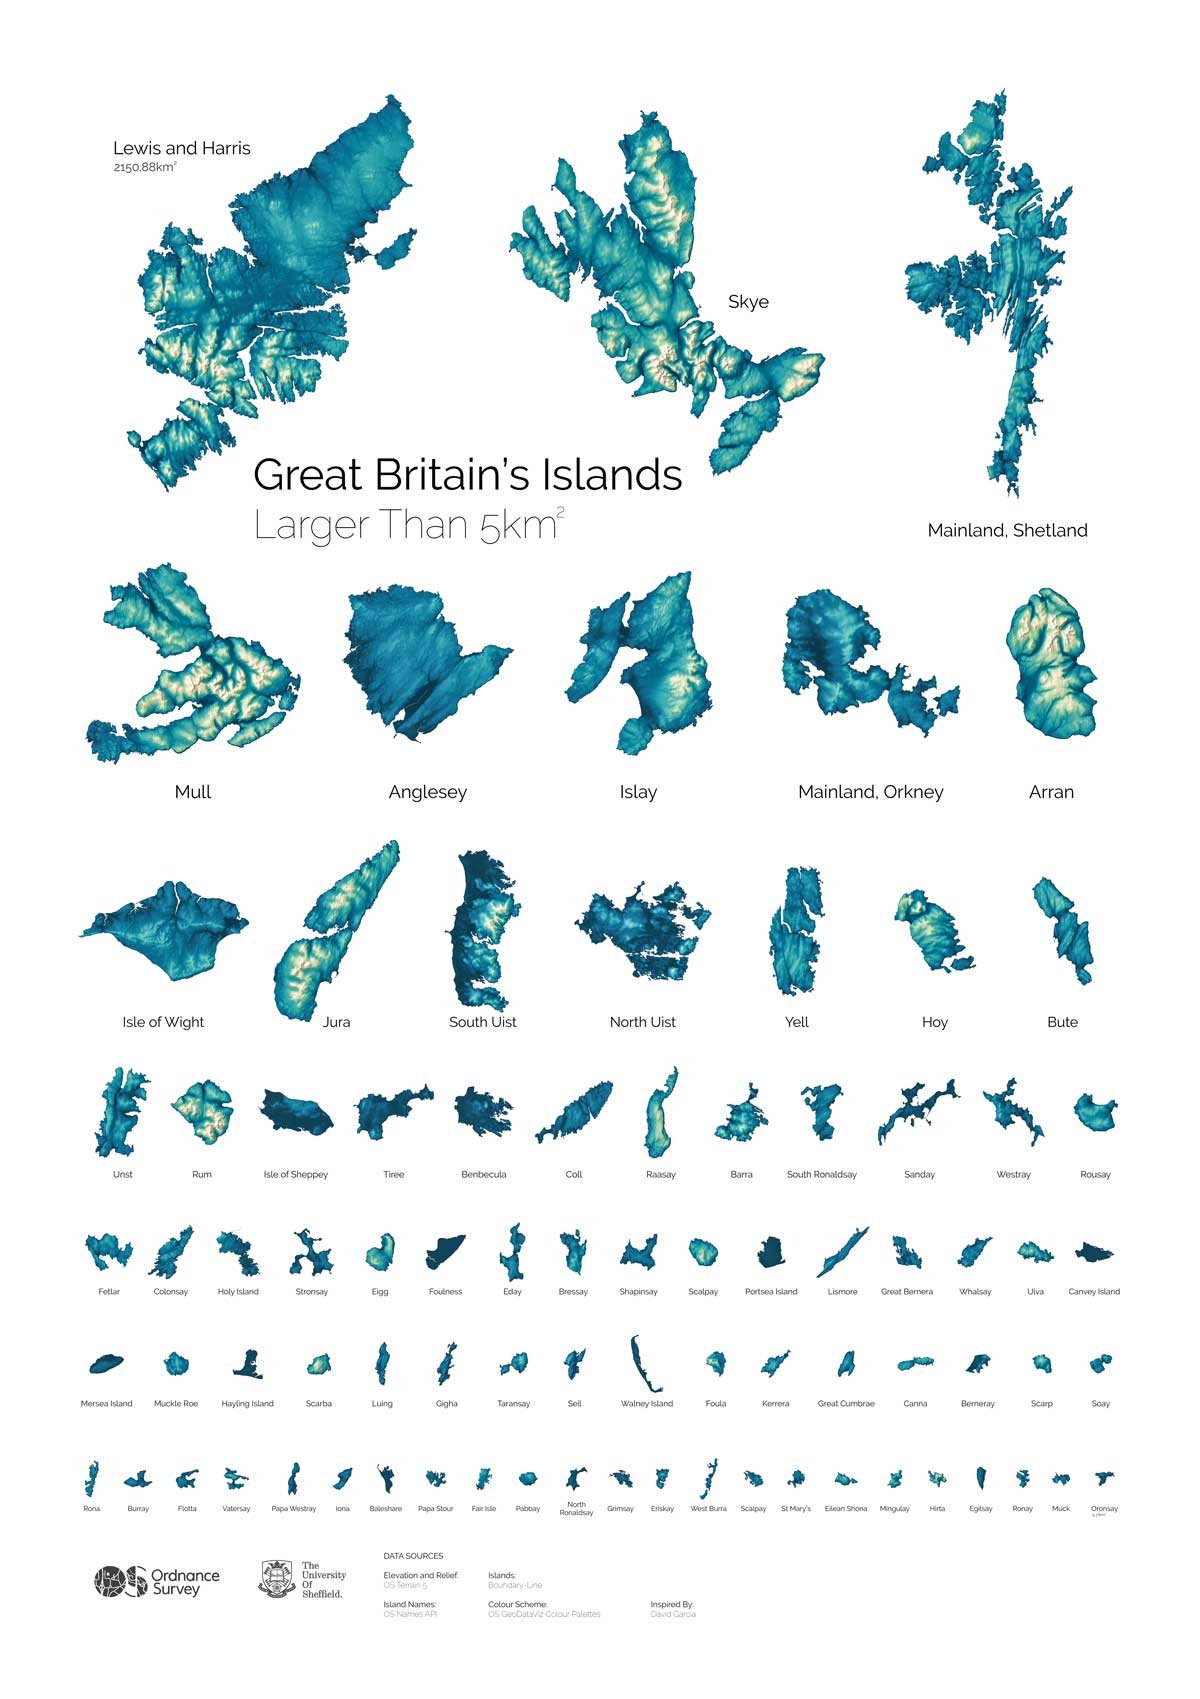
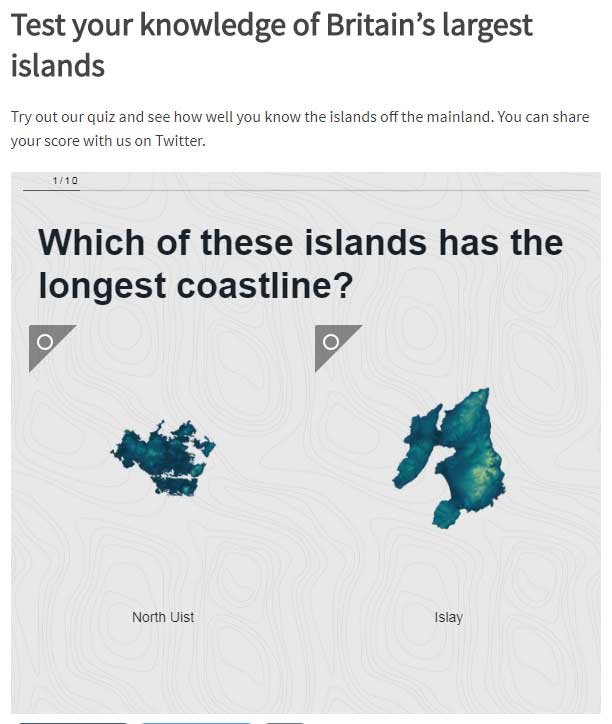
A University of Sheffield academic has worked with Ordnance
Survey to showcase the diverse geography and unique characteristics of
Britain’s largest islands.
Great Britain is an island in its own right, but aside from the
mainland there are hundreds of islands around the British coast, with
many uninhabited.
Biggest Scottish islands with the GeoGarage platform
Professor Alasdair Rae from the University of Sheffield’s Department
of Urban Studies and Planning worked with Ordnance Survey’s GeoDataViz
team to explore the 82 English, Scottish and Welsh islands that are
larger than 5km2.
Scotland – whose Parliament recently passed the Islands Bill to offer
greater protection and powers to its island communities – boasts the
most islands with 71, while Wales has just two entries and England nine.
The team used Ordnance Survey’s Boundary-Line data to define the area
and length of coastline for each island, with some interesting results.
Britain’s largest islands - 82 of them over 5km2, Scotland
boasts the vast majority with 71, not surprising when you consider the
Outer Hebrides, Shetland and Orkney and other beautiful islands off the
coast.
Wales had just 2 entries and England 9
Lewis and Harris topped the tables for being the largest island by
area – around 1.4 times the size of Greater London – and boasts the
longest coastline, but not all islands had such a correlation.
North Uist was the 12th largest island, but has the fifth longest
coastline.
Conversely, Arran was the eighth largest island but has the
18th longest coastline.
Adding in data from AddressBase, the GeoDataViz team compiled the
number of residential addresses on each island and realised that having
the largest area does of course not equate to having the most addresses.
Mull is the fourth largest island, but 18th when you look at addresses.
Portsea Island, which contains most of the city of Portsmouth, tops the
table for most residential addresses, but is 38th in the list of
islands by area.
Harta, Mingulay, Pabbay, Scarp and Taransay have no permanent residents.
The team has produced an ‘Islands Off Great Britain’ poster and a quiz where people can test their knowledge of the islands.
Professor Rae said: "Ordnance Survey was founded in 1791 and has been
a global leader in geographic data for over 225 years.
In 2010, it
released a huge tranche of its archives as open data, so that
scientists, planners, architects, geographers and others could benefit
through enhanced access to some of the best spatial data in the world.
“It's not always obvious how much data is out there, or what it
shows, so our 'Islands Off Great Britain' project is a way to highlight
the kinds of data available to users, and also learn something about the
geography of Great Britain.”
He added: "It was great to be involved in this project with Ordnance
Survey since it enabled me to work with one of our MSc in Applied GIS
graduates, Joe Harrison, and renowned cartographer and geovisualization
expert Charley Glynn. Working with these Ordnance Survey experts, it was
great to tap into the treasure trove of data they hold to try and tell a
simple story about Great Britain's islands, in a way that might draw
people's attention to the underlying data."
Facts and figures
Top 5 islands by area
1. Lewis and Harris
2. Skye
3. Mainland, Shetland
4. Mull
5. Anglesey
Top 5 islands by length of coastline
1. Lewis and Harris
2. Mainland, Shetland
3. Skye
4. Mull
5. North Uist
Top 5 islands by residential addresses
1. Portsea Island
2. Isle of Wight
3. Anglesey
4. Isle of Sheppey
5. Canvey Island
Masafumi Nagasaki is an 82 year old Japanese man who has lived
completely alone as a castaway for the last 29 years on Sotobanari
desert island (Iriomote Okinawa, Japan) This voluntary
Robinson Crusoe with his bright pink turban has spent all this time
living completely naked and surviving by himself. He has become the voluntary castaway who has lived the longest time on a desert island. The only wish of this survivor was to die on his desert island. But sadly the Japanese Authorities forced him to return to civilization last month :( Fortunately
we lived with him for 5 unforgettable days before he was kicked out,
and were able to share his life and carry out this fascinating
interview.
For nearly 30 years, Masafumi Nagasaki lived a life many of us extremely logged-on folks can only dream of.
Sotobanari island with the GeoGarage platform (NGA chart)
A life completely void of commuting, the internet, and screens.
He had the entire island of Sotobanari to himself—foraging, raking debris from the shore, and watching baby turtles hatch from their eggs and scurry to the ocean.
“Finding a place to die is an important thing to do,” Nagasaki told Reuters in 2012, “and I’ve decided here is the place for me.”
After abandoning conventional society (and clothing) in 1989, his only contact with civilization came during periodic trips to buy food and drinking water at a settlement an hour away by boat.
That is, until this April, when filmmaker Alvaro Cerezo says authorities forced Nagasaki “to go to a hospital with no hope of returning to his island.”
Cerezo, who spent five-days filming Nagasaki in 2014 for the above video, told news.com.au, “He was kicked out of the island, someone saw him on the island and it seems like he was weak.”
“They called the police and they took him back to civilisation and that’s it,” Cerezo continued.
“He couldn’t even fight back because he was weak. They won’t allow him to return.”
Nagaski told the filmmaker that decades ago he had often told his coworkers of his desire to escape, but he finally made the decision to go off the grid when he was flying from Fukuoka to Asake, and was disgusted by the pollution he saw spewing from the aircraft.
That’s when he realized he wanted to leave society behind.
He first moved to the island of Iriomote, but was disappointed by the presence of cars and tourists.
Then a fisherman suggested he try the deserted island of Sotobanari, and took him there.
Nagasaki fell in love and the fisherman left him on the island with a tent.
Nagasaki struggled at first, having no wilderness experience, but quickly learned survival skills. According to Cerezo’s blog, Nagasaki eventually “began to have empathy with the animals and to reject meat and fish.
That was when, for the first time in his life he felt the significance of happiness.”
Once a month, Nagasaki would go to a nearby island to buy food and water, using money that his sister sent him.
But he would only stay for a couple of hours.
According to Cerezo, Japanese authorities have been attempting to civilize Nagasaki for a while, offering to buy him a house and provide care.
“I don’t want to move from here. I will protect this island. I’d never be able to find a paradise like this,” Nagasaki told Cerezo in the documentary.
“Nothing sad can happen here. Once I saw a dead bird in the jungle. Then I felt pity—only that.”
On his island, Nagasaki was free of want.
He only had one desire.
“I’ve already told my family I will die here. My wish is to die here without bothering anyone,” he said in the film.
“I will die soon, probably in a few years. I want to be killed by a typhoon—so nobody can try to save me.”
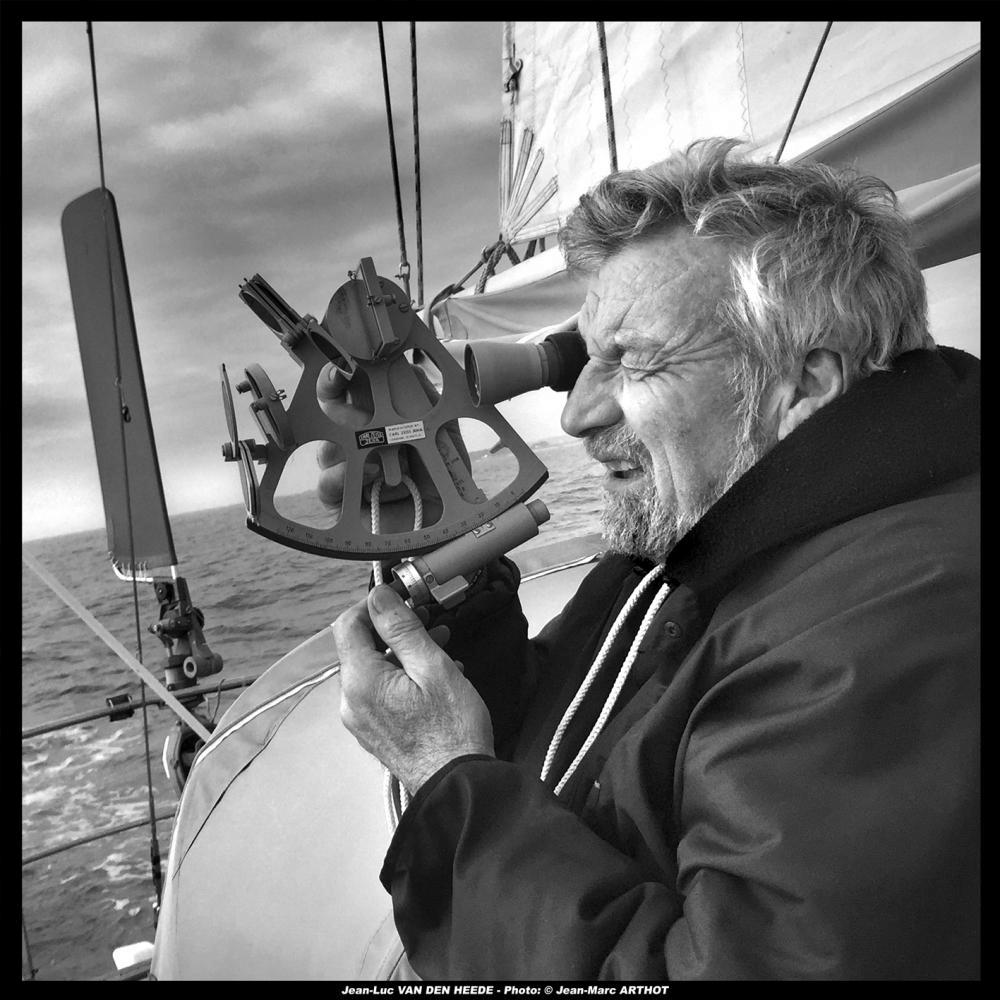
Sir Robin Knox-Johnston was the only one to finish of 9 starters and completed the voyage in 312 days.
He was in his 32 foot ketch Suhali.
The Sunday Times Golden Globe Race was a non-stop, single-handed, round-the-worldyacht race,
held in 1968–1969, and was the first round-the-world yacht race.
The
race was controversial due to the failure of most competitors to finish
the race and because of the suicide of one entrant; however, it ultimately led to the founding of the BOC Challenge and Vendée Globe round-the-world races, both of which continue to be successful and popular.
The race was sponsored by the BritishSunday Times
newspaper and was designed to capitalise on a number of individual
round-the-world voyages which were already being planned by various
sailors; for this reason, there were no qualification requirements, and
competitors were offered the opportunity to join and permitted to start
at any time between 1 June and 31 October 1968.
The Golden Globetrophy was offered to the first person to complete an unassisted, non-stop single-handed circumnavigation of the world via the great capes, and a separate £5,000 prize was offered for the fastest single-handed circumnavigation.
Nine sailors started the race; four retired before leaving the Atlantic Ocean.
Of the five remaining, Chay Blyth, who had set off with absolutely no sailing experience, sailed past the Cape of Good Hope before retiring;
Nigel Tetley sank with 1,100 nautical miles (2,000 km) to go while leading;
Donald Crowhurst,
who, in desperation, attempted to fake a round-the-world voyage to
avoid financial ruin, began to show signs of mental illness, and then
committed suicide;
and Bernard Moitessier,
who rejected the philosophy behind a commercialised competition,
abandoned the race while in a strong position to win and kept sailing
non-stop until he reached Tahiti after circling the globe one and a half times.
Robin Knox-Johnston
was the only entrant to complete the race, becoming the first person to
sail single-handed and non-stop around the world. He was awarded both
prizes, and later donated the £5,000 to a fund supporting Crowhurst's
family.

.jpg)


