Saturday, November 26, 2022

Building Bahrain

Building Bahrain
Building Bahrain
Bahrain is a small country with a big population.
Both have been growing larger in recent decades.
Since the early 1980s, the population of this island nation in the Persian Gulf has quadrupled. In 2022, it reached 1.5 million.
As population density has increased and urban development has spread, the need for land has grown.
“Like other countries in the [Persian] Gulf, rapid population growth and the simultaneous increase in urbanization, along with land scarcity, has pushed Bahrain to invest in mega land reclamation projects to extend its coastline,” said Eman Ghoneim, a physical geographer at the University of North Carolina Wilmington.
 
Visualization with the GeoGarage platform (UKHO raster map)
 
These images show changes across 35 years.
The first image was captured by the Thematic Mapper on Landsat 5 on August 17, 1987.
The second image, captured by the Operational Land Imager (OLI) on Landsat 8, shows the same area on August 17, 2022.
In 1987, Bahrain Island had just recently been linked to Saudi Arabia via the King Fahd Causeway, which opened in 1986.
In July 2022, a record 2.5 million motor vehicle passengers traveled on the 25-kilometer (16-mile) stretch of road, according to news reports.
 
Change is most apparent in the country’s north, where shallow coastal waters have made it technically and economically feasible to build new land from the seafloor.
Notice the areal expansion of existing islands, as well as the addition of new ones.
Sabah Aljenaid, a geographic information systems and remote sensing scientist at Arabian Gulf University, used Landsat images to classify changes to the land between 1986 and 2020.
Aljenaid and colleagues found that built-up (urban) areas dominated the changes during this period, increasing on average by 7.5 percent each year.
 
GB303790 ENC The Gulf - North Eastern Qatar and Ra's Tannurah(1:90,000)
 
BH51501B ENC  Mina' Salman and Approaches (1:12,0000)
 
BH51504B ENC  Approaches to Port of Sitrah (1:12,000)

The growth came primarily at the expense of vegetated land and wetlands.
Aljenaid pointed out the dramatic expansion of Muharraq Island, which now spans more than 60 square kilometers (23 square miles) northeast of Manama, the capital city.
She also pointed to changes on the island of Nabih Saleh, which has lost its agricultural areas.
While urban expansion has been focused in the north, parts of the southern coastline have undergone change, too.
Dredging for the artificial islands of Durrat Al Bahrain began in 2004; by 2007, about 5 square kilometers (2 square miles) of land had been added to Bahrain’s southeast coast.
“A decade ago, I wrote that 11 percent of the island of Bahrain is reclaimed land, and the growth continues today,” said John Burt, a marine biologist at New York University Abu Dhabi.
The shape of Bahrain in 35 more years remains to be seen.
“There was on-and-off again talk of building a bridge across Fasht Al Adhm to Qatar,” Burt said.
“It has not come to fruition, but it may be a future mega-development to watch out for.”

NASA Earth Observatory images by Lauren Dauphin, using Landsat data from the U.S. Geological Survey. Story by Kathryn Hansen.

Friday, November 25, 2022

NASA Study: rising sea level could exceed estimates for U.S. coasts


In the next few decades rising sea will lead to increased storm and tidal flooding for millions of Americans in coastal communities.
Norfolk, Virginia, is pictured here with an inundated roadway.

Credits: City of Norfolk

From NASA by Jane J. Lee

New results show average sea level rise approaching the 1-foot mark for most coastlines of the contiguous U.S. by 2050.
The Gulf Coast and Southeast will see the most change.

By 2050, sea level along contiguous U.S. coastlines could rise as much as 12 inches (30 centimeters) above today’s waterline, according to researchers who analyzed nearly three decades of satellite observations.
The results from the NASA Sea Level Change Team could help refine near-term projections for coastal communities that are bracing for increases in both catastrophic and nuisance flooding in coming years.

Global sea level has been rising for decades in response to a warming climate, and multiple lines of evidence indicate the rise is accelerating.
The new findings support the higher-range scenarios outlined in an interagency report released in February 2022.
That report, developed by several federal agencies – including NASA, the National Oceanic and Atmospheric Administration (NOAA), and the U.S.
Geological Survey – expect significant sea level rise over the next 30 years by region.
They projected 10 to 14 inches (25 to 35 centimeters) of rise on average for the East Coast, 14 to 18 inches (35 to 45 centimeters) for the Gulf Coast, and 4 to 8 inches (10 to 20 centimeters) for the West Coast.


An illustration of the Sentinel-6 Michael Freilich satellite.
Launched in November 2020, it is the latest in a series of spacecraft – starting with TOPEX/Poseidon in 1992 and continuing with the Jason series of satellites – that have been gathering ocean height measurements for nearly 30 years.
Credits: NASA/JPL-Caltech

Building on the methods used in that earlier report, a team led by scientists at NASA’s Jet Propulsion Laboratory in Southern California leveraged 28 years of satellite altimeter measurements of sea surface height and correlated them with NOAA tide gauge records dating as far back as 1920.
By continuously measuring the height of the surrounding water level, tide gauges provide a consistent record to compare with satellite observations.

The researchers noted that the accelerating rate of sea level rise detected in satellite measurements from 1993 to 2020 – and the direction of those trends – suggest future sea level rise will be in the higher range of estimates for all regions.
The trends along the U.S.
Southeast and Gulf coasts are substantially higher than for the Northeast and West coasts, although the range of uncertainty for the Southeast and Gulf coasts is also larger.
This uncertainty is caused by factors such as the effects of storms and other climate variability, as well as the natural sinking or shifting of Earth’s surface along different parts of the coast.

“A key takeaway is that sea level rise along the U.S. coast has continued to accelerate over the past three decades,” said JPL’s Ben Hamlington, leader of the NASA Sea Level Change Team and a co-author of both the new study and the earlier report.

Hamlington noted that the team wanted to determine if they could refine sea level estimates for communities facing imminent changes.
“We’ve been hearing from practitioners and planners along the coasts that they need more information on shorter timescales – looking not 70 or 80 years into the future, but looking 20 or 30 years into the future,” he said.
“The bottom line is that when looking ahead to what we might experience in coming years, we need to consider these higher possibilities.”


This image of Earth shows sea level measured by the Sentinel-6 Michael Freilich satellite in 2021.
Red areas are regions where sea level is higher than normal while blue indicates where it’s below normal.
The satellite collects measurements for about 90% of Earth’s ocean.

Credits: NASA Earth Observatory

Shift in High-Tide Flooding 
 
The hazards of rising sea level are amplified by natural variabilities on Earth.

For instance, by the mid-2030s, every U.S. coast will experience more intense high-tide floods due to a wobble in the Moon’s orbit that occurs every 18.6 years.
Hamlington said that this lunar cycle, in combination with rising sea level, is projected to worsen the impacts of high-tide flooding during the 2030s and 2040s.

Year-to-year variabilities such as the effects of El Niño and La Niña also can make it challenging to forecast how high and how fast sea levels will rise annually.
Hamlington said forecasts will continue to be refined as satellites contribute more data over time.


A visualization tool from NASA’s Sea Level Change Team makes data on future sea level rise from the Intergovernmental Panel on Climate Change easily accessible to the public.
Credits: NASA/JPL-Caltech
See visualization tool


NASA and France’s space agency Centre National d’Études Spatiales (CNES) started jointly flying satellite altimeters in the early 1990s, beginning a continuous space-based record of sea surface height with high accuracy and near-global coverage.
That legacy continues with 2020 launch of the joint U.S.- European Sentinel-6 Michael Freilich mission and its altimeter, which will provide scientists with an uninterrupted satellite record of sea level surpassing three decades.
The mission is a partnership between NASA, NOAA, ESA (European Space Agency), the European Organisation for the Exploration of Meteorological Satellites, and CNES.

NASA sea level researchers have long worked to understand how Earth’s changing climate affects the ocean.
Along with launching satellites that contribute data to the long global record of sea surface height, NASA-supported scientists look to understand the causes of sea level change globally and regionally.
Through testing and modeling they work to forecast how much coastal flooding U.S.
communities will experience by the mid-2030s and provide an online visualization tool that enables the public to see how specific areas will be affected by sea level rise.
Agencies at the federal, state, and local levels use NASA data to inform their plans on adapting to and mitigating the effects of sea level rise.

Learn more about sea level and climate change:
https://sealevel.nasa.gov/
 
Links :

Thursday, November 24, 2022

The tragic story of the Edmund Fitzgerald, whose crew was never seen again

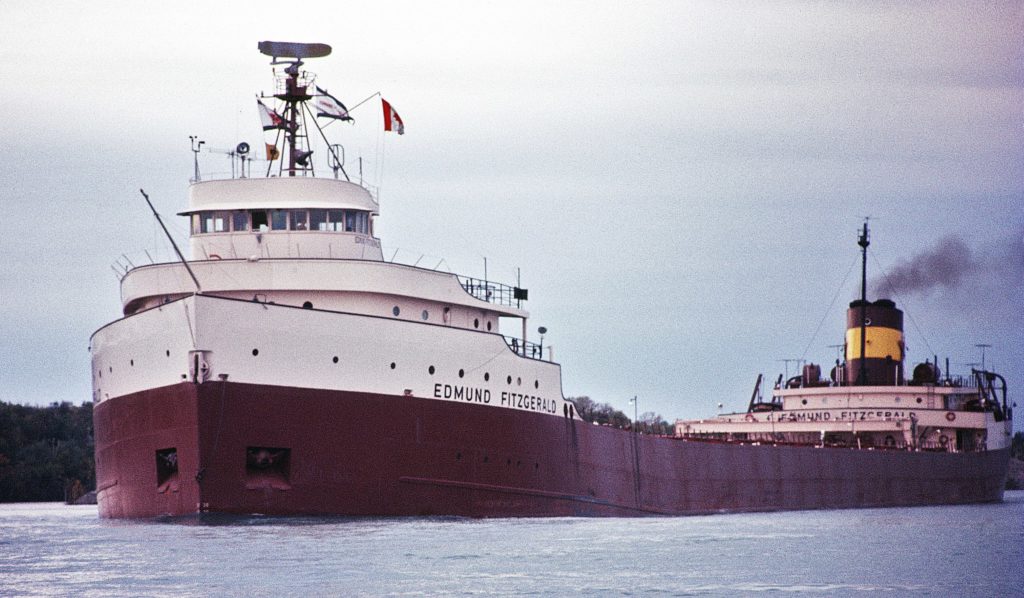
The Edmund Fitzgerald was lost with her entire crew of 29 men on Lake Superior November 10, 1975, 17 miles north-northwest of Whitefish Point, Michigan.
Whitefish Point is the site of the Whitefish Point Light Station and Great Lakes Shipwreck Museum.
 
From History Defined
 
The Edmund Fitzgerald was a ship that carried cargo across the Great Lakes for over two decades.
Then, on November 14, 1975, the boat sank in a violent storm, taking 29 crew members on board.
The disaster has been the subject of numerous songs and articles and remains one of the most tragic accidents in maritime history.

In this article, we will take a closer look at the story of the Edmund Fitzgerald and explore why its sinking fascinates us all these years later.
 
The Story of The Edmund Fitzgerald: The History

The Edmund Fitzgerald was a Great Lakes freighter that sank in a storm on November 14, 1975, and few understand what happened to cause the freighter to sink.

The ship was carrying a cargo of iron ore pellets weighing about 26,100 tons, and it left from Superior, Wisconsin, heading to the steel mill on Zug Island.
The trip was nothing special, and it was a routine run that the ship had done many times in its 17-year run.
There should have been nothing about the trip that the ship couldn’t handle with its advanced radar and technology.
The trip came at the end of the year, right when the weather was getting colder and the waves were getting higher.

The Edmund Fitzgerald was one of the largest ships on the Great Lakes at the time, measuring 729 feet long, 39 feet tall, and 75 feet wide.
Quite literally, the ship was barely able to pass through the Saint Lawrence Seaway.
It was built with a double-hull design to protect against sinking, and it had a crew of 29 experienced sailors.

This ship was designed to carry these taconite (iron) pellets to ironworks from Duluth to places like Detroit and Toledo.
Still, many are puzzled at how this gigantic boat could have sunken like that when it was made to withstand any water conditions.

Word of an approaching storm from the National Weather Service was announced a gale warning for Lake Superior.

How Storms Affect Lakes And What That Means For Ships

The exciting thing about Lake Superior is that it takes a lot to create big waves.
Even when there are big waves, they don’t usually last long.

The problem with this particular storm was that it was a bit different than typical storms that pass through the area in November and the freighter was in the wrong place at the wrong time.
Ultimately, the storm would generate hurricane-force winds and waves on Lake Superior that would reach approximately 25-35 feet high.
That wouldn’t have been such a problem for the Fitzgerald had the storm not moved consistently and changed the direction of the wind.

The crew altered their course to have land protect them from the giant waves of a storm, but the storm moved and put the freighter directly in the path of the storm and its waves.
Considering the physical size of Lake Superior, storm conditions can be pretty treacherous on the Great Lakes.
Generally, storms can produce steep, short-period waves, which are hazardous to large ships like the Fitzgerald.

But why specifically are waves like this dangerous for larger vessels?
To understand the importance of waves and possibly what happened to Fitzgerald, we need to discuss the concept of waves.
 
How The Great Lakes Can Sink Ships

It’s estimated that over 6,000 ships and 30,000 lives have been lost in the Great Lakes over its history due to how the Lakes affect ships.

Modern vessels can experience these types of dangers in the Great Lakes:
  • Cresting Failure: Cresting is when the wave lifts the ship from its middle.
If a boat is caught in a cresting failure, it can cause the vessel to hog.
Hogging is when the waves make the ship bend in the middle, and if it’s bad enough, it can snap the ship in two.
  • Ploughing: Ploughing is when the ship’s bow digs into the wave wall in front of it; this can cause the vessel to take on more water and get swamped.
  • Ploughing to Ground Strike: This is a more extreme version of ploughing, which happens when the ship’s bow strikes the bottom of the lake.
If this happens, it can cause the boat to sink.
  • Bottoming: Giant waves increase the chances of a ship hitting the bottom of the lake.
When this happens, it can damage the hull and cause leaks.
  • Wave-Spanning: Wave-spanning occurs when a ship is caught between two waves
When this happens, it can cause the boat to snap in half.
The phenomenon is worse in the Great Lakes because freshwater waves are spaced closer.
  • Swamping: Swamping is when a large amount of water comes over the side of the ship, and it can cause the boat to sink.
Especially low ships are at risk of swamping.

The Storm And The Sunken Ship

It was a typical November that year, but around the 8th, storms were forecasted to be in the Fitzgerald’s direct path, and so as the storms grew stronger and approached the Fitzgerald’s planned route, they learned they might have to change course.

This wasn’t a problem as the route would take them north toward the coast of Canada; the northern way would protect them from the massive waves generated by the storm.
Generally, a course change would be all that was necessary, but this storm wasn’t typical.
Unfortunately, the storm constantly moved, changing the wind direction and the waves heights.

By the time the freighter had made it to Whitefish Bay, they were forced to take a more southerly route which put them in danger of the giant waves.
The waves were so big that they started breaking over the ship’s decks, and the water washed over them.

By the time conditions had worsened, the ship had lost a rail, two ventilators, and a radar array.
Eventually, the Fitzgerald lost both radars and was sailing blind.
To make matters worse, the ship was listing to one side and taking on heavy water, more than the two bilge pumps could remove.

Throughout the developing storm, the Fitzgerald communicated with other ships in the area, namely the Anderson and Avafor.
In the late afternoon, the Fitzgerald contacted the Avafor and mentioned that their boat was damaged, naming off the damages and commenting on the dire conditions of the water.

Around 7 PM that evening, the Anderson contacted the Fitzgerald again, noting their location on their radar.
When asked how they were doing, the Fitzgerald responded, “We are holding our own.”
Shortly after, the Anderson lost them on the radar, and no one could contact them.
Unfortunately, the Fitzgerald had quickly sunk, with the crew most likely not realizing the true seriousness of their damage.
The team made no distress call, nor were rescue operations attempted.

A Marine Casualty Report by the United States Coast Guard later determined some factors contributing to the freighter’s sinking.
 
Localization of the wreck on the GeoGarage platform (NOAA raster chart)
 
The Report

The Marine Board of Investigation’s Casualty Report found that the freighter had sunk because of a series of factors, including: The load line may have been lower than seasonally appropriate: When a ship is loaded with cargo, it rests on the water at a certain level, referred to as the load line.
Leaking Hatchways: The cargo was always loaded through a top-side hatchway during the load process.
On October 31, routine damage was noted during an inspection and was scheduled for repair after the shipping season.

The Fitzgerald likely took on the water with these contributing factors when the waves broke over their decks.
The extra weight from the water and the cargo probably caused the ship’s bow to dive into a wave wall and take on too much water.
The load likely rushed forward, plowing the bow into the bottom of the lake and disintegrating the ship.

It’s highly likely that the ship snapped in two and sank quickly, which would have made no time for distress calls or rescue operations.
Upon further inspection, it seems that the lifeboats were ripped from their racks, which is why the remains of two lifeboats were found in the wreckage.

The Sinking Was Likely Preventable


The sinking of the Edmund Fitzgerald is often referred to as a “perfect storm” because all of the conditions had to line up for it to happen.

However, a series of preventable errors and bad luck resulted in the ship’s sinking.
At the same time, November is a difficult time for shipping in this area due to the season shift of the polar jet stream.
Approximately 40% of all Great Lakes shipwrecks occurred in November.

The ship needed repairs that were never made, the load line may not have been appropriate for the season, and they were sailing in an area known for its danger.
While the crew did everything they could to save the ship, in the end, it wasn’t enough.

The Edmund Fitzgerald now rests at the bottom of Lake Superior, and the Coast Guard never recovered its crew.
The story of the Edmund Fitzgerald is a tragedy, but it’s also a reminder of the dangers of shipping on the Great Lakes.

In addition, the mystery of the freighter’s sinking inspired a song by Gordon Lightfoot, which only adds to the legend of this ship.
 
Links :

Wednesday, November 23, 2022

Tonga eruption confirmed as largest ever recorded


Tsunamis and shockwaves hit continents on the other side of the Pacific.
The Hunga-Tonga Hunga-Ha'apai (HT-HH) volcano was like a massive shotgun blast from the deep, generating the biggest atmospheric explosion recorded on Earth in more than 100 years.

From NIWA

Hunga-Tonga Hunga-Ha'apai (HT-HH) emitted the biggest atmospheric explosion recorded on Earth in more than 100 years.

New Zealand's National Institute for Water and Atmospheric Research (NIWA) has discovered that almost 10km3 of seafloor was displaced – the equivalent to 2.6 million Olympic-sized swimming pools and a third more than initial estimates – with two-thirds coming from the summit and the rest from the surrounding flanks.

Three-quarters of this material was deposited within 20km of the volcano.
This leaves almost 3.2km3 unaccounted for.

 
Earlier this year, a volcano in the South Pacific erupted so ferociously that it was heard from AK, 6,000 mi away.
It unleashed a global tsunami and atmospheric pressure waves that zipped around Earth.

The project leader, NIWA marine geologist Kevin Mackay, said this missing debris could be partly explained by aerial loss.
“This is why we didn’t notice the loss until we had mapped everything.
The eruption reached record heights, being the first we’ve ever seen to break through into the mesosphere.
It was like a shotgun blast directly into the sky.
The volume of this ‘shotgun’ plume is estimated to be 1.9km3 of material, which has been circulating in our atmosphere for months, causing the stunning sunsets we saw following the eruption.
This goes some way to explaining why we’re not seeing it all on the seafloor,” said Mackay.

Despite the huge displacement of material, the volcano’s flank remains surprisingly intact.
However, the caldera, or crater, is now 700m deeper than before the eruption.

Further evidence from the caldera shows signs that HT-HH is still erupting.
A robot boat remotely operated from the UK by SEA-KIT International detected active venting from newly formed cones, explaining why glass fragments formed from cooled molten lava were picked up during NIWA’s earlier survey.


NIWA scientists have also unravelled one of the biggest unknowns of the eruption – the pyroclastic flows.
Pyroclastic flows are currents made up of dense lava, volcanic ash, and gases which can reach temperatures of 1,000°C and speeds of 700km/hr.

NIWA collected 150 sediment cores which were sent to New Zealand’s University of Otago and the National Oceanographic Centre in the UK for analysis.
These samples showed pyroclastic deposits some 80km away from the volcano.
But Dr Emily Lane, NIWA Principal Scientist - Natural Hazards, believes they could have travelled even further.
“Eighty kilometres was the end of our survey range, but the pyroclastic flows appear to extend beyond that distance, perhaps as far as 100km away.
They are also what caused both the domestic and international communications cables to break, with the domestic cable now being buried under 30m of eruptive material.
“The sheer force of the flows is astonishing - we saw deposits in valleys beyond the volcano, which is where the international cable lies, meaning they had enough power to flow uphill over huge ridges and then back down again,” said Dr Lane.

On land, the heat from pyroclastic flows creates a frictionless boundary layer which allows them to move so rapidly, like how a puck glides on an air hockey table.


However, Mackay says this is the first time that scientists have observed underwater pyroclastic flows of this magnitude.
“It’s the interaction with water that made this event so unprecedented.
It’s still speculation but the latest science shows that this phenomenon may be more exaggerated under water.
This could be why the pyroclastic flow travelled so far and with such force,” he said.

When heated, water can expand to around 1,000 times its volume.
When you get several km3 of hot magma instantly hitting the cold saltwater, this reaction is supercharged, and all that energy must go somewhere – and the only options are to explode up or sideways out of the volcano.

“While this eruption was large – one of the biggest since Krakatoa in 1883 – there have been others of similar magnitude since then that didn’t behave in the same way.
The difference here is that it’s an underwater volcano and it’s also part of the reason we got such big tsunami waves,” said Mackay.


Volcanic eruption size comparison to HTHH.
[Image: NIWA-Nippon Foundation TESMaP / Lana Young and Mark Tucker]


Dr Lane said that because these volcanos are not just found in the Pacific, but the world over, we must know what happened and why it was so violent.

“The pressure anomaly generated by this eruption supercharged the tsunami so that it was able to travel right across the Pacific and world-wide.
This mechanism meant that it could travel further and faster than our warning systems expected.
The Krakatoa eruption was that last time a volcanic tsunami on this scale occurred,” she said.

The significant reshaping of the seafloor also had dramatic effects on ecosystems in the region.
There was little sign of any animal life on the flanks of the volcano, in deeper water channels, and most of the surrounding seafloor.
However, there were patches of abundant life that had survived the eruption on several seamounts, giving hope for recovery.

This work was done by the NIWA-Nippon Foundation Tonga Eruption Seabed Mapping Project (TESMaP).

Supported by The Nippon Foundation, NIWA and SEA-KIT surveyed over 22,000km2 surrounding the volcano, including mapping 14,000km2 of previously unmapped seafloor as part of The Nippon Foundation GEBCO Seabed 2030 project, which aims to map the world’s oceans by the end of the decade.


Hunga Tonga-Hunga Ha'apai 3D bathymetry map.
[Photo: NIWA-Nippon Foundation TESMaP]


Mitsuyuki Unno, Executive Director of The Nippon Foundation said that this work is vital to understand the science behind these types of events.
“The research has made clear that underwater volcanic eruptions have serious implications for coastal communities around the world.
A huge proportion of the Earth’s population live on the coast, which are already vulnerable to the impacts of climate change, sea level rise, and big storms.
We need to further our understanding of the risks from underwater volcanos so we can better prepare and protect future generations and their ecological environments.”

Jamie McMichael-Phillips, Project Director of The Nippon Foundation GEBCO Seabed 2030 project said that this project highlights the benefits of working in collaboration to collect fundamental knowledge of the ocean seabed.
“TESMaP is a fantastic testament to what can be achieved if we all come together in pursuit of scientific research.
A complete map of the ocean floor is a necessity to protect our planet in line with the UN SDGs and our Seabed 2030 partners play an invaluable role in helping us realise our goal - as demonstrated by the truly collaborative nature of TESMaP."

Ben Simpson, CEO of SEA-KIT said that their technology allowed scientists to undertake a dangerous and vital mission.
“We have been able to add new equipment to our proven X-Class Uncrewed Surface Vessel’s survey platform, such as winch and sensor cage towing capability, showing yet again the potential of uncrewed vessel technology to support and develop our understanding of the ocean.
USV ‘Maxlimer’ provided a low risk, non-invasive survey solution for this challenging location, bringing down both risk and costs and reducing carbon emissions.”
 
Links :

Tuesday, November 22, 2022

Mhairi Killin: ‘Boat noise, seal deterrents, sonar – the sea is an industrialised soundscape’


From The Guardian by Patrick Barkham

The artist spent 10 days sailing with scientists to listen for the impact of sonar on cetaceans.
In her new collaborative exhibition, she uses whale bones, sound recordings, video and poetry to probe our relationship with the creatures

 
The tides that bind … Mhairi Killin examines our relationship with the sea and its creatures.
Photograph: Shannon Tofts


When a dead whale washed ashore on the Hebridean island of Iona in the summer of 2018, artist Mhairi Killin was as intrigued as many other islanders.
“It’s a beauty spot and people walk there regularly – it wasn’t long before there was a bit of a buzz around the island that there was a whale,” she says.
“That’s been the same since prehistory, when a whale ashore would be a source of food and oil and bone for artefacts.”

Why the whale had died was a mystery, which deepened that autumn when it was revealed to be one of more than 100 carcasses of mostly Cuvier’s beaked whales found on the west coasts of Scotland and Ireland.
Scientists began investigating if military sonar could be responsible, giving Killin the subject for a new collaborative exhibition, which opens on the Isle of Mull this summer.

On Sonorous Seas uses whale bones, sound recordings, video, poetry and objects derived from the stranded whales to examine the clash between our veneration for these enigmatic mammals and the way we increasingly fill oceans with noise – and sonar in particular.

Killin, who has lived on Iona for 25 years, believes our fascination with whales comes from their mystery but also a sense of kinship.
“We are connected to these non-human beings,” she says, “but because they are rarely sighted, there’s a mystery attached to them and their underworld.
When there’s an opportunity to have a fragmentary connection to these creatures who were our ancestors, there’s an element of wonder, mystery and awe.”

Beaked whales are some of the least-known mammals on the planet, breathing like us and yet capable of enduring depths of 3km, chasing squid in the dark ocean.
In such blackness, the species is utterly dependent on sound to navigate, find food and communicate.
These whales are rarely seen alive and yet they make up a wealth of marine life off Scotland’s coast, an area of global importance for cetaceans where 24 species exist, more than a quarter of the whale and dolphin species found worldwide.

Killin’s exhibition, which includes collaborations with Glasgow-based musician Fergus Hall and Mull-based poet Miek Zwamborn, is founded on a research trip she took with the Hebridean Whale and Dolphin Trust (HWDT) last year to discover the impact of sonar on cetaceans.
For 10 days, she sailed with scientists, listening intently to a hydrophone towed behind the small boat recording the sounds of the sea.

“Globally, whale and dolphin populations are facing huge pressures in the marine environment,” says Alison Lomax, chief executive of HWDT.
“The same kinds of problems – busy, noisy, polluted seas – are also a problem in Scottish waters.
These animals are incredibly sensitive to noise, and the increase in noise across our seas is a concern.”

Twice each year since 2008, the HWDT undertakes a survey at the same time as Exercise Joint Warrior, the largest military exercise in Europe, which occurs in the North Atlantic off Scotland.
The charity is gathering long-term data on sounds and sightings to understand how military sonar from submarines in particular might damage cetacean life.
We understand the military has to carry out its exercises.
So how can these values overlap in a way that's not damaging?

For one minute every 15 minutes over eight hours, Killin would listen to the hydrophone.
“It was an incredibly informative – I would say transformative – exercise in deep listening,” she says.
“I heard a dolphin whistle and snapping shrimp, tiny organisms that create noise like frying bacon.” But she was also surprised by how much anthropogenic sound she detected.
“I heard boat noise, seal deterrents around fish farms, and lots of sonar.
The sonar was very present – we could hear it without putting the headphones on,” she says.
“The sea is an industrialised soundscape.”

Killin saw killer whales – and also encountered naval warships.
During a military exercise, GPS in the area would be temporarily jammed.
“We were in a 19-metre sailing boat managing a 30mph wind and our GPS was jammed and we were radioed by one of the military ships and told to turn around and get out of the area.” A military helicopter later buzzed them, but Killin didn’t consider this intimidation.
“We were in their space, that was all,” she says.

Unfortunately, the military is sometimes in the whales’ space – and frequency – as well.
Mid-frequency active sonar is exactly the frequency range that the deep-diving beak whales need to hear.

Andrew Brownlow, director of the Scottish Marine Animal Stranding Scheme, helped investigate the mass stranding of 2018.
“The impact of noise on marine animals is not something that’s easy to detect, either from the examination of living animals or the examination of bodies,” he says.
Postmortem techniques can detect physical changes to whale ears and ear cells, while physiological changes such as bubbles of nitrogen dissolved in the blood may reveal noise-induced damage.
One way in which sonar could cause whale mortality is by frightening whales so they swim to the surface too quickly, causing potentially fatal decompression sickness, as human divers experience.

Brownlow points out that the correlation between mass strandings of deep-diving mammals and naval activity: the Canary Islands was once a hotspot for strandings but they ceased in 2004 after a moratorium on nearby naval exercises.

In the 2018 Scottish and Irish stranding, the bodies of the beaked whales were too decomposed to offer many clues about cause of death, but scientists studied winds and currents to deduce that the animals came from an Atlantic area known as Porcupine Bank, full of underwater valleys and particularly rich in marine life.
Such undulating underwater terrain is also a favoured location for hiding submarines – and is used for military manoeuvres by many nations, including Russia.

Last year, the Navy admitted it was operating in the area at the time the whales were stranded and said it acknowledged the risks that active sonar posed to marine life, funded research into this and took precautions to minimise risks.
Strategies to stop loud sonar damaging whales could be to start any sound quietly before increasing the volume so the animals are warned.
Brownlow, who praises the Ministry of Defence for engaging with scientists, says such measures may be impractical “in the theatre of war”.

Killin is keen to draw our attention to the wonder of whales but her exhibition does not seek to draw a binary conclusion – “military bad, whales good”.
“We understand the military has to carry out its exercises.” she says.
“So how can these two sets of values overlap in a way that is not damaging? That’s what the work is about.
I’m trying to bring people into the complexity of this issue.
This is what artists can do – help us observe in a different way and perhaps gain a different perception of things.”


Monday, November 21, 2022

How a plucky robot found the long-lost Endurance shipwreck


Photograph: James Blake/National Geographic

From Wired by Matt Simon  

Over a century ago, two dozen men were stranded in Antarctica.
Here’s how a robot dove 10,000 feet to glimpse their lost ship for the first time.

In late 1914, explorer Ernest Shackleton and 27 crewmen sailed into the icy waters around Antarctica.
Their state-of-the-art ship Endurance stretched 144 feet, with three towering masts, its hull ultra-reinforced to resist crumpling in the floating ice.
The crew’s plan was to hike across the frozen continent, but the sea had other ideas.

Endurance got stuck off the coast and was slowly crushed by the floating ice, forcing the men into one of the most famous feats of survival in history.
(Do yourself a favor and immediately read Alfred Lansing’s book on the expedition.) They endured for over a year, scurrying across ice floes to hunt penguins and seals, before reaching an uninhabited island.
From there, Shackleton and a small party sailed 800 miles in a little boat rescued from the Endurance, made land on the island of South Georgia, and hiked to a whaling station, then returned by ship to pick up the rest of the crew.

Over a century later, scientists have now used another state-of-the-art vehicle to finally glimpse the long-lost wreck of the Endurance.
Dangling from an icebreaker in Antarctica’s Weddell Sea, an underwater robot called Sabertooth dove almost 10,000 feet, painting the seafloor with blasts of sonar that betrayed the unmistakable form of a ship.
Switching to the robot’s cameras, the crew captured video of a stunningly well-preserved wooden vessel.

“It's a huge achievement—from the historical point of view—for the story of Shackleton and his crew, as well as an extremely strong achievement from the technology point of view, because it was probably one of the most complicated shipwrecks to discover,” says Nico Vincent, subsea project manager of the expedition, which was organized by the Falklands Maritime Heritage Trust.


Photograph: Nick Birtwistle/Falklands Maritime Heritage Trust

That’s thanks to Antarctica’s notoriously bad weather and thick, unpredictable ice, which was trying its best to make life miserable for the expedition’s icebreaker, the S.A. Agulhas II.
It wasn’t so much that anyone was worried about the icebreaker meeting the same fate as the Endurance.
(“Believe me, she is a marvelous vessel,” says Vincent.
“I never saw an icebreaker steaming at more than 8 knots in the middle of 1.5-meter-thick ice.”) It was more that chunks of floating ice would make it impossible to lower the 12-foot-long robot (it’s shaped a bit like a sled) or might cut its thin fiber-optic tether to the boat.
So the researchers used satellite data to predict the movement of ice around them, and, once Sabertooth was in the water, the icebreaker’s pilot used propeller blasts to keep the sea around the vessel open.

Photograph: Falklands Maritime Heritage Trust/National Geographic

Sabertooth’s tether makes it unlike other Antarctic ocean robots, which tend to be fully autonomous; scientists give them orders to explore a certain area on their own.
(It’s similar to the reason why Mars rovers are autonomous.
Signals take way too long to get back and forth from the Red Planet, and radar communications don’t penetrate seawater.)
But Sabertooth is a hybrid robot, meaning that while it can autonomously roam the Antarctic seafloor, its operators can assume control as needed.
That tether can’t provide power to the robot, since that would thicken the line and make it more prone to getting pushed around by currents.

The researchers knew roughly where to look because Endurance’s captain had logged the ship's last location.
But he did so with early 20th-century methods, which were less precise than today’s GPS.
So the explorers programmed Sabertooth to wander, scanning the bottom of the Weddell Sea while a sonar analyst aboard the icebreaker parsed the data in real time.

And then it arrived: the unmistakable form of a shipwreck.
(Unmistakable, at least, to a trained sonar analyst.)
“You cannot imagine the faces of the people when we saw the Endurance for the first time,” says Vincent.

But as bad luck would have it, there was only a minute left on the robot’s battery.
“Immediately, we interrupted the dive to come back to the surface and recharge,” he says.
No matter—the scientists had finally located one of history’s most legendary shipwrecks.
When they returned with the recharged Sabertooth to get more footage, they found an astonishingly well-preserved wooden ship.

The Antarctic Treaty protects this shipwreck as a historic site and monument, so the explorers could only look, not touch.
But the images speak volumes.
In the video above, you can clearly see the ship’s name splayed across the stern, one of the broken masts, and even the wheel.

Ironically enough, the harshness of the Antarctic seas both sank Endurance and preserved it like no other shipwreck.
A vessel made of wood is supposed to quickly rot, thanks to microbes and critters called shipworms, which grow up to 5 feet long as they chew through wood.
But Antarctica is devoid of trees, which means there aren’t organisms in its surrounding waters that have evolved to break wood down for nutrients.

Vincent has been at this kind of work for decades and has seen hundreds of shipwrecks, but none quite like this.
“The level of preservation of this wreck is absolutely, absolutely gorgeous. It's like she sunk yesterday,” says Vincent.
“This is something that we see one time in a life—only one time. Incredible.”

Links :
 

Sunday, November 20, 2022

Admiral's Cup 1973

(20 Aug 1973) The Admiral's Cup Series ends with the Fastnet Race and overall victory.