Saturday, November 22, 2014

Planet Earth & Solar time-lapse


A timelapse of Earth in 4K resolution, as imaged by the geostationary Elektro-L weather satellite, from May 15th to May 19th, 2011.
Elektro-L is located ~40,000 km above the Indian ocean, and it orbits at a speed that causes it to remain over the same spot as the Earth rotates.

The satellite creates a 121 megapixel image (11136x11136 pixels) every 30 minutes with visible and infrared light wavelengths.
The images were edited to adjust levels and change the infrared channel from orange to green to show vegetation more naturally.
The images were resized by 50%, misalignments between frames were manually corrected, and image artifacts that occurred when the camera was facing towards the sun were partially corrected. The images were interpolated by a factor of 20 to create a smooth animation.

Our home planet on the day of the Autumnal Equinox.

To answer frequently asked questions; why are city lights, the Sun, and other stars not visible?
City lights are not visible because they are thousands of times less bright than the reflection of sunlight off the Earth.
If the camera was sensitive enough to detect city lights, the Earth would be overexposed.
The Sun is not visible due to mechanisms used to protect the camera CCD from direct exposure to sunlight.
A circular mask on the CCD ensures that only the Earth is visible.
This mask can be seen as pixelation on Earth's horizon.
The mask also excludes stars from view, although they would not be bright enough to be visible to this camera.


The surface of the sun from October 14th to 30th, 2014, showing sunspot AR 2192, the largest sunspot of the last two solar cycles (22 years).
During this time sunspot AR 2191 produced six X-class and four M-class solar flares.
The animation shows the sun in the ultraviolet 304 ångström wavelength, and plays at a rate of 52.5 minutes per second.
It is composed of more than 17,000 images, 72 GB of data produced by the solar dynamics observatory (http://sdo.gsfc.nasa.gov/) + (http://www.helioviewer.org/).

The animation has been rotated 180 degrees so that south is "up".
The audio is the 'heartbeat' of the sun, processed from SOHO HMI data by Alexander G. Kosovichev. Image data courtesy of NASA/SDO and the AIA, EVE, and HMI science teams.

Image processing and animations by James Tyrwhitt-Drake. 
This animation has be rendered in 4K, and resized to the YoutTube maximum resolution of 3840×2160.

Friday, November 21, 2014

Brazil DHN update in the Marine GeoGarage

As our public viewer is not yet available
(currently under construction, upgrading to Google Maps API v3 as v2 is officially no more supported),
this info is primarily intended to our Phone/iPad universal mobile application users

(Marine Brazil on the App Store)
and also to our B2B customers which use our nautical charts layers 

in their own webmapping applications through our GeoGarage API.

 DHN coverage

1 charts has been updated and 6 charts have been added since the last update

DHN update September 26, 2014

  • 305  DA ILHA DO CAPIM À ILHA DA CONCEIÇÃO
  • 4361  DA BAÍA DO MARAPATÁ À ILHA DO JOROCAZINHO
  • 4362  DA ILHA DO JOROCAZINHO A MOCAJUBA
  • 4363  DE MOCAJUBA À ILHA ARARAIM
  • 4364  DA ILHA ARARAIM À ILHA DA RAINHA
  • 4365  DA ILHA DA RAINHA A MURU
  • 4366  DA ILHA TAUÁ A TUCURUÍ

Today 442 charts (506 including sub-charts) from DHN are displayed in the Marine GeoGarage
Don't forget to visit the NtM Notices to Mariners (Avisos aos Navegantes)

Living under sea: Japanese visionaries unveil underwater city plan

Illustration of the whole complex,
from the sphere just beneath water's surface to the research station beneath the seabed.
(Shimizu Corp.)

From Washington Post by Ishaan Tharoor

It's the next frontier: Not long after scientists landed a probe on a comet millions of miles away in deep space, a Japanese construction company has announced that it wants to go in the other direction.
Shimizu Corp. revealed blueprints for an astonishing undersea city: a vast research and residential station some 10 miles in length that begins just below the sea's surface and burrows beneath the ocean floor.

 A full model of “Ocean Spiral,” from the ocean’s surface to its floor

Dubbed the 'Ocean Spiral,' the project is projected to cost $26 billion and take five years to complete, although the research for the technology required is still in its infancy.
If ever completed, it would make real visions of a latter-day Atlantis in the deep.

It has the support of a myriad research firms and Japanese government agencies.
A research station at the bottom of the structure would would study ways to excavate energy from beneath the sea floor.
A 15-kilometer length spiral would coil up from there to a giant sphere some 1,500 feet in diameter that would have hotels, apartments and commercial areas, and could accommodate as many as 5,000 people.

 Interior of the residential sphere. (Shimizu Corp.)

"This is just a blueprint by our company, but we are aiming to develop the technology that would enable us to build an underwater living space," a Shimizu spokesman told the Wall Street Journal.
The ocean water temperature differentials between the various parts of the structure would help generate power.

 The "blue garden" sphere at the top of the Ocean Spiral. (Shimizu Corp.)

Japanese construction companies are known for their outlandish aspirations.
Obayashi Corp., a Shimizu rival, has already announced it plans to engineer a near 60,000-mile-long "elevator" into space, scheduled to be ready by 2050.

Shimizu has already unveiled plans for a floating metropolis (see below) and a solar ring around the moon.

 Green Float : a Floating City in the Sky

The Ocean Spiral blueprint comes at a time when an increasing number of governments, multinationals and international organizations are scratching their heads about how to cope with rising sea levels and the effects of climate change on those most vulnerable to it.
Christian Dimmer, an assistant professor of urban studies at Tokyo University, thinks such planning should not just be the preserve of powerful private corporations.
He tells the Guardian:
We had this in Japan in the 1980s, when the same corporations were proposing underground and ‘swimming’ cities and 1km-high towers as part of the rush to development during the height of the bubble economy. It’s good that many creative minds are picking their brains as to how to deal with climate change, rising sea levels and the creation of resilient societies – but I hope we don’t forget to think about more open and democratic urban futures in which citizens can take an active role in their creation, rather than being mere passengers in a corporation’s sealed vision of utopia.
Links :

Thursday, November 20, 2014

NZ Linz update in the Marine GeoGarage

Coverage NZ Linz Marine GeoGarage layer

As our public viewer is not yet available
(currently under construction, upgrading to Google Maps API v3 as v2 is officially no more supported),
this info is primarily intended to
our iPhone/iPad universal mobile application users
(Marine NZ on the App Store) 
and our B2B customers which use our nautical charts layers
in their own webmapping applications through our GeoGarage API.  


6 charts has been updated in the Marine GeoGarage
(Linz October update published November 14, 2014 (Updated to NTM Edition 22)

  • NZ522 Bream Tail to Kawau Island including Great Barrier Island
  • NZ5221 Cradock Channel and Mokohinau Islands
  • NZ5222 Great Barrier Island (Aotea Island)
  • NZ5223 Great Barrier Island (Northwestern Part)
  • NZ5322 Auckland Harbour East
  • NZ5323 Auckland Harbour West
Today NZ Linz charts (183 charts / 323 including sub-charts) are displayed in the Marine GeoGarage.

Note :  LINZ produces official nautical charts to aid safe navigation in New Zealand waters and certain areas of Antarctica and the South-West Pacific.


Using charts safely involves keeping them up-to-date using Notices to Mariners
Reporting a Hazard to Navigation - H Note :
Mariners are requested to advise the New Zealand Hydrographic Authority at LINZ of the discovery of new or suspected dangers to navigation, or shortcomings in charts or publications.

New technology enables historic finds


Passion meets technology in the search for downed aircraft in the South Pacific.

The BentProp Project is a group of volunteers who search for and help repatriate missing World War II Airmen.
Their searches were long and arduous until they enlisted the scientific know-how of Scripps Institution of Oceanography-UCSD and The University of Delaware.
What they find is truly inspiring.

From Scripps  by Robert Monroe

An endeavor to employ a suite of oceanographic research instruments to find downed World War II aircraft and the remains of troops listed as missing in action for nearly 70 years are the subject of a film by camera maker GoPro and the CBS news magazine “60 Minutes.”

Supported by a grant from the Office of Naval Research, Scripps Institution of Oceanography, UC San Diego, oceanographer Eric Terrill and colleagues from the University of Delaware have teamed up with the nonprofit group BentProp Project in a public-private partnership to bring closure to families that have waited for several generations for final word on the fate of their loved ones.
At the same time, the project provides a test bed for developing underwater search technologies and methods, and is a platform for inspiring public interest in science and engineering.


 Palau islands with the Marine GeoGarage (NGA charts)

Earlier this year, the team logged a major success during a month-long expedition in the Republic of Palau, finding wreckage of two U.S. aircraft that were associated with airmen that have been listed as missing in action since World War II.
“This program has been a rewarding opportunity for the chance to recognize the sacrifices our servicemen have paid and give back to families who have lost loved ones,” said Terrill. 
“It is rare in scientific research to be involved in activities that will have direct personal impacts; our participation and successes in this effort have been humbling.” 

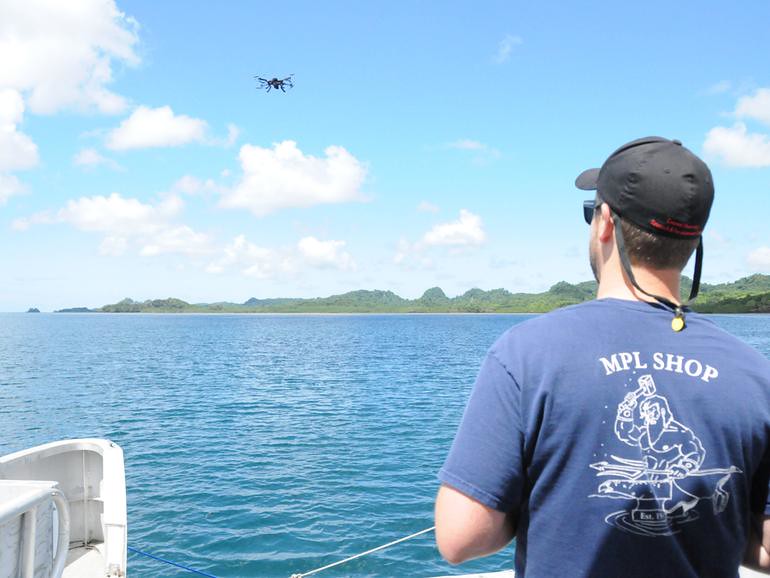
 Scripps Oceanography development engineer Evan Walsh flies a 3D Robotics hexacopter, used in the field as a sensor and image capturing platform.

BentProp’s effort is chronicled in a video released by GoPro, the camera company founded by UC San Diego alumnus Nick Woodman, and is scheduled to be profiled in a future airing of “60 Minutes.”
“I applaud Scripps’s efforts, in conjunction with the BentProp Project, University of Delaware, and GoPro, to help locate the remains of our missing airmen and sailors,” said U.S. Representative Susan Davis, a member of the House Armed Services Committee.
“We have a responsibility to locate those who are missing and remain unaccounted for, and return them home to their families and loved ones. As Congress and the Department of Defense identify ways to more effectively locate those who are missing in action, I hope we can look to creative partnerships like this to bring closure to the families of these service members.”

Since 2010, Terrill’s group has conducted oceanographic research in the waters around Palau.
The islands that make up the small country were the locale of a Japanese airfield during World War II. The strategic Pacific position was also the site of several World War II dogfights, aerial bombing and ground missions.
One of World War II’s bloodiest battles was the landing at Peleliu, a 1944 attack ordered by Gen. Douglas MacArthur that ended in the deaths of 10,000 Japanese and 1,700 American troops.


Terrill’s group at Scripps Oceanography, the Coastal Ocean Research and Development Center, has been deploying sensors in Palau to measure temperatures, waves, currents, and sea level to better understand the influence of the complex terrain on circulation. 
The autonomous underwater vehicles (AUVs) equipped with high-frequency sonar allowed rapid surveys of large areas and provided a means to map the distinctive seafloor’s contours that challenge modern forecast models. 
Before collaborating with BentProp, Terrill’s initial interests had more to do with understanding mapping the reefs, ocean circulation and phenomena such as sea-level rise – a matter of special interest to low-lying western Pacific island nations. 

Scattered among the lagoon waters and coral reefs surrounding Palau’s island chain, and concealed within its dense mangrove forests, are believed to be several dozen U.S. and Japanese aircraft and the remains of perhaps as many as 80 U.S. airmen.
The mission began in 2012 after an introduction by local scientist Pat Colin of the Coral Reef Research Foundation at a popular meeting spot in Koror, Palau’s main city, and brought together Terrill’s science mission with that of Pat Scannon, BentProp’s founder.
Scannon had become interested in searching for MIAs after a 1993 dive trip through the country’s islands.
“I was told there’s a really cool guy over there with all these cool toys,” said Scannon in reference to Terrill.
“This really is a partnership where there’s integration with our search mission with Eric’s technological and oceanographic capabilities. It’s a two way street. We’re able to advance what we’re trying to do in terms of our search and they’re learning more about the technology aspects of working in interesting and complex settings.”

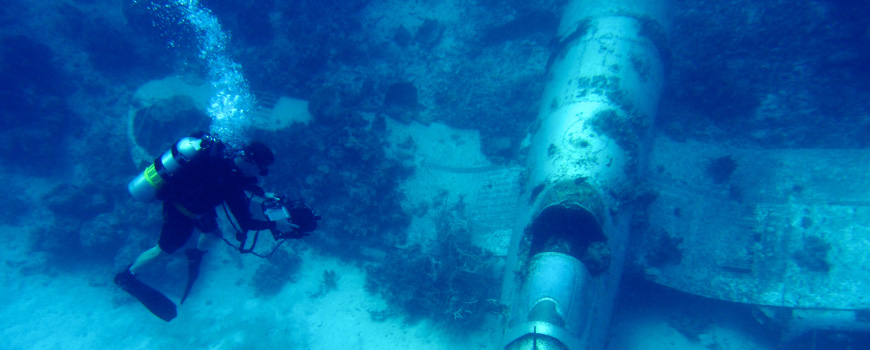
 Scripps engineer Shannon Scott investigates wreckage off Pacific Island nation of Palau

After the chance meeting, Terrill and his colleague Mark Moline from the University of Delaware approached the Office of Naval Research to develop a two-year pilot program that would include both Science, Technology, Engineering and Mathematics (STEM) outreach and demonstrate the utility of the Navy’s investment in unmanned underwater systems to the national mission of searching for MIAs. 

Project RECOVER was formed as a means to formalize this partnership. STEM outreach was extended to include a high school robotics team from Stockbridge, Michigan who built their own remotely operated vehicle to survey wrecks.
BentProp and Terrill’s group have worked closely since the meeting, with the organization frequently visiting the Scripps campus to go over recently uncovered historical information that could aid future searches.
Scannon describes a year of BentProp activity as one month of on-scene searching and 11 months of data collection, whether scientific or historic.

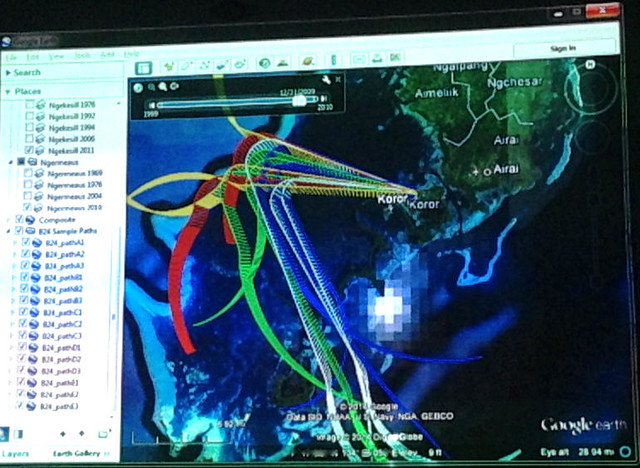
 Possible trajectories of lost aircraft
UC San Diego aeronautical engineers developed statistical models of the flight trajectory for a missing B24 aircraft.
A student group of aeronautical engineering students ran what are known as Bayesian models while researchers from Scripps Institution of Oceanography and University of Delaware were surveying in Palau, and received revised probability maps for areas where the plane might be located based upon data oceanographers had collected.
The plane remains missing and is a focus of planning for a 2015 mission.

The instruments used by Terrill and Moline turned out to be perfect for the kind of seafloor surveys needed to search for missing aircraft in the lagoon waters of Palau and complemented BentProp’s exhaustive review of World War II text and photo archives.
These historical records, along with interviews of veterans, have proven invaluable for providing clues to guide the searches.
Scripps’s own history of collaboration with the U.S. military extends back before World War II.
During the war, Scripps researchers worked closely with military planners to create surf and swell forecasts that helped time amphibious landings and lent other expertise that gave the Allies an advantage in warfare at sea.
“I couldn’t be prouder or more impressed with the Scripps team and the partnerships we established and traveled to Palau with.  The diversity of skills we bring to this problem is unprecedented and spans almost all fields of science and engineering.  The small team environment has allowed us to be remarkably nimble and productive in our field work, and the entire nation of Palau has been fantastic to work,” said Terrill.
“Scripps participation in this effort is full circle to our institution’s research efforts to support Allied troops 70 years ago.”

 The missing Navy Hellcat Fighter plane that was discovered amid coral heads in Palau back in March.
(Photo: Mark Moline/University of Delaware )

The AUVs used by the groups, known as Remote Environmental Monitoring Units (REMUS) were actually developed by colleagues of Terrill and Moline’s at Woods Hole Oceanographic Institution, but now commercially manufactured by a spin-off company called Hydroid.
The systems are equipped with sidescan sonar that can image the seafloor with great detail. 
Scripps engineers Billy Middleton, Myles Syverud, and Andy Nager are experts at running the vehicles, and adept at rapidly analyzing the data for wrecks – distinguishing metal debris from natural seafloor relief.
Multi-rotor aerial systems deployed by Terrill’s group are used to conduct aerial surveys over land and shorelines and also provide a bird’s eye view of dense island foliage that enables detection of wreckage.
This year, Scripps engineer Evan Walsh integrated an infrared camera into the aerial system to provide aerial maps of temperature differences. 
A huge challenge to all the new technology is the fusing of information.
Fortunately, said Terrill, Scripps computer scientist Paul Reuter remains at the cutting edge of handling and visualizing large data sets and integrating 70-year-old reconnaissance photographs into the search analysis.

Inexpensive GoPro cameras are mounted to nearly all the science instruments used by Terrill’s group, contributing directly to research and providing the raw material for video outreach, which have been incorporated into Project RECOVER.
Scripps engineer Shannon Scott even integrates the cameras with the handheld diver sonar he uses when reconnoitering underwater targets revealed by the vehicle surveys.

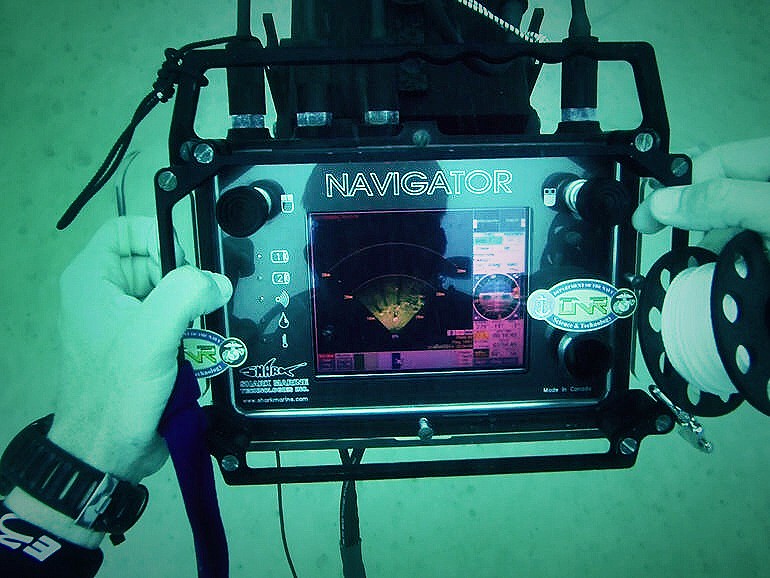
 Scripps oceanographer Eric Terrill uses the SharkMarine Navigator, a handheld scanning sonar unit, during dives to locate potential targets in search of downed WWII aircraft.

GoPro cameramen filmed a portion of search operations and used the searchers’ own footage to create the 13-minute film “Palau – Searching for Heroes.”
“We are honored that GoPro is part of this effort to search for and recover missing airmen from World War II.  We are always interested in learning how our cameras are used for more than just documentation, to see and learn how the GoPros are used as a tool to complement the sonar technology is very inspiring,” said GoPro Director of Global Media Relations Rick Loughery.
“Personally, this was an amazing experience for me and I am proud that GoPro is able to support it and hope that our video will create more awareness for the noble efforts put forth by the BentProp Project, Scripps Oceanography, and the University of Delaware.”
“It’s something very special that feels nearly surreal,” said Travis Schramek, a Ph.D. student in Terrill’s lab who has taken part in the search fieldwork and whose footage appears in the film.
“These problems are not easily solved and can get pushed by the wayside, but this shows that when people get together, they’re capable of accomplishing something truly unique and people like that coalesce around places like Scripps and the University of Delaware.”

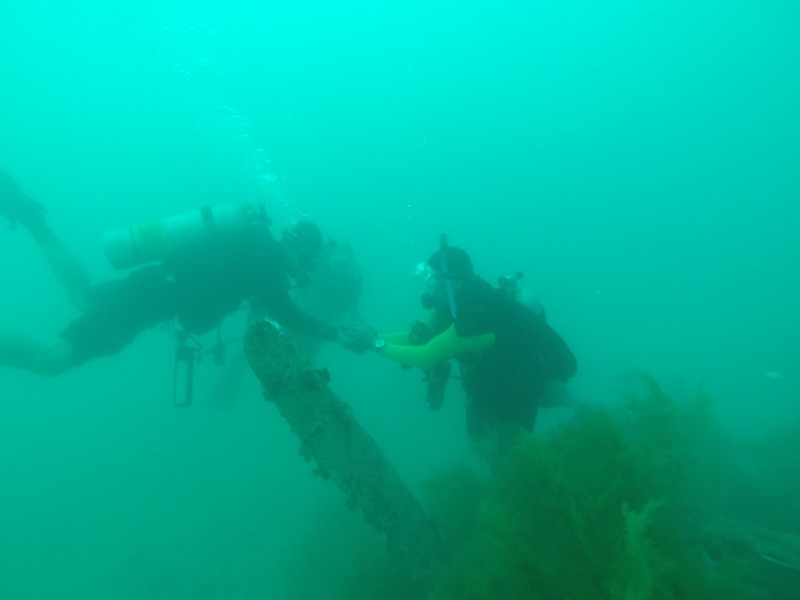
 Scripps oceanographer Eric Terrill and BentProp founder Pat Scannon moments after finding the main fuselage of a TBM Avenger lost 70 years ago during a bombing mission near Palau.
The wreck sits in 100 feet of water.

Other UC San Diego researchers joined the search in different ways.
Terrill collaborates with Mark Anderson of UC San Diego’s Department of Aeronautical Engineering.
Anderson has a background in aeronautics, flight trajectories, and statistics and was asked by Terrill to help with developing a predictive model for a missing B-24 that remains to be found.
A group of engineering students was enlisted to run what are known as Bayesian models, using the best-known historic information collected by BentProp over the last decade.
During the most recent expedition, the probability maps for areas where the plane might be located were routinely updated by the students (during their Spring break) based upon data collected by Terrill’s group that was relayed to them in San Diego. 
The plane remains missing, and teams remain focused on planning for a 2015 mission to complete their search.  

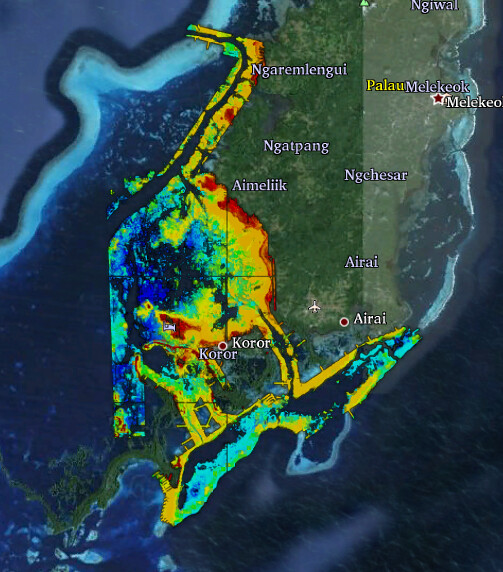
 Satellite image of main island group of Palau, with high-resolution light detection and ranging (LIDAR) bathymetric data obtained from the Naval Oceanographic Office.
Due to the extreme changes in bathymetry present in the lagoon waters, the LIDAR data is invaluable for mission planning of the unmanned underwater vehicle.
LIDAR data is also used for science projects including the forecasting of impacts of sea level rise on the reefs, mangroves, and local infrastructure.

Further help comes from the U.S. Navy, which provided light detection and ranging (LIDAR) imagery for the search area.
The data, originally created to create navigational maps, offer more detail on seafloor features to guide future search missions and was used previously by CORDC to assess sea-level rise impacts.  The raw data has been re-examined to look for topographic anomalies (wrecks) and has been invaluable in mission planning for the underwater systems.

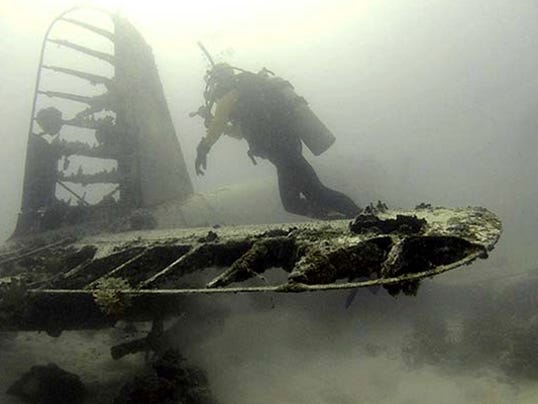
 World War II aircraft such as TBM Avengers are among those recently found by nonprofit organization BentProp with help from Scripps Oceanography, the University of Delaware, UC San Diego, and the Navy.

In the case of the two planes found last spring, a TBM Avenger and an F6F Hellcat, BentProp had been searching for them for nearly 10 years.
It took the REMUS-mounted instruments to see them at a depth of more than 100 feet, hidden from plain view by the persistent murk of the seafloor.
“There was the pre-Scripps era and the post-Scripps era,” said Scannon.
“Our technology before Scripps was scuba gear and that has extreme limitations especially because what we’re looking for lies below 100 feet. We could have gone by those planes two or three times without even seeing them.”

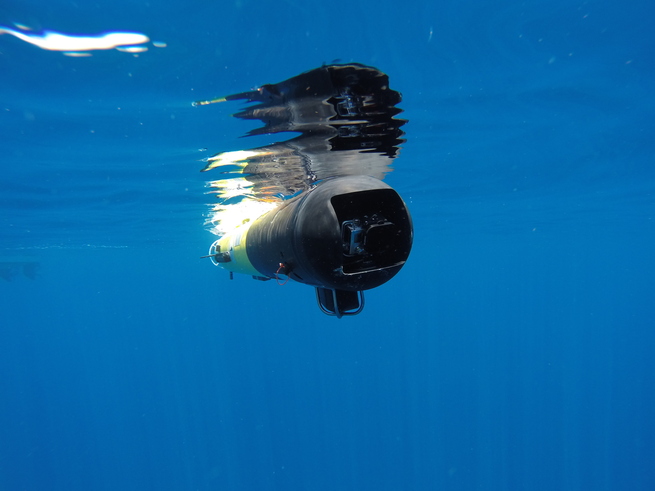
The University of Delaware’s autonomous underwater vehicle, which uses sidescan sonar to scan the bottom of the ocean floor, including ridges of sand, deep valleys and corals.

The combination of the sonar technology and GoPro cameras enable the team to more effectively identifying potential targets. 
(Photo: Mark Moline/University of Delaware )

In a story propelled in large part by chance, one of the two warplanes discovered earlier this year turned out to have personal connection to Terrill.
It was constructed in a Tarrytown, N.Y., General Motors factory at which Terrill’s grandfather served as the paint and body manager.
Terrill was unaware of the family connection to plane production until talking with his father a few days prior to departing for the last expedition, and learning that during the wartime effort, the Navy called upon General Motors to support Grumman in the production of the much-needed and versatile torpedo bomber.
When he dived to the wreckage, he became the second person in his family to study the plane, separated by a span of more than seven decades.
“With details from the missing plane’s After Action Reports recorded during the war, we were able to place the planes production in the same plant that my grandfather worked as the paint and body manager, I learned he would have inspected all bodywork coming from the plant.”

BentProp gave detailed information about the two discovered planes and possible links to airmen listed as missing in action to the Department of Defense’s Joint POW/MIA Accounting Command, which may undertake recovery efforts next year.
When JPAC’s work is complete, these will be the first successful recoveries involving this newly formed partnership.
If remains are returned to loved ones, and if Scannon is present for the encounter, he has an idea of what to expect from his previous experiences.
“An MIA family never forgets,” he said.
“When I walk into a home, there’s often still a shrine. A second- or third-generation family member can still feel the loss very strongly because they never knew them.”

Links :
  • CNET :  How BentProp and undersea robots found long-lost WWII bombers
  • Washington Post : How drones and GoPro cameras are helping recover lost WWII planes
  • Last flight home , the flm of the story of the B-24 crew

Wednesday, November 19, 2014

New satellite data reveals whopping boost in shipping : worldwide ship traffic up 300% since 1992

Global shipping routes crisscross the world’s oceans in this map of shipping lanes derived from a 2008 study of the human impact on marine ecosystems.
Maritime traffic along these lanes is also a major source of noise pollution, which is increasingly considered harmful to marine mammals.
Credit: Grolltech

From AGU

Maritime traffic on the world’s oceans has increased four-fold over the past 20 years, likely causing more water, air and noise pollution on the open seas, according to a new study quantifying global ship traffic.

The research used satellite data to estimate the number of vessels on the ocean every year between 1992 and 2012.
The number of ships traversing the oceans grew by 60 percent between 1992 and 2002.
Shipping traffic grew even faster during the second decade of the study, peaking at rate of increase of 10 percent per year in 2011.

Traffic went up in every ocean during the 20 years of the study, except off the coast of Somalia, where increasing piracy has almost completely halted commercial shipping since 2006.
In the Indian Ocean, where the world’s busiest shipping lanes are located, ship traffic grew by more than 300 percent over the 20-year period, according to the research.

Edith Maersk is the largest ship ever to enter the Thames arrived at DP World London Gateway, the UK’s new deepwater container port.
The 397-metre-long, 56-metre-wide Edith Maersk has a draught of 16 metres and carries up to 15,500 TEU (twenty-foot equivalent units).
DP World London Gateway operates eight of the UK’s largest quay cranes; their air draft and overreach capabilities mean that the port is well-equipped to handle the world’s largest vessels of today and tomorrow.

Ships powered by fossil fuels dump oil, fuel and waste into the water and pump exhaust into the air. Shipping is also a major source of noise pollution, which is increasingly considered potentially harmful to marine mammals, said Jean Tournadre, a geophysicist at Ifremer, the French Institute for the Exploitation of the Sea in Plouzane, and the study author.
“I found it quite worrisome that the ship traffic grew so much, even in very remote regions of the world,” Tournadre said, “especially when we know that they are the major source of pollution [on the open ocean].”


International trade and the sizes of merchant fleets have both enlarged rapidly over the past two decades, explaining the steep rise in ship traffic, the study reports.
The new analysis has been accepted for publication in Geophysical Research Letters, a journal of the American Geophysical Union.


Burgeoning ship traffic has increased the amount of pollution in the atmosphere, particularly above the Sri Lanka-Sumatra-China shipping lane, where the study notes a 50 percent increase in nitrogen dioxide, a common air pollutant, over the 20-year period.

Tournadre said he hopes the new study will increase scientists’ understanding of how human activities are affecting marine ecosystems and improve models of atmospheric pollution in the open ocean.

The new dataset will provide scientists with invaluable insights into the patterns of ship traffic and the traffic’s effect on the environment, said Batuhan Osmanoglu, a radar systems engineer at NASA’s Goddard Space Flight Center in Green Belt, Md., who was not involved in the study.
“The nice thing about this study is that they have a unique dataset, that maybe we’re looking at for the first time,” he said.
“Whenever you have a unique dataset you can quite easily learn something new.”

ExactEarth : build your exactAIS Density Map

The new study is the first to track ship traffic on a global scale, Tournadre said.
Currently, ship traffic is monitored using the Automatic Identification System (AIS).
When vessels are near the coast, they use transponders to send out their location information to other ships and base stations on land.
However, the AIS system doesn’t work very well when ships are out on the open ocean.
Vessels are often out of range of terrestrial base stations or other ships, and few satellites carry the AIS instrumentation necessary to locate vessels from space.

 Marine traffic (2014)

 zoom on Europa

The new method outlined in the study uses altimeters, or instruments that measure altitude, aboard satellites to detect the location of ships at sea, similar to the way these instruments have been used to track icebergs.
The altimeter sends a radar pulse down to Earth from the satellite and constructs an image of the surface based on the time it takes the pulse to bounce back to the instrument and the shape of the pulse when it arrives.
The method works similar to throwing a ping pong ball at the ground: if you know the velocity of the ball and the time it takes to bounce back to your hand, then you can calculate how far from the ground you are.
The shape of the returning pulse can tell you something about the features on the ground.
A smooth target like the ocean will bounce back an expected pulse shape, but if something like an iceberg, island, or ship is present, the shape of the echo will change.

In 2007, Tournadre was poring over hordes of satellite data for signs of icebergs in polar seas, when he noticed an odd shape in the data.
“We had some unconventional data in a region, and careful analysis showed us that it was a lighthouse near shipping lanes,” he said.
“As we processed the data over the whole globe, we also detected ships.”

 CSCL Globe, the new world’s largest containership :
CSCL Globe measures 400.0 m in length, 58.6 m in width and 30.5 m in depth, a 19,000 TEU giant
Since 1987, average vessel size of container ships has doubled.

Tournadre found that the altimetry data accurately reproduced known shipping lanes and could be used to estimate the number of vessels on the ocean worldwide.
The study used altimetry data from seven different satellites to map ship traffic from 1992 to 2012.

Using satellite data made it possible to calculate ship traffic for the entire globe, whereas AIS records provide relatively limited coverage in both space and time, Tournadre said.
The new method also allowed him to look back at two decades of traffic using archived data, and give independent measurements of ship traffic that were not based on the will or capability of ships to transmit their own positions.

However, Tournadre also cautions that some of the growth he has seen in ship traffic could be overestimated because ships, especially container ships, have become larger over the past two decades and possibly easier to detect with altimetry data.

Links :
  • DailyMail : Watch the world's ships sail Earth's oceans in real time: Interactive map reveals crowded routes taken by planet's vessels 
  • GeoGarage blog : Warns of the effects of shipping emission policy on the world economy
  • ESA : ESA map reveals European shipping routes like never before


Tuesday, November 18, 2014

NASA computer model provides a new portrait of carbon dioxide

An ultra-high-resolution NASA computer model has given scientists a stunning new look at how carbon dioxide in the atmosphere travels around the globe.
Plumes of carbon dioxide in the simulation swirl and shift as winds disperse the greenhouse gas away from its sources.
Image Credit: NASA's Goddard Space Flight Center/K. Sharghi 

From NASA

An ultra-high-resolution NASA computer model has given scientists a stunning new look at how carbon dioxide in the atmosphere travels around the globe.

Plumes of carbon dioxide in the simulation swirl and shift as winds disperse the greenhouse gas away from its sources.
The simulation also illustrates differences in carbon dioxide levels in the northern and southern hemispheres and distinct swings in global carbon dioxide concentrations as the growth cycle of plants and trees changes with the seasons.

Scientists have made ground-based measurements of carbon dioxide for decades and in July NASA launched the Orbiting Carbon Observatory-2 (OCO-2) satellite to make global, space-based carbon observations.
But the simulation – the product of a new computer model that is among the highest-resolution ever created – is the first to show in such fine detail how carbon dioxide actually moves through the atmosphere.

“While the presence of carbon dioxide has dramatic global consequences, it’s fascinating to see how local emission sources and weather systems produce gradients of its concentration on a very regional scale,” said Bill Putman, lead scientist on the project from NASA's Goddard Space Flight Center in Greenbelt, Maryland.
“Simulations like this, combined with data from observations, will help improve our understanding of both human emissions of carbon dioxide and natural fluxes across the globe.”

The carbon dioxide visualization was produced by a computer model called GEOS-5, created by scientists at NASA Goddard’s Global Modeling and Assimilation Office.
In particular, the visualization is part of a simulation called a “Nature Run.”


NASA's Orbiting Carbon Observatory-2, or OCO-2, is designed to study the global carbon cycle from a whole new perspective.
From its vantage point in polar orbit, OCO-2 will measure atmospheric carbon dioxide, discovering where it is being emitted and absorbed and revealing the roles of humans, plants and oceans on global CO2 levels.

The Nature Run ingests real data on atmospheric conditions and the The natureemission of greenhouse gases and both natural and man-made particulates.
The model is then is left to run on its own and simulate the natural behavior of the Earth’s atmosphere.
This Nature Run simulates May 2005 to June 2007.

While Goddard scientists have been tweaking a “beta” version of the Nature Run internally for several years, they are now releasing this updated, improved version to the scientific community for the first time.
Scientists are presenting a first look at the Nature Run and the carbon dioxide visualization at the SC14 supercomputing conference this week in New Orleans.

“We’re very excited to share this revolutionary dataset with the modeling and data assimilation community,” Putman said, “and we hope the comprehensiveness of this product and its ground-breaking resolution will provide a platform for research and discovery throughout the Earth science community.”


In the spring of 2014, for the first time in modern history, atmospheric carbon dioxide – the key driver of global warming – exceeded 400 parts per million across most of the northern hemisphere.
Prior to the Industrial Revolution, carbon dioxide concentrations were about 270 parts per million.
Concentrations of the greenhouse gas in the atmosphere continue to increase, driven primarily by the burning of fossil fuels.

Despite carbon dioxide’s significance, much remains unknown about the pathways it takes from emission source to the atmosphere or carbon reservoirs such as oceans and forests.
Combined with satellite observations such as those from NASA’s recently launched OCO-2, computer models will help scientists better understand the processes that drive carbon dioxide concentrations.

The Nature Run also simulates winds, clouds, water vapor and airborne particles such as dust, black carbon, sea salt and emissions from industry and volcanoes.

The resolution of the model is approximately 64 times greater than that of typical global climate models.
Most other models used for long-term, high-resolution climate simulations resolve climate variables such as temperatures, pressures, and winds on a horizontal grid consisting of boxes about 50 kilometers (31 miles) wide.
The Nature Run resolves these features on a horizontal grid consisting of boxes only 7 kilometers (4.3 miles) wide.

The Nature Run simulation was run on the NASA Center for Climate Simulation’s Discover supercomputer cluster at Goddard Space Flight Center.
The simulation produced nearly four petabytes (million billion bytes) of data and required 75 days of dedicated computation to complete.

In addition to providing a striking visual description of the movements of an invisible gas like carbon dioxide, as it is blown by the winds, this kind of high-resolution simulation will help scientists better project future climate.
Engineers can also use this model to test new satellite instrument concepts to gauge their usefulness.
The model allows engineers to build and operate a “virtual” instrument inside a computer.

Using GEOS-5 in tests known as Observing System Simulation Experiments (OSSE) allows scientists to see how new satellite instruments might aid weather and climate forecasts.

“While researchers working on OSSEs have had to rely on regional models to provide such high-resolution Nature Run simulations in the past, this global simulation now provides a new source of experimentation in a comprehensive global context,” Putman said.
“This will provide critical value for the design of Earth-orbiting satellite instruments.”

Links :

Monday, November 17, 2014

Arctic satellite image of the week : Russia discovers a new island in its Arctic

Landsat 8 image taken on June 16, 2013 of new island discovered near Russia.
Image from NASA via USGS Earth Explorer.

From Cryopolitics by Mia Bennett

In September 2013, two military helicopter pilots transporting equipment from Tiksi, a port city in northeast Russia, to the New Siberian Islands spotted a previously unknown island in the Laptev Sea.
The discovery took place just a little ways south of the main shipping lanes used for the Northern Sea Route and has now been corroborated by geological surveying.
The Russian-language version of Popular Mechanics notes that the small, low-lying island has been christened “Yaya,” or “Яя” in Russian.
The rhyming name comes from the Russian word “Я,” which means “I”, for the pilot of each Mi-26 helicopter essentially shouted, “It was I who found it!” when they spotted the scrap of land.

New Siberian island with the Marine GeoGarage (NGA charts)

The pilots happened to fly over the island (73°59′25″ N, 133°05′28 E) in September, when Arctic sea ice is at its lowest extent.

September is the usually the first entire month to be open to shipping along the Northern Sea Route, too.
I was unable to find cloud-free Landsat 8 satellite images taken over the location of the new island in September, or any of the other relatively ice-free months for that matter (July, August, and October), but I was able to find a cloud-free image taken on June 16, 2013, when the water was still frozen solid.
Even despite all the thick sea ice surrounding the brown speck of land, it still manages to stick out.

Geographically speaking, the discovery reveals the extent to which the Arctic – especially the eastern Russian Arctic – still remains poorly mapped. It’s rare to hear of new islands – however small – being discovered elsewhere in the world unless they’re due to some recent volcanic activity.


 Map of new island’s location and Russia’s new territorial waters.

New Siberian Islands Buildup?

Legally speaking, wile the island is small, its discovery does have certain implications under the United Nations Convention on the Law of the Sea (UNCLOS).
All of the waters around Yaya Island already fall within Russian’s exclusive economic zone (EEZ).
But Section II explains that territorial seas extend 12 nautical miles outward from a country’s coastline.
Thus, with the addition of the island to Russian territory, the country will gain 452 square kilometers of territorial seas.
Once classified as territorial seas, then the water surface area, the air column above it, and the water column and seabed below it all become part of the country’s sovereign area.

UNCLOS also specifies that countries cannot levy charges on foreign ships for passing through their territorial waters, let alone EEZs.
Yet because the waters are ice covered for a majority of the year, Russia is able to enforce additional regulations to prevent pollution, including by levying charges, under Article 234.

Yaya Island’s existence will cause hardly any large-scale changes in the eastern Russian maritime Arctic.
But what could be more of a game-changer is the uptick in military-related activities occurring around Tiksi and the New Siberian Islands.
The two helicopters that spotted Yaya were, as mentioned, ferrying unspecified equipment to the New Siberian Islands in September 2013 – one year before Russia re-opened a former Soviet military base there.
So perhaps more than the discovery of the island, it’s actually the discoverers who form the real story behind the headline.
In next week’s Arctic satellite image of the week post, I’ll look more into the military buildup taking place at what was their destination: the New Siberian Islands. 

Sunday, November 16, 2014

A journey to space


What does astronaut see from up there?
From the red soil of africa, the blue water of oceans, to the green lights of the poles and yellow light of human activity, discover, through this journey to space, something astoundingly beautiful and strange at the same time.