Once you have discovered the ocean nothing will ever be the same again!
Saturday, May 12, 2012
Friday, May 11, 2012
Vast Antarctic ice sheet 'in play' with global warming

The Ronne-Filchner ice shelf, seen in blue, sits between Antarctica's two ice sheets, which are divided by the Transantarctic Mountains going from that ice shelf to the Ross ice shelf.
(National Snow and Ice Data Center)
From MSNBC
Scientists have long focused on Antarctica’s smaller ice sheet as being vulnerable to warming, but two new studies project that part of the continent's much larger ice sheet is also at risk -- and that ice now held back on land there could add to sea level rise by 2100.
"This is the first legitimate evidence that this part of Antarctica is in play," Bob Bindschadler, a NASA earth scientist who has studied Antarctica for 30 years, told msnbc.com. "
The potential, the reservoir of ice ... is vast."
In fact, that area, known as the East Antarctic Ice Sheet, has 10 times as much ice as the West Antarctic Ice Sheet.
One study, published Wednesday in the journal Nature, used a computer model to project what would happen in Antarctica's Weddell Sea if temperatures rose in line with U.N. projections for 2100.

>>> geolocalization with the Marine GeoGarage <<<
Ice shelves like Ronne-Filchner sit on water, and thus their disintegration can't raise sea levels directly.
But they also hold back ice sheets that sit atop land -- and those would start to drain into the sea if shelves weren't there to block them.
The Ronne-Filchner shelf is unusual in that it "sits on the fence" between Antarctica's two ice sheets, so it "can affect both sides," said Bindschadler, who was not involved in the research.
The finding echoes earlier research showing a similar warming effect in the Amundsen Sea on the other side of the Antarctic Peninsula.
Ice shelves along the Amundsen Sea coast have weakened in recent decades.
"The Weddell Sea is as vulnerable as the Amundsen Sea," study co-author Hartmut Hellmer of Germany's Alfred Wegener Institute said at a press conference, "and it affects a much larger ice shelf."
"We found a mechanism which drives warm water towards the coast with an enormous impact on the Filchner-Ronne Ice Shelf in the coming decades," he added in a statement released with the study.
"It appears all hell could break loose there, too," added Bindschadler.
The second study, published in Nature Geoscience on Wednesday, found that the Ronne-Filchner ice shelf has a slope that would accelerate melt since warmer seas would flow toward the ice being held back on land.
That scenario, said Bindschadler, "sets off alarms in my mind."
The study authors -- and Bindschadler -- emphasized that the east sheet has not started eroding but they certainly worry about the potential.

The scenario seen by researchers includes warming seas that reduce sea ice and eat away at the bottom of the Ronne-Filchner ice shelf.
(Alfred Wegener Institute)
"It still doesn't look like they've done much," Bindschadler said of the ice streams that could flow into the Weddell Sea, "but lo and behold, the vulnerability is perhaps greater than the ice shelves we've been focused on recently."
Just how much ice could escape into the sea -- and raise global sea levels -- if the Ronne-Filchner ice shelf disintegrated is the big unknown.
The two studies didn't look at that aspect but "we think there is cause for concern," said Martin Siegert, co-author of the slope study and a University of Edinburgh researcher.
Another group at the Alfred Wegener Institute is now studying the potential impact on sea levels.
If the ice sheet flow toward the sea is as great as the ice shelf loss, the institute said in its statement, then global sea levels would rise 0.17 inches a year.
That might not sound like much, but sea levels rose by just 0.05 inches a year from 2003 to 2010 due to ice melt, the institute noted.
Moreover, the U.N. Intergovernmental Panel on Climate Change projects other sources will raise sea levels between seven inches and two feet by 2100, potentially flooding many low-lying areas.
Links :
- CSMonitor : Antarctic ice sheet at risk, say scientists
Thursday, May 10, 2012
Solo Concarneau 2012 fleet tracking on the GeoGarage
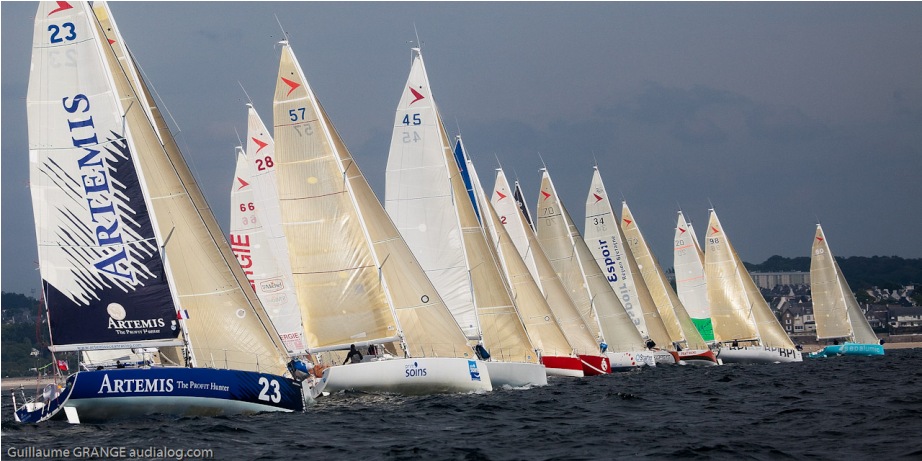
Organised by the Société des régates de Concarneau (S.R.C.), this is one of the qualifying races for La Solitaire du Figaro with the Figaro Bénéteau 2 class competing over 3 days of offshore sailing.
The race will be of a distance of 340 miles between Ouessant and Yeu island with the precise route being given to the skippers on Wednesday 9th May.

start from Concarneau, Ouessant, Sein, Belle Ile, Ile d'Yeu and return to Concarneau
LIVE VESSEL TRACKING
on the Marine GeoGarage
(maps SHOM / note : only AIS sailing race boats are displayed)
on the Marine GeoGarage
(maps SHOM / note : only AIS sailing race boats are displayed)
This year, to follow the race in real time on the race blog, Mathias Lallemand, the race director, plans to use the onboard AIS systems fitting all the boats.
This system requires the installation of beacons and receivers (provided by Icom France) on the coast, along the route and the S.R.C. worked to find the ideal sites for the best geographical coverage.
So 4 AIS receivers are installed in specific places in Penmarch, Concarneau, Quiberon (ENV), Saint Gilles Croix de Vie
Following a first implementation with the Figaro race last year (see GeoGarage blog : 27-01-11/31-07-11/24-08-11), GeoGarage has implemented some webmapping visualization for a Live AIS vessel tracking.
Addtionally to the 4 AIS receivers, some other AIS sources will participate to this event through the local receivers useful for the race provided by MarineTraffic contributors.

Le Figaro Race (10-08-2011 09:13 UTC) : arrival at Dun Laoghaire (Ireland)
For this webmapping experimentation of Live AIS vessel tracking, the GeoGarage uses in background a limited set of 11 French nautical charts provided by the SHOM :
WARNINGS :
- No national hydrographic office (HO), State Authority, and their licensors have verified the information in this product or quality assured it, and none accept liability for the accuracy of reproduction or any modifications made thereafter. No national hydrographic office and their licensors makes any warranties or representations, express or implied, with respect to this product. No national hydrographic office warrants that the product satisfies national or international regulations regarding the use of the appropriate products for navigation or that it contains the latest hydrographic information available.
- All charts are used directly from existing government and other official charts from international Hydrographic Offices ("© SHOM - reproduced with authorization n°4/2012") and should not be used solely for navigation. Digital charts are intended to be used as an aid to traditional navigational charts, not as a replacement. Only official government charts and notices to mariners contain all information needed for the safety of navigation, and as always, the captain is responsible for their prudent use.
- Magic Instinct Software (GeoGarage editor) and the SHOM give no warranty in relation to the data (including accuracy, reliability, completeness or suitability) and accepts no liability (including, without limitation, liability in negligence) for any loss, damage or costs relating to any use of the data.
- This information may not be copied, reproduced, translated, or reduced to any medium or machine readable form, in whole or part.

Follow the race on :
- Blog Solo Concarneau
- Twitter : @SRConcarneau / #solocc / #aoasolo
- Marine GeoGarage (live AIS tracking)
Racers list :
- # BIARNES Vincent (vincent.biarnes)
- #37 BOMBY Henry (@henrysailing)
- #43 BOND Oliver (@oliver_bond)
- # BOUILLARD Didier
- # COOPER Aaron (@Cooper_Racing)
- # D'HOOGUE Eric (@Dhooghe_eric)
- #26 ELIES Yann (@YannElies)
- # GIROLET Mathieu
- # HARDY Adrien
- # HOREAU Corentin (corentin.horeau)
- #66 JOSCHKE Isabelle
- #64 JOSSIER Nicolas (@nicolasjossier)
- #5 LAGRAVIERE Morgan
- # LOISON Alexis (@LOISONAlexis)
- # LUNVEN Nicolas (@nicolunven)
- #47 MACAIRE Xavier
- #68 NICOL Jean-Pierre (@jpnicol)
- #98 NORMAND Thomas (@Thomas_Normand)
- # PICAULT Sébastien
- # RUYANT Thomas (@ThomasRuyant)
- #19 SINEAU David
- #39 SONGE -MOLLER Kristin (@KristinSailing)
- # VILLION Julien (julien.villion)
Communiqué de presse en français :
Solo Concarneau 2012, suivie de près par le GeoGarage
La 35e édition de la solo Concarneau partira de la ville de Concarneau, le jeudi 10 mai à 15 heures et se terminera le samedi 12 mai.
Organisée par la société des Régates de Concarneau (S.R.C), la Solo est une des courses qualificatives pour la Solitaire du Figaro sur un parcours côtier de 3 jours.
La course d’une distance de 440 milles se déroulera sur une boucle autour de Concarneau, entre Ouessant et l’île d’Yeu, en passant par l'île de Sein et Belle Ile.
Cette année, le suivi de la course se fera en quasi temps réel sur une cartographie mise en place sur le blog de la course.
Mathias Lallemand, le directeur de course prévoit en effet d’utiliser les systèmes AIS installés à bord de tous les bateaux.
Ce suivi a nécessité l’installation spécifique de récepteurs et d'antennes VHF AIS (fournis par Icom France) tout le long de la côte.
La Société des Régates de Concarneau s'est efforcé de trouver les sites idéaux d'un point de vue radio pour assurer la meilleure couverture géographique possible.
Ainsi quatre récepteurs sont installés dans des lieux appropriés à Penmar'ch, Concarneau, Quiberon et Saint Gilles Croix de Vie.
Après une première expérimentation avec la course du Figaro l’année dernière (voir le blog du Geogarage : 27-01-11/31-07-11/24-08-11), Geogarage a développé une visualisation cartographique pour un suivi en live des positions des navires.
En plus des 4 récepteurs AIS installés, d'autres sources de récepteurs AIS locaux utiles pour la course participeront à cet événement, flux fournis par les contributeurs de Marine Traffic.
Il est à noter que le webmapping du GeoGarage utilise pour la première fois un jeu limité de cartes nautiques françaises fournies par le SHOM.
Big rise in North Pacific plastic waste

Debris tends to collect within the North
Pacific Subtropical Convergence Zone. Ocean eddies and other small ocean
circulation features will further aggregate material into more discrete
"garbage patches"
From BBC
The quantity of small plastic fragments floating in the north-east Pacific Ocean has increased a hundred fold over the past 40 years.
Scientists from the Scripps Institution of Oceanography documented the big rise when they trawled the waters off California.They were able to compare their plastic "catch" with previous data for the region.
The group reports its findings in the journal Biology Letters.
"We did not expect to find this," says Scripps researcher Miriam Goldstein.
"When you go out into the North Pacific, what you find can be highly variable. So, to find such a clear pattern and such a large increase was very surprising," she told BBC News.
All the plastic discarded into the ocean that does not sink will eventually break down.
Sunlight and the action of the waves will degrade and shred the material over time into pieces the size of a fingernail, or smaller.
An obvious concern is that this micro-material could be ingested by marine organisms, but the Scripps team has noted another, perhaps unexpected, consequence.
The fragments make it easier for the marine insect Halobates sericeus to lay its eggs out over the ocean.
These "sea skaters" or "water striders" - relatives of pond water skaters - need a platform for the task.
Normally, this might be seabird feathers, tar lumps or even pieces of pumice rock. But it is clear from the trawl results that H. sericeus has been greatly aided by the numerous plastic surfaces now available to it in the Pacific.

The fragments are tiny - about 5mm in diameter, or less
The team found a strong association between the presence of Halobates and the micro-plastic in a way that was just not evident in the data from 40 years ago.
Ms Goldstein explained: "We thought there might be fewer Halobates if there's more plastic - that there might be some sort of toxic effect. But, actually, we found the opposite. In the areas that had the most plastic, we found the most Halobates.
"So, they're obviously congregating around this plastic, laying their eggs on it, and hatching out from it. For Halobates, all this plastic has worked out well for them."

The micro-plastic has been a boon to one marine invertebrate - Halobates sericeus
Ms Goldstein and colleagues gathered their information on the abundance of micro-plastic during the Scripps Environmental Accumulation of Plastic Expedition (Seaplex) off California in 2009. They then compared their data with those from other scientific cruises, including archived records stretching back to the early 1970s.
Plastic waste in the North Pacific is an ongoing concern.
The natural circulation of water - the North Pacific Gyre - tends to retain the debris in reasonably discrete, long-lived collections, which have popularly become known as "garbage patches".
In the north-eastern Pacific, one of these concentrations is seen in waters between Hawaii and California.
This Scripps study follows another report by colleagues at the institution that showed 9% of the fish collected during the same Seaplex voyage had plastic waste in their stomachs.
That investigation, published in Marine Ecology Progress Series, estimated the fish at intermediate ocean depths in the North Pacific Ocean could be ingesting plastic at a rate of roughly 12,000 to 24,000 tonnes per year.
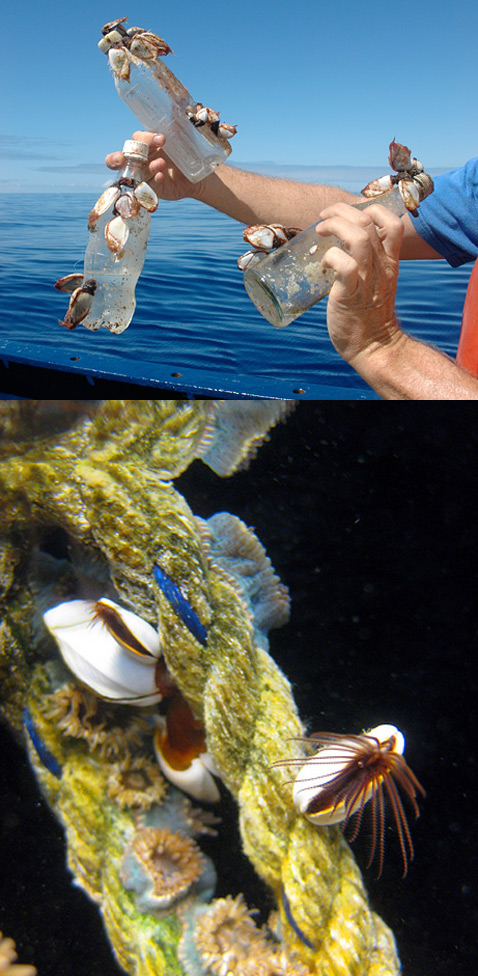
Crabs, barnacles, sea anemones and hydroids make a home on a piece of discarded rope
The abundance of ocean debris will influence the success, or otherwise, of "rafting communities" - those species that are specifically adapted to life on or around objects floating in the water.
Larger creatures would include barnacles and crabs, and even fish that like to live under some kind of cover, but large-scale change would likely touch even the smallest organisms.
"The study raises an important issue, which is the addition of hard surfaces to the open ocean," says Ms Goldstein.
"In the North Pacific, for example, there's no floating seaweed like there is in the Sargasso Sea in the North Atlantic. And we know that the animals, the plants and the microbes that live on hard surfaces are different to the ones that live floating around in the water.
"So, what plastic has done is add hundreds of millions of hard surfaces to the Pacific Ocean. That's quite a profound change."
Ms Goldstein's co-authors were Marci Rosenberg, a student at the University of California Los Angeles, and Scripps research biologist emeritus Lanna Cheng.
Wednesday, May 9, 2012
New nautical chart inset makes for safer sailing in Norfolk Inner Harbor

From NOAA
NOAA’s Office of Coast Survey has released an updated chart of Norfolk Harbor in time for Virginia’s War of 1812 Bicentennial events, when boats of all shapes and sizes descend on the area for twelve days of maritime activities.
The updated chart includes a new inset of the Norfolk Inner Harbor, which provides updated depth measurements and more details than the current chart.

The new inset on existing NOAA chart 12253, Norfolk Harbor and Elizabeth River, is at a 1:10,000 scale.
The improvement incorporates data acquired by two hydrographic surveys: one last year by NOAA Ship Thomas Jefferson and another by a Coast Survey navigation response team in 2010.
The re-surveys of the Norfolk Inner Harbor updated more than 600 charted features and provided new bathymetry along the entire Norfolk waterfront.
“The surveys and the new chart inset will help ensure the navigational safety of the hundreds of boats coming in and out of the harbor during the War of 1812 Bicentennial events,” explained NOAA Captain Doug Baird, chief of the Office of Coast Survey Marine Chart Division. “But this serves a broader economic need as well. The downtown area of Norfolk has developed as a multi-purpose port area, which requires a larger chart scale to support it.”
The larger scale coverage of the inner harbor area was requested by the Virginia Marine Pilot Association, which works closely with the Office of Coast Survey to ensure the safety of ships and mariners.
NOAA’s nautical charts come in a variety of formats, to meet the needs of different navigational systems.
The updated chart is now available to all mariners as a traditional paper chart from vendors, or as a Print on Demand chart through OceanGrafix.
Additionally, recreational boaters are able to download and print free BookletCharts designed especially for small boats: the War of 1812 Commemorative BookletChart and the updated regular edition for chart 12253 will be released later this month. NOAA’s electronic navigational chart will also be available shortly.
NOAA’s Office of Coast Survey has been the nation’s nautical chartmaker for two centuries.
Coast Survey contributes nautical charts, hydrographic data, and navigational assistance to the full range of NOAA’s navigational services.
USA NOAA update in the Marine GeoGarage

30 charts have been updated in the Marine GeoGarage
(NOAA update March/April 2012) and 1 chart added- 11304 NORTHERN PART OF LAGUNA MADRA
- 11309 CORPUS CHRISTI BAY
- 11323 APPROACHES TO GALVESTON BAY
- 11345 NEW ORLEANS TO CALCASIEU RIVER WEST SECTION
- 11412 TAMPA BAY AND ST JOSEPH SOUND
- 11424 LEMON BAY TO PASSAGE KEY INLET
- 12253 NORFOLK HARBOR AND ELIZABETH RIVER (see Blog)
- 12327 NEW YORK HARBOR
- 13236 CAPE COD CANAL AND APPROACHES MA
- 13272 BOSTON INNER HARBOR
- 16161 KOTZEBUE HARBOUR AND APPROACHES ***NEW***
- 16660 COOK INLET NORTHERN PART
- 16700 PRINCE WILLIAM SOUND
- 17339 HOOD BAY AND KOOTZNAHOO INLET / KILLISNOO HARBOR
- 17341 WHITEWATER BAY AND CHAIK BAY
- 18400 STRAIT OF GEORGIA AND STRAIT OF JUAN DE FUCA
- 18445 POSSESSION SOUND TO VASHON ISLAND PAGE A
- 18448 PUGET SOUND SEATTLE TO OLYMPIA
- 18645 GULF OF THE FARALLONES
- 11351 POINT AU FER TO MARSH ISLAND
- 11371 LAKE BORGNE AND APPROACHES CAT ISL TO POINT AUX HERBES
- 11411 TAMPA BAY - PORT RICHEY TAMPA BAY - CLEARWATER HBR
- 11415 TAMPA BAY ENTRANCE
- 11503 ST MARYS ENTRANCE-CUMBERLAND SOUND AND KINGS BAY
- 11555 CAPE HATTERAS WIMBLE SHOALS TO OCRACOKE INLET
- 12324 SANDY HOOK TO LITTLE EGG HARBOR NEW JERSEY
- 12335 HUDSON AND EAST RIVERS-GOVERNORS ISLAND TO 67TH STREET
- 13221 NARRAGANSETT BAY RI-MA
- 16663 NORTH FORELAND
- 17337 WARM SPRING BAY CHATHAM STRAIT
- 17338 PERIL STRAIT HOONAH SND-CHATHAM STRAIT
Note : NOAA updates their nautical charts with corrections published in:
- U.S. Coast Guard Local Notices to Mariners (LNMs),
- National Geospatial-Intelligence Agency Notices to Mariners (NMs), and
- Canadian Coast Guard Notices to Mariners (CNMs)
Please visit the NOAA's chart update service for more info.
Canada CHS update in the Marine GeoGarage

15 charts have been updated (Apr 27, 2012) :
- 1311 SOREL-TRACY TO VARENNES
- 1313 BATISCAN TO LAC SAINT-PIERRE
- 1314 DONNACONA TO BATISCAN
- 1315 QUEBEC TO DONNACONA
- 1510A LAC DES DEUX MONTAGNES
- 1510B LAC DES DEUX MONTAGNES
- 2085 TORONTO HARBOUR
- 3462 JUAN DE FUCA STRAIT TO STRAIT OF GEORGIA
- 3545 JOHNSTONE STRAIT PORT NEVILLE TO ROBSON BIGHT
- 4367 FLINT ISLAND TO CAPE SMOKEY
- 4416 HAVRE DE GASPE
- 4452 HARBOURS AND ANCHORAGES / NORTH SHORE
- 4454 POINTE CURLEW TO BAIE WASHTAWOUKA
- 4460 CHARLOTTETOWN HARBOUR
- 4498 PUGWASH HARBOUR AND APPROACHES
- 4909 BUCTOUCHE HARBOUR
So 790 charts (1677 including sub-charts) are available in the Canada CHS layer. (see coverage)
Note : don't forget to visit 'Notices to Mariners' published monthly and available from the Canadian Coast Guard both online or through a free hardcopy subscription service.
This essential publication provides the latest information on changes to the aids to navigation system, as well as updates from CHS regarding CHS charts and publications.
See also written Notices to Shipping and Navarea warnings : NOTSHIP
GPS on commercial ships could improve tsunami warnings
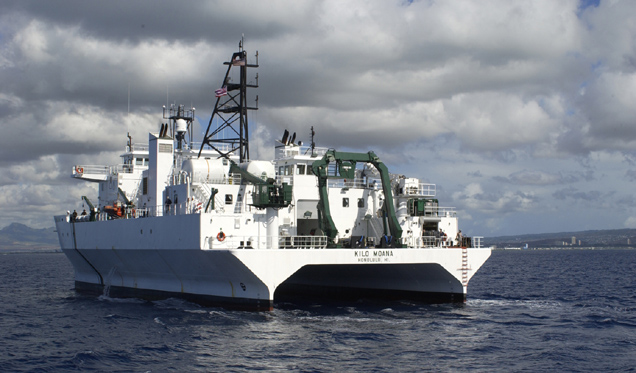
While in transit from Hawaii to Guam, the research vessel Kilo Moana detected the February 2012 Chilean tsunami. (Photo courtesy of University of Hawaii, School of Ocean and Earth Science and Technology)
From SOEST
Commercial ships travel across most of the globe and could provide better warnings for potentially deadly tsunamis, according to a study published May 5 by scientists at the University of Hawaii – Manoa (UHM) and the National Oceanic and Atmospheric Administration's Pacific Tsunami Warning Center. (see AGU)
James Foster, lead author and Assistant Researcher at the UH School of Ocean and Earth Science and Technology (SOEST), and colleagues were able to detect and measure the properties of the tsunami generated by the magnitude 8.8 earthquake in Maule, Chile (February 2010), even though, out in the open ocean, the wave was only about 4 inches (9.4 cm) high.
The UH research vessel Kilo Moana was on its way from Hawaii to Guam at the time of the tsunami, and was equipped with geodetic GPS system recording data as the tsunami passed by.

Position of R/V Kilo Moana during 2010 Chile tsunami
Careful analysis of this data showed that the researchers were able to detect changes in the sea-surface height very similar to the Pacific Tsunami Warning Center predictions.
This finding came as a surprise because tsunamis have such small amplitudes in the deep water, in contrast to their size when they reach the coastline, that it seemed unlikely that the tsunami would be detected using GPS unless the ship was very close to the source and the tsunami was very big.
"Our discovery indicates that the vast fleet of commercial ships traveling the ocean each day could become a network of accurate tsunami sensors," Foster said.
Although the initial warning for a tsunami is based on seismic data from the earthquake, the details about whether a tsunami was actually generated, how big it is, and where the energy is directed are currently provided by tide gauges and deep ocean pressure sensors (DART system).
This is the information that is needed to accurately predict how big the tsunami will be for specific locations, and whether or not an evacuation, and the associated cost, is necessary.
Tide gauges are restricted to land and therefore are sparsely distributed, while the DART systems are very expensive and hard to maintain.
Consequently, during the 2010 Chilean earthquake, the DART sensor closest to Hawaii was out of order. In fact, nearly 30% of that network was down at the time.
Commercial shipping lines, however, run all around the Pacific basin and provide great coverage globally around tsunamigenic regions (areas of the Earth that produced tsunamis).
"If we could equip some fraction of the shipping fleet with high-accuracy GPS and satellite communications, we could construct a dense, low-cost tsunami sensing network that would improve our detection and predictions of tsunamis -- saving lives and money," Foster commented.
Foster and co-authors estimate that this sort of ship-based system would have been able to detect the 2004 Indian Ocean tsunami within an hour, potentially save thousands of lives.
"There are so many ships out there that if you've got enough of them instrumented with the GPS systems there is always going to be some ships in the neighborhood of the region that produces the tsunami," said Foster.
Much more advanced than a handheld GPS, the unit on a ship would include a round antenna to help measure and transmit even the slightest wave height changes from a tsunami that would likely go unnoticed in the open ocean.
The difference being measured in length of time.
"An open ocean swell has a period of maybe 15 seconds, 20 seconds. A tsunami takes maybe 20 minutes, half an hour to pass," said Foster.
At $15,000 to $20,000 per unit, the GPS is cheaper than the current deep ocean buoys that provide tsunami data.

GPS
Tsunami Meter utilizes floating buoy as observation instrument, in
which Real-Time Kinematic GPS antenna is attached on the top of the buoy
body
The challenge will be getting the commercial shipping lines to jump on board to create a mobile tsunami detection system.
Foster and fellow SOEST researchers plan to deploy a demonstration system which will stream GPS data from one or two ships, thus generating accurate real-time heights and confirming that this approach can achieve the accuracy needed for tsunami detection.
As a bonus, the same processing system will generate data that meteorologists can use to improve weather forecasts.
Links :
- CBC : Researchers use GPS data to speed up tsunami warnings
- Natural Hazards & Earth System Sciences : GPS water level measurements for Indonesia’s Tsunami Early Warning System / Near real-time GPS applications for tsunami early warning systems
- BBC : GPS network is quick quake sensor
Tuesday, May 8, 2012
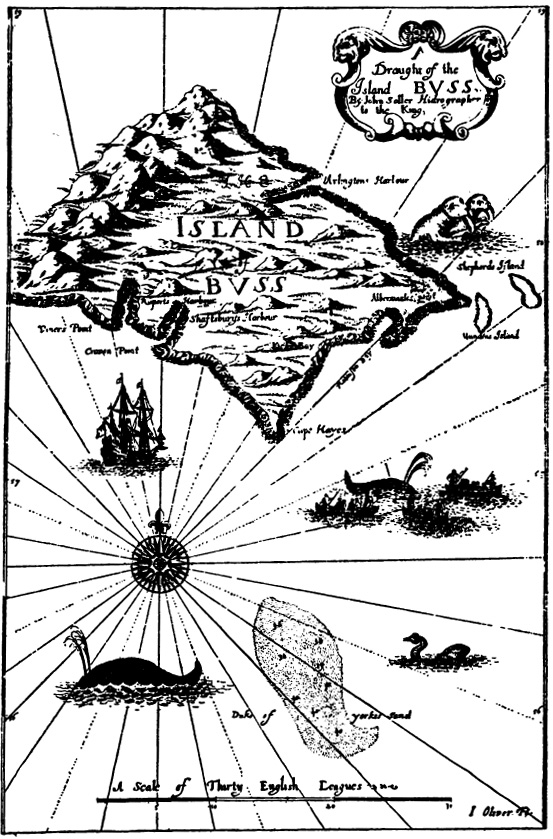
Lost Islands: the story of Islands that have vanished from nautical charts
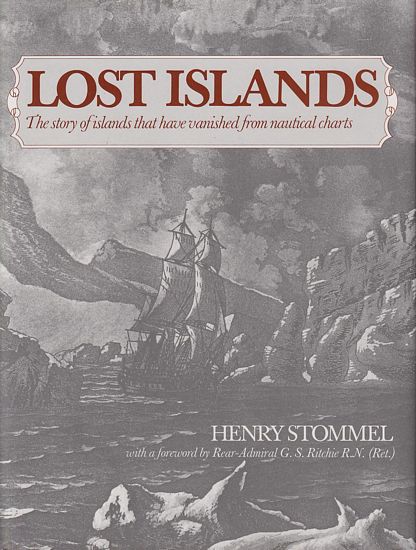
Until well into the nineteenth century, navigational methods were frequently so inaccurate that oceanic charts were deceptive and unreliable. It is no wonder, then, that small islands could be reported in more than one place and volcanic reefs or even icebergs inaccurately described and recorded as navigational hazards. The fascination of such errors to a marine scientist is understandable, but this attempt to make them interesting, let alone romantic, to a non-professional is a failure. In 22 truncated chapters, he treats a selection of these non-existent islands. In some cases he is able to describe how the inaccuracies may have happened, and the voyages and personalities involved. (Amazon)
From Frances M. Woodward, University of British Columbia Library
Water has always held a special attraction for human beings well beyond its uses in
sustaining life and providing routes for transportation.
As for islands - whether they be sandbars in a river or islands in the ocean - who does not yearn for a fantasy, a treasure, a lost island, a kingdom all their own?
The purpose of a nautical chart is to enable a ship to sail safely from place to place.
To do this, the navigator must know where all the islands and rocks, and any other navigational hazards are.
Sometimes, however, charts show islands which are not really there.
Nineteenth century nautical charts and atlases have some two hundred islands now known not to exist, but some of those islands are still shown on modern globes, commercial atlases, and official sailing directions.
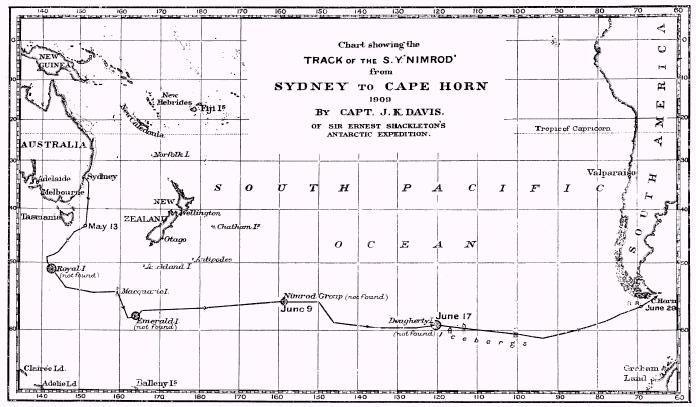
SY Nimrod. 1909 voyage : search for Dougherty and other phantom islands
Henry M. Stommel, oceanographer and senior scientist at Woods Hole Oceanographic Institute in Massachusetts, has written at least four other books in addition to the one presently being reviewed: The Gulf Stream' A Physical and Dynamical Description (1958); Kuroshio: Physical Aspects of the Japan Current (1972); Oceanographic Atlases: A guide to Their Coverage and Contents (1978); and Volcano Weather: The Year Without a Summer (1983).
In 1981, he was honoured with a festschrift, Evolution of Physical Oceanography: Scientific Surveys.
Stommel became interested in lost islands when he noted Ganges Island, shown as being east of Japan and in a fa vourable position for oceanographic monitoring of the Kuroshio Current, the great current system of the North Pacific, then discovered that the island did not exist.
Alerted and looking further, he discovered more non-existent islands.
Stommel uses Admiralty charts, an American list of doubtful islands compiled by Jeremiah N. Reynolds for the V.S. House Committee on Naval Affairs in 1828, and the International Hydrographic Bureau list to tell his story.
He considers only nineteenth and twentieth century charts, omitting legendary and fantastic islands unless they appear on the Admiralty charts.
"Choosing these charts assures that hard-headed practical mariners had authorized and edited them and that accurate chronometric navigation was in widespread use."
Stommel has divided his story into twenty-two chapters, most of which are six pages or less in length. The chapters are arranged chronologically and geographically.
Specific islands are discussed, including the history of their appearance, an explanation of the
error, and their banishment from (or persistence on) the charts.
There are twenty-five maps, seven of which are facsimiles, including Admiralty charts of the Indian Ocean (No. 748A, 1817), and of the Pacific Ocean (first issue of No. 2683, September 1859) which are in a pocket at the back of the book.
The other maps show the location of islands discussed in each chapter.
In addition, there are eleven other illustrations including a page from the Book of O'Brasil, and portraits of Captains Benjamin Morell and John De Greaves, discoverers of non-existent islands.
Jeremiah Reynolds' 1828 list of doubtful islands and dangers to navigation is reprinted in the first appendix (twelve pages).
Bermeja : isla fantasma ?
In the middle of the Gulf of Mexico an island has gone missing… and nobody knows where it is. Bermeja Island was clearly visible on national and international maps until the middle of the 20th century. (BBC : Mexico's Missing Island)
>>> geolocalization with the Marine GeoGarage <<<
In the middle of the Gulf of Mexico an island has gone missing… and nobody knows where it is. Bermeja Island was clearly visible on national and international maps until the middle of the 20th century. (BBC : Mexico's Missing Island)
>>> geolocalization with the Marine GeoGarage <<<
The second appendix is a bibliography of nineteen items, followed by a five-page index.
The page of acknowledgements includes sources for the facsimiles and photographs.
In addition to telling the stories of how non-existent islands have been put on the charts, Stommel has a chapter on "real islands that go up and down" including the creation of new volcanic islands such as Surtsey south of Iceland.
He describes how scientists from Woods Hole, including Stommel himself, discovered their own "lost island" which was seen both visually and on radar in 1980 but not closely examined, and which could not be found again nine months later.
In another chapter, he answers the question, "Do satellites settle the hash?"
A reef in the Indian Ocean and an island off Labrador were found on Landsat images in 1976, but very small islands and pinnacles of rock can escape detection unless they are very carefully sought for, and the analysis required is slow and very expensive.
Since 1893, few genuine islands have been discovered and "the main task has been one of extinguishing, one by one, little points of land, some of which, we cannot help thinking, ought to have existed."
This is a very readable book, with many interesting anecdotes.
It is also very informative, and can be used as a reference work. It is a good example of the use of records, ancient and modern, to explain the events of history and to make history entertaining.
It provides a good account of the development of nautical charts from the earliest efforts to the use of
the latest technology.
This book should be popular in most libraries, both academic and public, as well as map collections, appealing to anyone with a sense of adventure.
Links :
- Blog GeoGarage : Hy-Brasil, the other Atlantis
- TheMapHouse : Mythical islands
Monday, May 7, 2012
Voyage to the 'front line' of global warming
From AFP
When Cameron Dueck set sail to the Canadian Arctic to witness what he calls "the front line of climate change", he did so knowing he would have to brave seas that have killed scores of sailors and reduced men to cannibals.
For 450 years before the first successful voyage in 1906, people sought the Northwest Passage, a potentially lucrative shipping route linking Europe to Asia that would cut out the lengthy journey around the horn of South America.
Many died trying to find it, including Sir John Franklin whose HMS Erebus and HMS Terror attempted the fabled Passage in 1845 but sank without a trace.
Their 129 men died eating each other on the unforgiving ice.
But by the time Dueck set off on his voyage more than 100 years later in June 2009, 35 sailing yachts had made the trip.
The majority of those took place after 1990, made possible by a stark reality: the ice was now melting fast.
"I wanted to see something very few people have seen," Hong Kong-based journalist and sailor Dueck told AFP at the launch of his book about the voyage, "The New Northwest Passage" at the Royal Hong Kong Yacht Club last week.
"It was about finding out what climate change looked like for real. Not just in terms of what we're told by politicians, or what corporations say in their mission statements," he said.
The extent to which Arctic ice is breaking up is an illustration of the growing impact of climate change in the Poles, where temperatures are rising more quickly than the rest of the world.
"There has been no ice for up to a month in the last several years during the summer," Peter Semotiuk, a long term resident of the Canadian Arctic and an expert on sailing conditions in the area, told AFP by email.
Semotiuk said the 2011 season featured the highest number of yachts ever to complete the Passage, with 16 making it through -- more than double the previous year's seven.
"I do see the effect of less ice cover through the Northwest Passage route," Semotiuk said, adding that commercial shipping is also on the increase as the ice melts. "It seems the whole Arctic ice pack is affected."
Dueck and his three crewmates sailed the 40 foot Silent Sound 8,000 nautical miles -- or 15,000 kilometres -- from Victoria in British Columbia, up to Dutch Harbor in Alaska, through the Bering Straight, down into the Beaufort Sea before hitting the Davis Strait between Canada and Greenland.
What they found was startling.
While the loss of Arctic sea ice threatens wildlife such as polar bears, seals and walruses that depend on it as a platform for hunting, mating and migration, the human cost is less well charted, said Dueck.
He met Alaskan fishermen who sail the Bering Sea for fish and crabs, and who are increasingly joining the dots between disappearing ice, warmer temperatures and their own changing fortunes.
Then there is the Inuit -- who have been forced to change their lives due to the impact of climate change, from harvesting berries a month earlier than they used to, to ancestral hunting knowledge being reduced to irrelevance by the swiftly warming environment.
"They used to be able to read the ice -- look at wind, temperatures, the moon phase and understand when it was safe to be on the ice and when it was time to pack up and head to shore," said Dueck.
"But these days, they no longer trust the ice, or their traditional ways of reading the ice, because it is breaking up sooner and no longer according to the patterns they know."
While Dueck admits such anecdotal evidence has not been fully processed scientifically, "when every hunter you meet is saying the same thing, that tells you all you need to know".
Then there is a sociological impact.
With climate change reducing the scope for traditional Inuit customs, younger generations face an identity crisis in a community already struggling with alcohol and other issues.
"They need to know who they are and why they are living there. Without that connection to the land they lose their identity, their pride," said Dueck.
"The hunting is a kind of safety net and when that's eroded, the communities go astray."
While the ice is a life-giver for the Arctic and its inhabitants, for Dueck it was a constant threat capable of crushing the hull of his boat and putting his crew into the water.
The dangerous voyage has been made by far fewer people than have climbed Mount Everest, but numbers have been rising each year since 2007, when the Passage was open water from East to West for the first time in living memory.
Dueck and his crew spent four months and four days at sea -- and getting on with each other was as much a challenge as navigating through unpredictable ice patterns.
"When you're on a 40 foot boat at sea, there's not much you can do if you don't like each other," said Dueck.
One of the crew did jump ship after a month as the pressures -- from on-deck showers using buckets of freezing water to the exhaustion of sailing through constantly moving ice -- took their toll.
"You don't stop, you keep going 24 hours a day," said Dueck. The crew took three-hour shifts at the helm, averaging a total of 8 hours on deck a day in freezing rain, fog and punishing winds.
"In early summer the midnight sun was still high enough that we could see. As summer progressed it got darker and darker.
"For the last half of our time above the Arctic Circle we were sailing through dark nights, so we had the terror of knowing that if you strike ice you're likely to end up in your lifeboat. That is terrifying, especially during storms."
Perhaps equally challenging is the re-entry into society at the end.
"Any time you come back from sea it's astounding how loud and how busy life on land is, said Dueck. "That was something you'd cherish in the Arctic. Time at sea to reflect. Time to think."
Sunday, May 6, 2012
Iran slams Google for leaving Persian Gulf nameless

Iran on Saturday criticized Google for leaving the body of water
separating it from the Arabian peninsula nameless on its online map
service, saying it would hurt the Internet giant's credibility and
creditability.
From FARSNews
"Google fabricating lies... will not have any outcome but for its users to lose trust in the data the company provides," Deputy Minister of Culture and Islamic Guidance Bahman Dorri told the Islamic republic news agency.

Marine GeoGarage with Admiralty chart
Historical evidence shows the water has always been "Persian," and that the Persian Gulf's identity is part of Iran's territorial integrity.

"The enemies cannot hide facts and evidence about the Persian Gulf," Dorri said.
"Documents in the UN and the UNESCO show the name of this body of water has always been 'Persian Gulf' since a long time ago."
"The efforts of the (global) arrogance and its Arab allies to remove the name of the Persian Gulf will result in its name becoming more durable," he added in a reference to the United States.
While historical documents show that the waterway has always been referred to as the 'Persian Gulf', certain Arab states have recently mounted efforts to remove 'Persian' from the name of the waterway.
In early 2010, the Riyadh-based Islamic Solidarity Sports Federation cancelled sports events after Iran used the term "Persian Gulf" on medals for the event it was seeking to host.

Iran designated April 30 as the National Persian Gulf Day (video) to highlight the fact that the waterway has been referred to by historians and ancient texts as 'Persian' since the Achaemenid Empire was established in what is now modern day Iran.
In July 2009, archeological excavations in the Iranian port city of Siraf yielded new evidence confirming the antiquity of the Persian Gulf title.
The Iranian archeologists discovered Sassanid and early-Islamic residential strata as well as a number of intact amphoras used in sea trade during the Parthian, Abbasid and early Islamic eras, all referring to the waterway as the Persian Gulf.
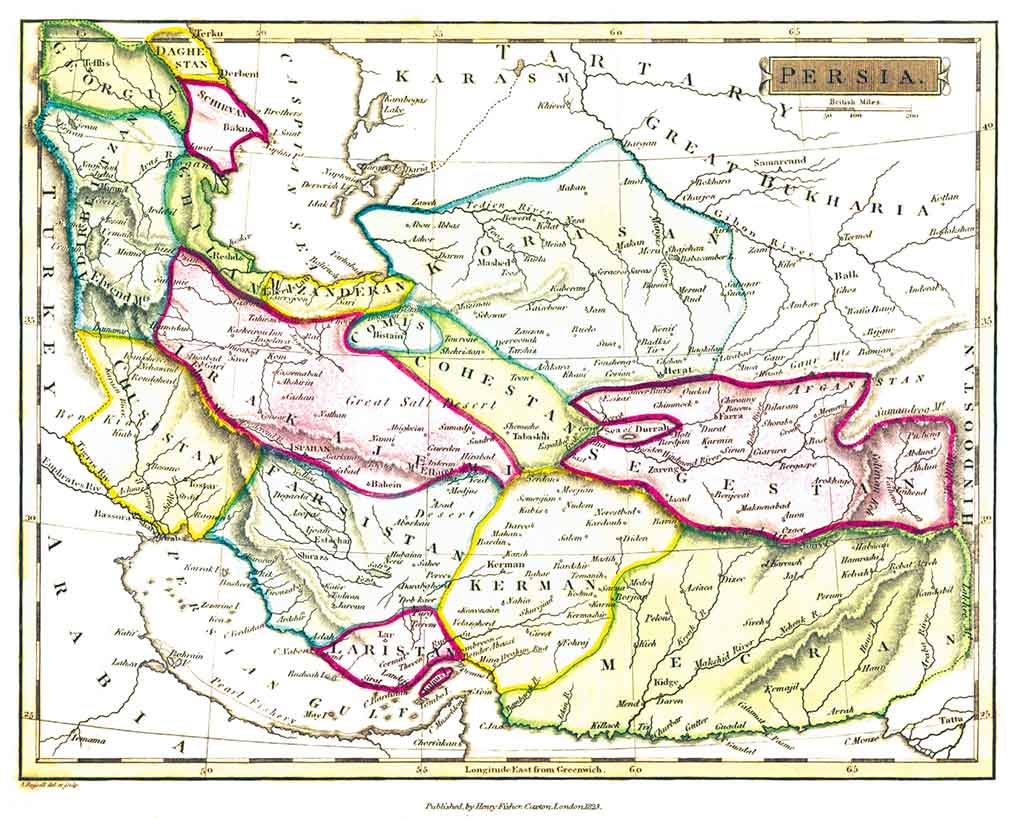
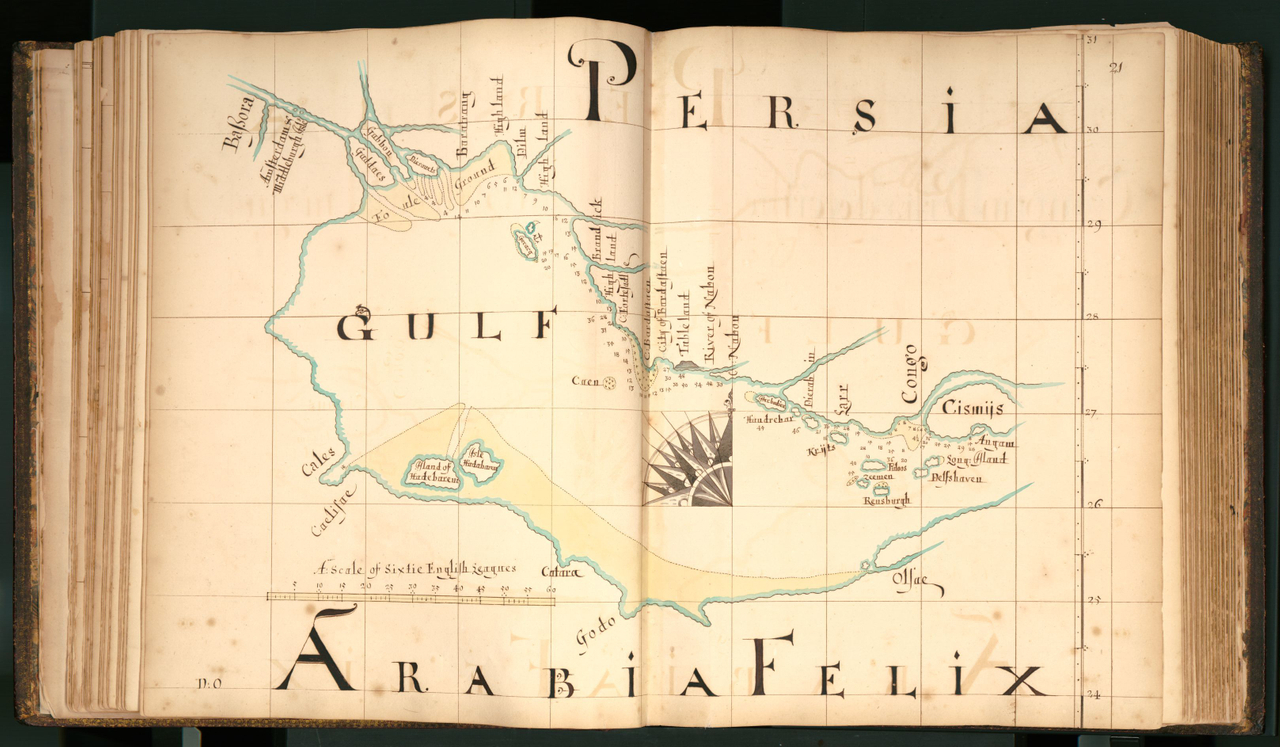 William Hack, [c. 1690], Chart of the west part of the Persian Gulf.
 According to a book titled The Persian Gulf and the Strait of Hormuz By Rouhollah K. Ramazani, who is Iranian the length of the Iranian coastline on the Gulf is 635 nautical miles while the length of the coastline of the Arabian Gulf countries on the Gulf is nearly double , 1113 nautical miles to be exact.
(UAE 420, Saudi Arabia 296, Qatar 204, Kuwait 115, Bahrain 68, Iraq 10). This is one reason why the Arabian Gulf nations insist that the Gulf should be called the Arabian Gulf and not the Persian Gulf. (see Maps)
Based on the coastline length on the Gulf the Arabs perhaps should be more angry at Google than the Iranians for not naming it the Arabian Gulf. (vote)
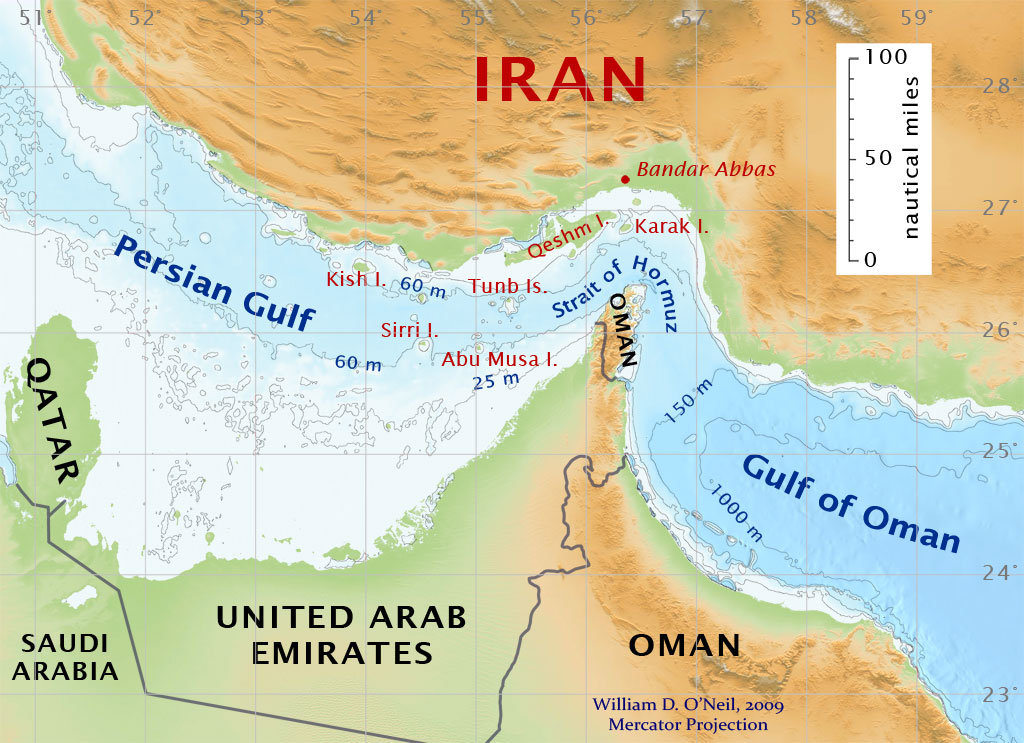
Abu Musa island which commands the vital Strait of Hormuz,
has become the focal point of tension
Note : Another point of contention between the Islamic republic and its southern Arab neighbours is the group of three barren islands in the Gulf over which both Iran and the United Arab Emirates claim territorial sovereignty.
(see WP article / video)
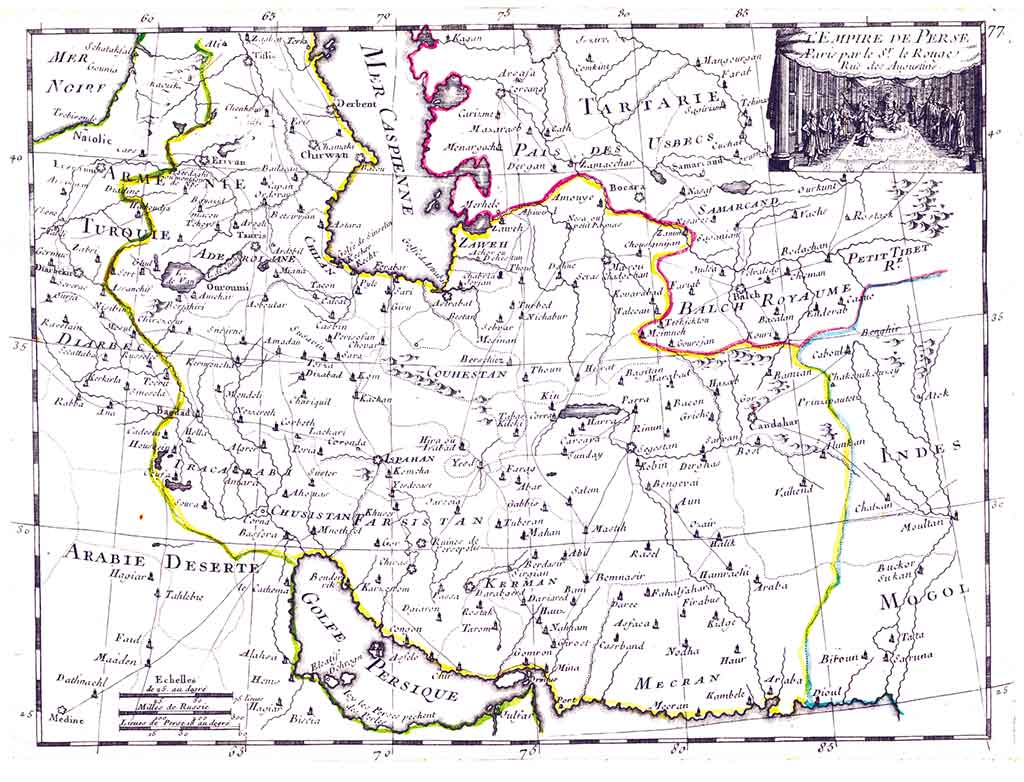
 Mannevillette (1745) Persian Gulf
Links :
- BBC : Google Map's missing Gulf angers Iranians
- Online petition
- Iranian internet users have previously mounted a successful ‘Google bomb’ campaign around the Gulf, so that users searching for Arabian Gulf were directed to a page with this message
Army of sea urchins
Off the Californian coast, giant kelp grow to gigantic sizes.
They provide a good source of food to armies of industrious sea urchins, which attack them in force in a seemingly unending chase of life seeking food.
Subscribe to:
Posts (Atom)