Saturday, June 25, 2011

Ingenious 'Flat Earth' theory revealed in old map

Map of the Earth made in 1893 by Orlando Ferguson of Hot Springs, South Dakota. Credit : Don Homuth  

From LifesLittleMysteries 

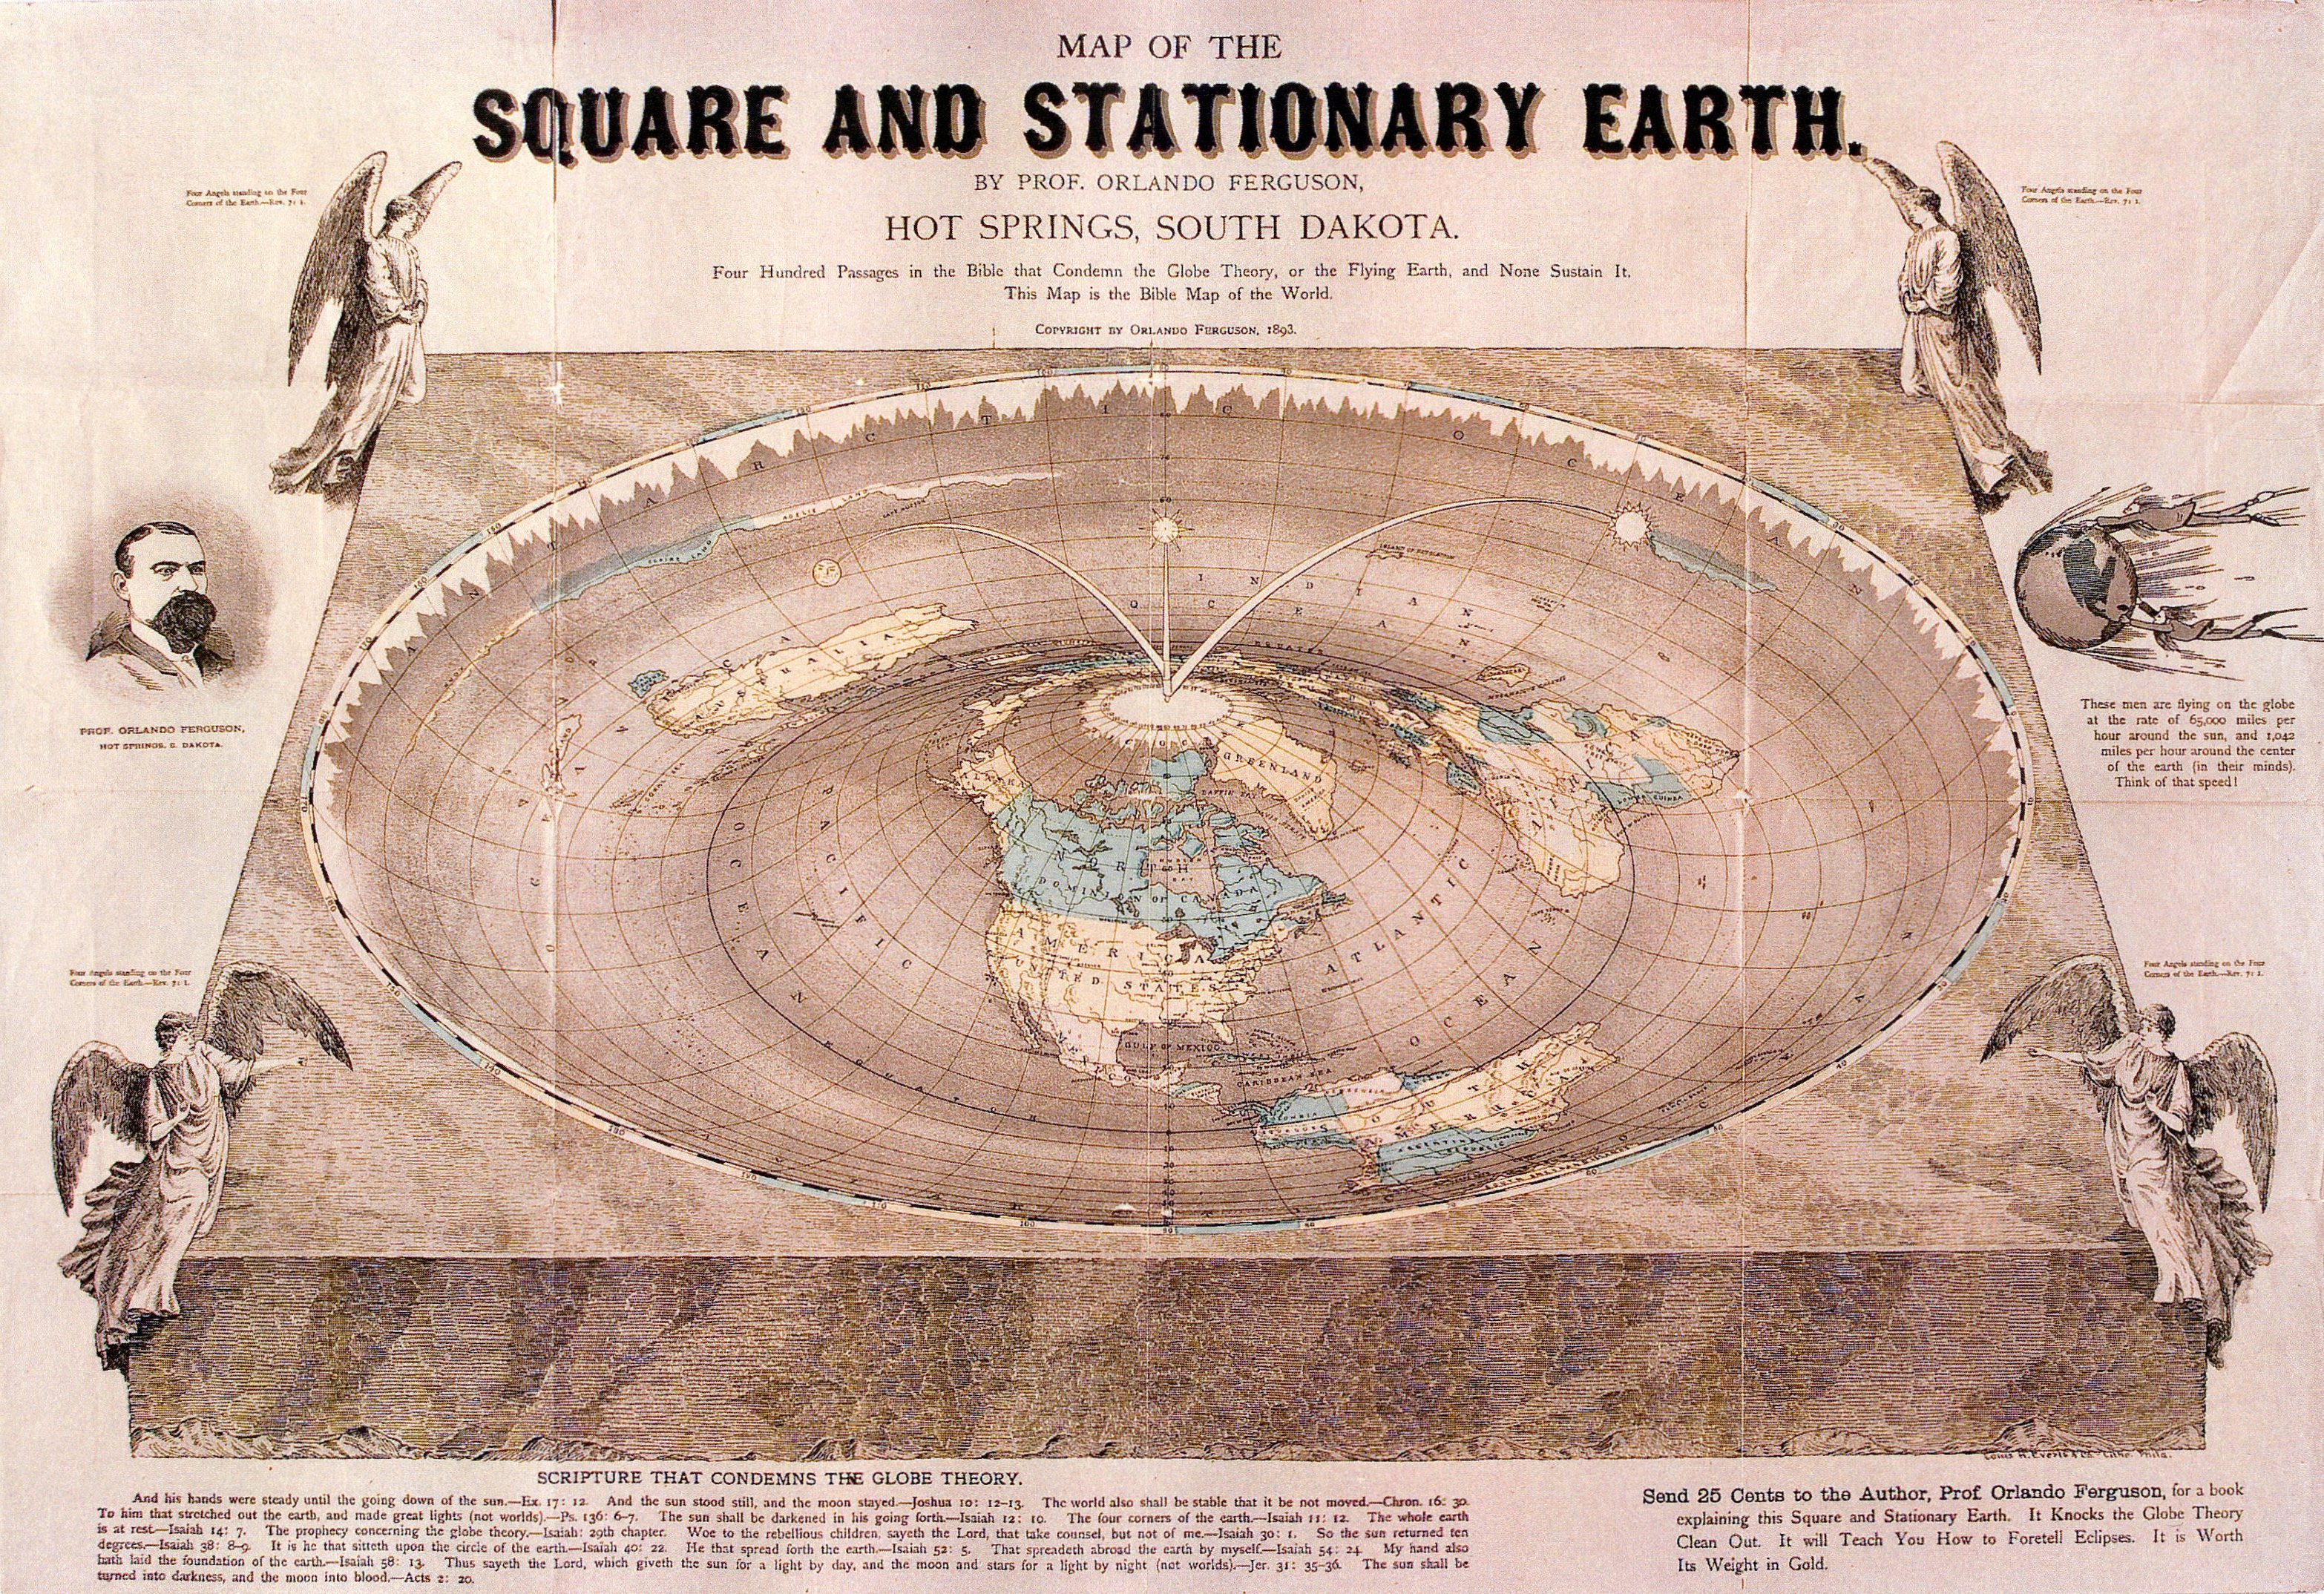
In 1893, Orlando Ferguson, a real estate developer based in South Dakota, drew a map of the Earth that combined biblical and scientific knowledge in a unique way.
The map accompanied a 92-page lecture that Ferguson — referring to himself as a "professor" — delivered in town after town, traveling far and wide to share his theory of geography, highlighted by his belief that the Earth was flat.
Ferguson's map represents the Earth as a giant, rectangular slab with a dimpled upper surface. Don Homuth of Salem, Ore., just donated one of two intact copies of the map to the Library of Congress.
"It's very fragile. It's printed on tissue paper and hand-colored with watercolors," Homuth said.
He got the map from his eighth grade history teacher in Fargo, N.D., who got it from his grandfather, who lived in Hot Springs, S.D. — Ferguson's hometown
 "Now, I'm 67. I don't want it to fall into the hands of relatives, for God's sake! And I don't particularly want to sell it. So we thought we'd send it to the Library of Congress," Homuth told Life's Little Mysteries, a sister site to LiveScience.
 
The only other copy is housed in the Pioneer Historical Museum in Hot Springs.
James Bingham, chairman of the museum's board of directors, told us what he knows about it. "Ferguson was trying to make an updated version of the flat Earth theory to fit the biblical description of the Earth with known facts," Bingham said.
Typical of flat Earths, Ferguson's Earth is a rectangular slab, the four corners of which are each guarded by an angel.
"What makes his flat Earth different from other theories is his theory holds that the Earth is imprinted with an 'inverse toroid.'"
If you were to take a donut and press it into wet cement and then remove the donut, Bingham explained, the rounded impression it left in the cement would be what is known in mathematics as an inverse toroid.
"It's pretty clever because it explains the Columbus phenomenon, where you see ships coming in over the horizon and gradually the mast gets taller and taller until you can see the ship," Bingham said. 
By 1893, most people knew about horizons so he had to come up with some way to explain that."
The map also has a picture of a man holding onto the Earth for dear life, with an inscription that reads: "These men are flying on the globe at a rate of 65,000 miles per hour around the sun, and 1,042 miles per hour around the center of the earth (in their minds).
Think of the speed!"
Yeah right, Ferguson seems to have been implying.
[Read: What's at the Center of the Milky Way?] "These people truly believed that the Earth is not a globe!" Homuth said.
"A lot of stuff like this got ignored and swept into history's wastebasket. But at the time people actually believed this stuff!"
Incredibly, some people still do. The Flat Earth Society is an active organization currently led by a Virginian man named Daniel Shenton.
Though Shenton believes in evolution and global warming, he and his hundreds, if not thousands, of followers worldwide also believe that the Earth is a disc that you can fall off of.
"I haven't taken this position just to be difficult," Shenton told The Guardian last year.
"To look around, the world does appear to be flat, so I think it is incumbent on others to prove decisively that it isn't. And I don't think that burden of proof has been met yet."
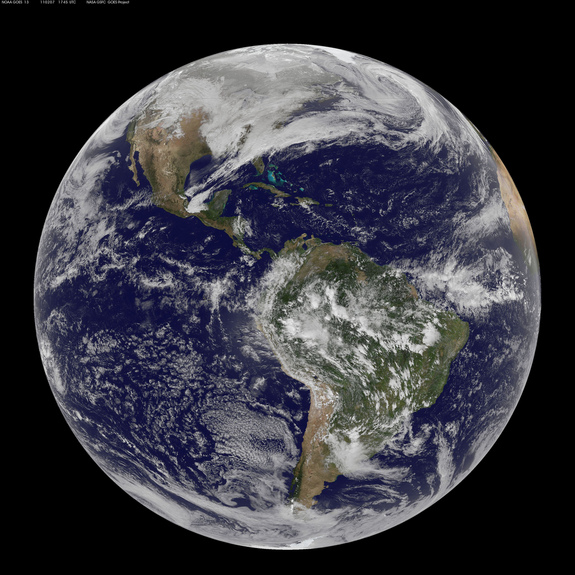
To Mr. Shenton, we offer this NASA/NOAA GOES-13 satellite image of our planet as it looked on March 2, 2010.

 Links :

Friday, June 24, 2011

Image of the week : ghostly rainbow

What in the world? A bright display in the clouds.

From OurAmazingPlanet

A colorful apparition materialized over Washington this week; the rarely glimpsed, rainbow-tinted specter appeared and vanished in the space of just minutes.

Fortunately for anyone who didn't look up at precisely the right moment, an enterprising resident of Anacortes, a small town about 80 miles (128 kilometers) north of Seattle, captured the mysterious light show on film.

"My wife said, 'Wow, look at that! Too bad you don't have your camera,'" said Del Zane, a retired software executive and photographer.

The couple was in the car after a morning bike ride and lunch — and just a half-mile from home. "So I just gunned it," Zane said.

A few minutes and a mad dash later, Zane had his camera in hand, pointed it skyward and started snapping pictures.

"It was very colorful and striking, and in just a small portion of the sky," Zane told OurAmazingPlanet. "I hadn't seen anything like it, that's for darn sure."

The colorful phenomenon, known officially as a circumhorizon arc, occurs when sunlight strikes cirrus clouds — the kind that typically look like cotton candy and form very high in the sky — at a certain angle.

"Cirrus clouds are composed entirely of ice crystals because they're so high up," said NASA's Rob Gutro.
"The higher up you go, the colder it gets and they're beyond the freezing point."

The clouds' ice crystals act the same way crystals in a sparkly bracelet or ring might. When light hits the crystals' facets at a certain angle, it is separated out into all the colors in the spectrum.

However, because the light show depends on the sun's angle, these cirrus rainbows can be seen only at certain times of the year in certain spots on the globe.

"It depends on the position of the observer," Gutro told OurAmazingPlanet.

The sun must be at an angle above 58 degrees, so the further from the equator you are, the shorter your window to see a circumhorizon arc, according to the website Atmospheric Optics.

In Seattle, the sun is high enough to produce the colorful spectacles from May through August.
Travel south to Houston, where the sun stays higher in the sky for a longer portion of the year, and you can catch a glimpse from March through September.

Zane said he's pleased with his pictures, but says even they don't quite capture the brilliance that was briefly on display.

"We looked up and it was beautiful," Zane said. "I'd say it was there probably no more than ten minutes."

Links :

Thursday, June 23, 2011

Google imagery used to identify marine animal behavior

Examples of halos (A, B) and reef within halos (C) found at Heron Island, GBR, Australia
Yellow boxes in (A) and (B) indicate approximate scale of subsequent photos.
Images (A) and (B) from Google Earth.
(D) Black circles, left-hand axis: percent of algae consumed during grazing assay.
Positive values indicate net reduction in algal biomass;
negative values can be interpreted as net increase of algal biomass due to algal growth.
Grey bars, right-hand axis: standing biomass of algal assemblage surrounding reef, primarily Hincksia sp. Circles and bars are means ± s.e.m.


>>> geolocalization with the Marine GeoGarage <<<

From MongaBay

From the all-seeing eye of Google Earth, one can spy the tip of Mount Everest, traffic on 5th Avenue in Manhattan, and the ruins of Machu Picchu, but who would have guessed everyone's favorite interactive globe would also provide marine biologists a God's-eye view of fish behavior?
Well, a new study (
Landscape of fear visible from space) in the just-launched Scientific Reports has discovered visible evidence on Google Earth of the interactions between marine predators and prey in the Great Barrier Reef.

"Freely-available satellite imagery of the entire Earth’s surface via Google Earth allows examination of landscape features in even the most remote areas, including difficult-to-access habitats within them," the paper's authors write, adding that, "here we demonstrate […] it is possible to remotely observe the landscape-scale footprint of behavioral interactions between predators and prey on shallow coral reefs."

Studying the satellite imagery of lagoons around remote and protected
Heron Island in the Great Barrier Reef, researchers found that they could easily identify a phenomenon known as 'grazing halos'.
Scientists believe these 'grazing halos' are created by hungry herbivorous fish and sea urchins who pick a region clean of seaweed, revealing the substrate beneath.
Seeking protection from predators in a reef, these herbivores venture out to feed only so far, creating a halo-shape around their refuge.
Therefore, these areas are the result of a complex game of cat-and-mouse between marine predators and their cautious prey.

"The collective antipredator behavioral patterns of small herbivores are sufficient to shape the distribution of vegetation on a scale clearly visible from space," the authors state.

After observing the distinct halos on Google Earth, researchers then ventured to Heron Island to examine the evidence on the ground.
They found that herbivores grazed outward from patch reefs in a 9 meter radius, leaving the area bare of seaweed but covered in algae.
Wariness of predators likely keep the plant-eaters from straying further.

The research adds further evidence of the important role predators have in shaping the world's ecosystems, since such grazing halos likely do not occur in ecosystems where marine predators have been wiped out by fisheries.
Other studies have shown an analogous impact between land animals, such as wolves and elk. For example, the presence of wolves restrains elk herds from overgrazing, allowing forests—and biodiversity—to flourish.

The scientists believe their study could be replicated again in both marine and land environments in order to "remotely [monitor] predator-prey interactions through the patterns they generate over the landscape."
With such easy-to-access data, researchers could, according to the paper, quickly and cheaply monitor how effectively parks safeguard predator populations.

"The technique could allow remote monitoring of cascading, indirect effects of predator removals (e.g., due to fishing; hunting) and/or reintroduction (e.g., North America’s wolves; India’s cheetahs; African game reserves) anywhere on earth," the scientists conclude.

Wednesday, June 22, 2011

World's oceans in 'shocking' decline


The oceans are in a worse state than previously suspected,
according to an expert panel of scientists.

From BBC

In a new
report, they warn that ocean life is "at high risk of entering a phase of extinction of marine species unprecedented in human history".

They conclude that issues such as over-fishing, pollution and climate change are acting together in ways that have not previously been recognised.
The impacts, they say, are already affecting humanity.

The panel was convened by the International Programme on the State of the Ocean (IPSO), and brought together experts from different disciplines, including coral reef ecologists, toxicologists, and fisheries scientists.

Its report will be formally released later this week.

"The findings are shocking," said Alex Rogers, IPSO's scientific director and professor of conservation biology at Oxford University.
"As we considered the cumulative effect of what humankind does to the oceans, the implications became far worse than we had individually realised.
"We've sat in one forum and spoken to each other about what we're seeing, and we've ended up with a picture showing that almost right across the board we're seeing changes that are happening faster than we'd thought, or in ways that we didn't expect to see for hundreds of years."

These "accelerated" changes include melting of the Greenland and Antarctic ice sheets, sea level rise, and release of methane trapped in the sea bed.

Fast changes

"The rate of change is vastly exceeding what we were expecting even a couple of years ago," said
Ove Hoegh-Guldberg, a coral specialist from the University of Queensland in Australia.

Some species are already fished way beyond their limits - and may also be affected by other threats
"So if you look at almost everything, whether it's fisheries in temperate zones or coral reefs or Arctic sea ice, all of this is undergoing changes, but at a much faster rate than we had thought."

But more worrying than this, the team noted, are the ways in which different issues act synergistically to increase threats to marine life.

Some pollutants, for example, stick to the surfaces of tiny plastic particles that are now found in the ocean bed.
This increases the amounts of these pollutants that are consumed by bottom-feeding fish.
Plastic particles also assist the transport of algae from place to place, increasing the occurrence of toxic algal blooms - which are also caused by the influx of nutrient-rich pollution from agricultural land.

In a wider sense, ocean acidification, warming, local pollution and overfishing are acting together to increase the threat to coral reefs - so much so that three-quarters of the world's reefs are at risk of severe decline.

Carbon deposits

Life on Earth has gone through five "mass extinction events" caused by events such as asteroid impacts; and it is often said that humanity's combined impact is causing a sixth such event.

The IPSO report concludes that it is too early to say definitively.
But the trends are such that it is likely to happen, they say - and far faster than any of the previous five.

"What we're seeing at the moment is unprecedented in the fossil record - the environmental changes are much more rapid," Professor
Alex Rogers told BBC News.
"We've still got most of the world's biodiversity, but the actual rate of extinction is much higher [than in past events] - and what we face is certainly a globally significant extinction event."

The report also notes that previous mass extinction events have been associated with trends being observed now - disturbances of the carbon cycle, and acidification and hypoxia (depletion of oxygen) of seawater.

Levels of CO2 being absorbed by the oceans are already far greater than during the great extinction of marine species 55 million years ago (during the Paleocene-Eocene Thermal Maximum), it concludes.

Blue planet

The report's conclusions will be presented at UN headquarters in New York this week, when government delegates begin discussions on reforming governance of the oceans.

IPSO's immediate recommendations include:
  • stopping exploitative fishing now, with special emphasis on the high seas where currently there is little effective regulation
  • mapping and then reducing the input of pollutants including plastics, agricultural fertilisers and human waste
  • making sharp reductions in greenhouse gas emissions.
Carbon dioxide levels are now so high, it says, that ways of pulling the gas out of the atmosphere need to be researched urgently - but not using techniques, such as iron fertilisation, that lead to more CO2 entering the oceans.

"We have to bring down CO2 emissions to zero within about 20 years," Professor Hoegh-Guldberg told BBC News.
"If we don't do that, we're going to see steady acidification of the seas, heat events that are wiping out things like kelp forests and coral reefs, and we'll see a very different ocean."

Another of the report's authors,
Dan Laffoley, marine chair of the World Commission on Protected Areas and an adviser to the International Union for the Conservation of Nature (IUCN), admitted the challenges were vast.

"But unlike previous generations, we know what now needs to happen," he said.
"The time to protect the blue heart of our planet is now."

Links :

Tuesday, June 21, 2011

NZ Linz update in the Marine GeoGarage

NZ6612 Dunedin Wharves

16
charts have been updated in the Marine GeoGarage (Linz May update published 9 June, 2011) :

  • NZ82 : Tonga
  • NZ541 : Mayor Island to Town Point (Okurei Point)
  • NZ615 : Marlborough Sounds
  • NZ822 : Vava'u Group
  • NZ4634 : Entrance to Wellington Harbour and Plans of Wharves
  • NZ5219 : Approaches to Marsden Point
  • NZ5411 : Tauranga Harbour, Katikati Entrance to Mount Maunganui
  • NZ5413 : Approaches to Tauranga
  • NZ5612 : Napier Roads / Napier Harbour
  • NZ6144 : Abel Tasman
  • NZ6151 : Plans in the Marlborough Sounds
  • NZ6152 : Pelorous Sound and Havelock
  • NZ6153 : Queen Charlotte Sound
  • NZ6154 : Tory Channel Entrance and Picton Harbour
  • NZ6422 : Approaches to Timaru /Timaru Harbour
  • NZ6612 : Otago Harbour / Port Chalmers / Dunedin Wharves
Today NZ Linz charts (178 charts / 340 including sub-charts) are displayed in the Marine GeoGarage.

Note : LINZ produces official nautical charts to aid safe navigation in New Zealand waters and certain areas of Antarctica and the South-West Pacific.
Using charts safely involves keeping them up-to-date using Notices to Mariners

Brazil DHN update in the Marine GeoGarage

1511 Barra Rio de Janeiro

10
charts have been updated (DHN update 07/06/2011)

  • 220 DA BARRA NORTE AO PORTO DE SANTANA
  • 242 DA ILHA DOS PORCOS À BAÍA DO VIEIRA GRANDE
  • 720 DE AREIA BRANCA A GUAMARÉ
  • 1504 ENSEADA DE BÚZIOS
  • 1511 BARRA DO RIO DE JANEIRO
  • 1623 PORTO DE ITAGUAÍ
  • 2100 DE MOSTARDAS AO RIO GRANDE
  • 2112 DE RIO GRANDE A FEITORIA
  • 21010 DE CAYENNE AO CABO GURUPI
  • 23100 DO RIO DE JANEIRO À SANTOS
Today 238 charts (283 including sub-charts) from DHN are displayed in the Marine GeoGarage

Canada CHS update in the Marine GeoGarage

2085 Toronto harbour

38 charts have been updated and 5 charts added (CHS update, May 31)

  • 1312 LAC SAINT-PIERRE
  • 1313 BATISCAN TO LAC SAINT-PIERRE
  • 1317 SAULT-AU-COCHON TO QUEBEC
  • 2085 TORONTO HARBOUR
  • 2251 MELDRUM BAY TO ST. JOSEPH ISLAND
  • 3442 NORTH PENDER ISLAND TO THETIS ISLAND
  • 3477 BEDWELL HARBOUR TO GEORGESON PASSAGE
  • 3478 PLANS SALTSPRING ISLAND
  • 3495 VANCOUVER HARBOUR EASTERN PORTION
  • 3513 STRAIT OF GEORGIA NORTHERN PORTION
  • 3536 PLANS STRAIGHT OF GEORGIA
  • 3860 HARBOURS ON THE WEST COAST OF GRAHAM ISLAND
  • 3893 MASSET INLET
  • 4002 GOLFE DU SAINT-LAURENT GULF OF ST. LAWRENCE
  • 4003 CAPE BRETON TO CAPE COD
  • 4013 HALIFAX TO SYDNEY
  • 4015 SYDNEY TO SAINT-PIERRE
  • 4022 CABOT STRAIT AND APPROACHES
  • 4211 CAPE LAHAVE TO LIVERPOOL BAY
  • 4233 CAPE CANSO TO COUNTRY ISLAND
  • 4234 COUNTRY ISLAND TO BARREN ISLAND
  • 4281 CANSO HARBOUR AND APPROACHES
  • 4307 CANSO HARBOUR TO STRAIT OF CANSO
  • 4320 EGG ISLAND TO WEST IRONBOUND ISLAND
  • 4335 STRAIT OF CANSO AND APPROACHES
  • 4384 PEARL ISLAND TO CAPE LA HAVE
  • 4394 LAHAVE RIVER WEST IRONBOUND ISLAND TO RIVERPORT
  • 4405 PICTOU ISLAND TO TRYON SHOALS
  • 4406 TRYON SHOALS TO CAPE EGMONT
  • 4486 BAIE DES CHALEURS
  • 4591 HALLS BAY AND SUNDAY COVE
  • 4616 BURIN INLET AND APPROACHES
  • 4624 LONG ISLAND TO ST. LAWRENCE HARBOURS
  • 4821 WHITE BAY AND NOTRE DAME BAY
  • 4851 TRINITY BAY - SOUTHERN PORTION
  • 4856 BONAVISTA BAY WESTERN PORTION
  • 4857 INDIAN BAY TO WADHAM ISLANDS
  • 4858 GREENSPOND HARBOUR TO POUND COVE
  • 4913 CARAQUET HARBOUR BAIE DE SHIPPEGAN AND MISCOU HARBOUR
  • 5027 MURPHY HEAD TO BUTTON ISLANDS
  • 7573 M'CLINTOCK CHANNEL LARSEN SOUND AND FRANKLIN STRAIT
  • 7778 CORONATION GULF EASTERN PORTION
  • 7784 VICTORIA STRAIT

So 699 charts (1659 including sub-charts) are available in the Canada CHS layer. (see coverage)

Note : don't forget to visit '
Notices to Mariners' published monthly and available from the Canadian Coast Guard both online or through a free hardcopy subscription service.
This essential publication provides the latest information on changes to the aids to navigation system, as well as updates from CHS regarding CHS charts and publications.
See also written Notices to Shipping and Navarea warnings :
NOTSHIP

Australia AHS update in the Marine GeoGarage

Aus635 Papua New Guinea - North East Coast

17 charts have been added in the Marine GeoGarage (AHS update 05/04/2011)

Aus635 Papua New Guinea - North East Coast - Approaches to Kwaiapan Bay
Aus816 Australia - East Coast - Queensland - North Spit to Breaksea Spit
Aus664 Papua New Quinea - Admiralty Islands - Kumuli Islands
Aus599 Australian Antarctic Territory - Gibbney Island to Kista Strait
Aus4728 Southern Ocean - Spencer Gulf to Tasmania
Aus714 Australia - North Coast - Northern Territory - New Year Island to Port Essington
Aus719 Australia - North Coast - Northern Territory - Cuthbert Point to New Year Island
Aus718 Australia - North Coast - Northern Territory - Cape Stewart to Cuthbert Point
Aus390 Papua New Guinea - South Pacific Ocean - Manus Island to Wuvulu Island
Aus678 Papua New Guinea - New Britain - North Coast - Garove Island
Aus4643 Australia East Coast - Cape Howe to Cape Moreton
Aus4644 Southern Ocean - Cape Otway to Cape Howe including Tasmania
Aus4725 Australia - West Coast - North West Cape to Cape Leeuwin
Aus4723 Australia - North West Coast - Java to North West Cape
Aus357 Australia South Coast - Victoria - South East Point to Point Hicks
Aus653 Papua New guinea - North East Coast - Plans in Papua new guinea (Sheet 7)
Aus671 Papua New Guinea - New Britain - South Coast - Plans in Papua New Guinea (Sheet 6)

25 charts
have been updated in the Marine GeoGarage (AHS update 05/04/2011)

Aus663 Paua New Guinea - South Pacific Ocean - Hermit Islands
Aus817 Australia East Coast - Queensland - Great Sandy Strait and Hervey Bay
Aus523 Papua New Guinea - North East Coast - Nassau Bay to Finschhafen
Aus134 Australia South Coast - South Australia - Port Lincoln and Approaches
Aus235 Australia East Coast - Queensland - Approaches to Moreton Bay
Aus236 Australia East Coast - Queensland - Moreton Bay
Aus327 Australia North West Coast - Western Australia - Port Walcott to Montebello Islands
Aus57 Australia North West Coast - Western Australia - Dampier Archipelago
Aus58 Australia North West Coast - Western Australia - Port of Dampier
Aus628 Papua New Guinea - Louiiade Archipelago - Nuakata Passage

Aus780 Australia South Coast - South Australia - Althorpe Islands to Backstairs Passage
Aus781 Australia South Coast - South Australia - Gulf St. Vincent
Aus668 Plans in Papua New Guinea (Sheet 9)
Aus200 Australia East Coast - New South Wales - Port Jackson
Aus203 Australia East Coast - New South Wales - Port Jackson(Western Sheet) Parramatta and Lane Cove Rivers
Aus51 Australia North West Coast - Western Australia - Port of Broome
Aus324 Australia - North West Coast - Western Australia - Lacepede Islands to Eighty Mile Beach
Aus325 Australia - North West Coast - Western Australia - Rowley Shoals to Bedout Islet
Aus329 Australia North West Coast - Western Australia - North West Cape to Point Cloates
Aus349 Australia South Coast - Victoria - Cape Nelson to Port phillip
Aus331 Australia West Coast - Western Australia - Point Quobba to Pepper Point
Aus316 Australia North Coast - Northern Territory - Charles Point to Pelican Island
Aus335 Australia West Coast - Western Australia - Cape Naturaliste to Point D'Entrecasteaux
Aus336 Australia South Coast - Western Australia - Cape Leeuwin to King George Sound
Aus614 Australia East Coast - Coral Sea - Diamond Passage

Today
462 AHS raster charts ( 787 including sub-charts) are included in the Marine GeoGarage viewer.

Note : AHS updates their nautical charts with corrections published in:

World Hydrography Day


Mary Glackin, NOAA's Deputy Under Secretary, honors the nation's hydrographers
as she explains how hydrography supports the U.S. economy, keeps mariners safe,
and protects our coastal communities and ecosystems.

From NOAA

World Hydrography Day, celebrated in maritime countries around the world, is a time to recognize the ocean surveyors who map the oceans.
Thanks to hydrographers — in NOAA, in other federal agencies, and in private industry — this nation's safe and efficient maritime transportation system supports increased trade and economic growth for American industry and agriculture.

NOAA hydrographers measure oceans depths and search for underwater dangers to navigation, acquiring data for the nation's nautical charts and ocean models.
They have a long history of service to this country, beginning with President Thomas Jefferson's Survey of the Coast in 1807.


Hydrographers have historically played an important role in America.
During the Civil War, following the Confederate evacuation of Charleston in 1865,
hydrographers identified obstructions to the harbor, facilitating the resumption of commerce.

Hydrographic products continue to support updated navigational tools and charts, but today's data is used far beyond purposes envisioned in prior centuries.
From helping scientists understand the
movements of tsunamis, to characterizing essential underwater habitat for healthy fisheries, today's hydrographers contribute, more than ever, to a healthy ocean, vibrant coastal communities, and a growing maritime economy.

Bahamas WLP update in the GeoGarage

B48/B62 Morgan's Bluff
showing some shift between Google imagery and WLP charts

4 charts have been updated :
  • B43 : Joulter's Cays Cut
  • B48 : Morgan's Bluff
  • B62 : Morgan's Bluff, Commercial Harbour & Anchorage
  • B197 : Andros, North Shore Channel
12 charts have been added (Andros) :
  • B47 : Andros - High Rock to High Point Cay
  • B50 : Andros - Big Wood Cay to South Bight
  • B52 : Andros - Cargill Creek
  • B51 : Andros - Fresh Creek
  • B51A : Andros - Fresh Creek Plan
  • B75 : Andros - Stafford Creek
  • B207 : Andros - Morgan's Bluff to Fish Cays
  • B208 : Andros - Saddleback Cays to Fresh Creek Area
  • B209 : Andros - Plum Cays to North Bight
  • B270 : Andros - Kemps Bay Harbour
  • B163 : Andros - Staniard Creek
  • B163A : Andros - Staniard Cut
Today, 273 charts for Bahamas (from WLP) are published on the Marine GeoGarage

Monday, June 20, 2011

Swimming in Europe: every beach, lake and bathing spot ranked and mapped

The European Union has ranked every bathing spot in Europe.
Click on a dot to see more detail about that beach, lake or bathing spot.
The red stars are spots that are either closed or did not comply to the regulations
(Europe's bathing water : Google Fusion Table)

From TheGuardian

Do you like swimming outside?
But how clean is your beach?

Since 1990, the European Union has been monitoring over 21,000 beaches, lakes and rivers across Europe - anywhere where swimmers go al fresco, in fact.
So that huge dataset covers Brighton Beach, the Hamsptead swimming ponds and the classic Mediterranean beaches of the South of France, Spain and Greece.

So, what does the
data, out Thursday 16th from the European Environment Agency, show for your favorite beach?
The overall figures are good - 96.8% of our swimming areas meet the legal standards, if not the full guidelines.
This is down slightly on last year - but more swimming areas are now being surveyed.

The rankings only include outside swimming places - not man-made lidos or pools.

What is happening across Europe? According to the report:

In 2010, 92.1% of Europe's coastal bathing waters and 90.2% of inland bathing waters met the minimum quality standards. Only 1.2% of coastal bathing water and 2.8% of inland sites were non-compliant. The remainder are unclassified due to insufficient data.

In general, coastal bathing water quality deteriorated between 2009 and 2010 – the number of bathing water bodies meeting the mandatory values fell by 3.5%, while those meeting guide values fell by 9.5%.

Inland water quality has also dropped.
The number of rivers and lakes achieving the guide values fell by 10.2%, although compliance with the mandatory values was almost stationary.
Rivers were particularly problematic, with only 25% of river bathing waters achieving guide values.

If you want to, you can find out what variables from the Directive they use to rank each beach
here.

The EEA use six, slightly confusing, categories.
In plain language they mean:
  • CG - The best beaches, complying with the law and the guidelines
  • CI - complies with the mandatory requirements - but not the guidelines
  • B - banned or closed (temporarily or throughout the season)
  • NF - insufficiently sampled
  • NC - Does not comply with the legal requirements
  • NS - not sampled
Eventually we will try to map all of Europe's 21,000 beaches - and you can download every country's data here.

Links :

Sunday, June 19, 2011

Surfing: an exercise in spirituality


Nightsurf from Iker Elorrieta (Gure ametsa, eskerrik asko Iker)

"A dream without stars is a dream forgotten" Paul Eluard

From ManhattanBeach

The visionaries in Hollywood would have you believe that surfers are dumb beach bums who walk around shirtless with their shorts hanging halfway down their butts, calling everyone "dude" and "bro."
You know, the ones that are always "so stoked," or really excited.

Those guys exist, but most surfers are so much more.

These days, I know so many average, everyday people who surf.
Anyone can be a surfer.
Maybe your tax guy was out surfing this morning before he met with you about filing your tax extension.
Maybe the mom next door straps her board to the roof of her car before she drives her kids to school.
Even our kids' dentist and orthodontist (a husband and wife team) surf.
So do their kids.

Surfing is cool. Surfing is hip.
But the culture of surfing is about more than marketing a fantasy for the non-surfers.

For me, surfing is a spiritual experience.
I feel that I am with nature at its very best—and maybe a little closer to god—when I am in the water.

The ocean is a playground for the five senses, and surfing takes you to the core of the action.
I can't think of a better place to see, smell, taste, touch and hear, all at the same time.

When I see a pod of dolphins playing in the surf, I think, they get it.
These beautiful creatures instinctively get it.
Some people are like that, too.
Surfing is as natural to them as breathing—a beautiful gift.

Some surfers I know have a unique perspective about the ocean.
Some feel the ocean is a sacred place.
Some take that feeling too far, trying to keep other surfers out of their favorite surf spot and causing surfers to fear localism—all in the name of a wave.

Although many will say, “I’ve always wanted to learn how to surf,” not all will venture into the sea.
For as many people that say they love the ocean or want to learn how to surf, just as many say they don’t like the ocean and wouldn’t even go for a swim.

Maybe their fear of sharks keeps them on dry land.
(For the record: Yes, sharks live in the ocean, and yes, even in the water off our beloved Beach Cities, but no, I am not suggesting that a shark attack has ever taken place here.)
Maybe they just don't like sand between their toes.

Whatever their reason for remaining on shore, I can think of several to reasons to get wet, and I think more people are catching on to what makes surfing so special.

Surfing can be a great workout—both physically and mentally.
When I’m in the ocean, I am more aware.
Every breath I take feels like a clearing of my head, like a meditation.

But never turn your back on the ocean.

The waves can be powerful and at times, unpredictable.
I have a healthy respect for what I have felt first-hand on more than a couple of occasions.
A tumble in a wave, sometimes referred to as the washing machine, can be scary, but is also a rite of passage for any surfer.

Every wave caught is an accomplishment.
Nevertheless, I don’t measure a successful surf session by how many waves I've caught but by how I feel when I get out of the water.

I understand that surfing isn’t for everyone, and not all surfers view the ocean and the waves in the same light.
For me, it is the light in the ocean that keeps me coming back for more.

Links :