Saturday, March 2, 2024

Learn to draw wind lines in the style of portolan charts from the 13th-15th centuries


Acquire a skill that will probably be of no use to you: 
“Learn to draw wind lines in the style of portolan charts from the 13th-15th centuries”. 
It's really not complicated and it does magical things!

From @SavoirsEnBulles


 Three brief words of introduction: portulan charts are marine maps that appeared from the 13th century onwards, depicting mainly (at first) the Mediterranean and its shores.
Maps packed with fascinating details!
(Map: Dulcert Angelino, 1339, detail.)


But today, we're going to talk about the background: the "wind lines" or "Rhumb". 
These lines indicate the points of the compass, and were theoretically used to determine the direction from one point to another.
(Map: Benincasa Grazioso, 1467, detail.)
 
  This type of map therefore developed at the same time as the arrival of the compass, around the 12th or 13th century, since the compass offered the luxury of indicating North by day and night.

(ps: the image is totally anachronistic, but I couldn't resist)
And I don't know about you, but once we get there, we're already on to something very satisfying.
 
 
Let's move on to the practical side: although it may look very complex, the system of wind lines on a portolan is actually very simple. 
 
Next, use the compass to draw a circle (or circles) with a radius of two squares.
For this example, I've used two complete squares.
 
Note the 12 points where the first circle intersects the grid.
 
Connect a first crossing point to all other points on the same circle.
And do it for all the points. The first ones are the longest, since the further you go, the fewer strokes you have to do per stitch. I swear it's quick to do!

  And I don't know about you, but once we get there, we're already on to something very satisfying.
 
 For reasons unknown to me, some beautiful geometrical shapes appear, including a beautiful dodecagon in the middle (polygon with 12 vertices / 12 sides), or curious squares.
At this stage, you've done the same preparatory work as Pietro Vesconte around 1321, for this map of the Iberian Peninsula (South-facing map, so North is at the bottom!).
Well done!
 
It gets even more fun when you realize that the circles are connected... start, for example, by connecting the 11 points of the first circle to the one that touches the circle next to it (the 12th point).
 
So, if from the outset, rather than limiting ourselves to a circle, we draw straight lines rather than segments...

The result is rhumb lines
 
 
 As in the Pisan chart (circa 1290), the oldest known portolan (and probably the only one to have actually sailed, the others being mainly maps for drawing-room chic).
 
Or, of course, the extraordinary Catalan Atlas (1375).
On this one, it's easy to get lost as the 8 panels overlap a little, but I swear the structure is exactly the same, in 4 circles!
 
In short, you now know how to create a Rhumb line background to enhance your own map, whether realistic or imaginar
Granted, it's unlikely to save your life one day.
But you never know!


All the old maps used are available in high definition
on the incredible site of @laBnF: https://gallica.bnf.fr


Friday, March 1, 2024

New model based on Artificial Intelligence available in SailGrib/Weather4D mobile apps : ECMWF_AI_25

 
As of this morning, the European Computing Centre (CEP/ECMWF) has published its forecasting model based on artificial intelligence.
This model is available in SailGrib Android and Weather4D Routing & Navigation iOS (update 2.0.88) mobile apps under the name ECMWF AI 025.
Please note that this model is currently experimental.
 
ECMWF IFS forecasts at 0.25° resolution
 
 The model has a mesh size of 0.25° (≃27km) and is updated twice a day.
Its forecasts extend to 15 days in 6-hour steps.
It is available at 09:00 and 21:00 UTC.
This is the first artificial intelligence-based model whose forecasts are available.

In addition, the European Computing Centre's physics-based forecast model (ECMWF 025) is now available with a 0.25° mesh (≃27km) instead of 0.40° (≃43km).
It is always updated twice a day.
Its forecasts extend to 10 days in 3-hour steps.
It is available at 08:00 and 20:00 UTC.
 
Another new experimental model from ECMWF based on Machine Learning is also available :
AIFS model 0.25°, 15-days, available 4x day, approx. 8:50/13:50/20:50/01:50 UTC. 
 
Links :

Enhancing maritime security: Unseenlabs’ RF data collection campaign in the Southern Red Sea


Between November 20 and December 29, 2023, Unseenlabs conducted a focused ten-day RF data collection—with an average of one revisit per day—covering an area of 300,000 km² in the Southern Red Sea.
During this time, we successfully detected and tracked a number of dark vessels[1] in the area.
Amidst the turmoil in the Red Sea, largely due to Houthi attacks, it appears that some ships are exploiting the chaotic situation by turning off their AIS transponders, effectively rendering themselves invisible.
Here is where Unseenlabs enters the picture…
In this specific use case, we demonstrate how Unseenlabs' advanced space-based RF detection technology not only facilitated the detection but also enabled the tracking of these dark vessels in the Southern Red Sea.
This operation underscores the significant value of our innovative space technology for governments, offering them a comprehensive perspective on maritime traffic.
Our efforts once again highlight the pivotal role of Unseenlabs in enhancing maritime surveillance and security.

The context

The region our data collection campaign targeted is the Red Sea.
It is an inlet of the Indian Ocean nestled between Africa and Asia, and a region of first-level strategic and economic significance.
It connects the Bab el Mandeb strait and the Gulf of Aden in the south with the Sinai Peninsula and the Gulf of Suez in the north.
This area is pivotal due to its high concentration of commercial maritime traffic, playing a crucial role in the global economy, especially via the Suez Canal.
This canal "[...] handles about 12% of global trade and is accessed by vessels travelling from Asia via the 30km wide Bab-el-Mandeb strait"[2].
With over 6 million barrels of crude oil passing daily through the Bab-el-Mandeb strait, its security and surveillance are of paramount importance.
Recently, maritime trade in the Red Sea has been significantly impacted by the activities of the Yemen Houthi movement.
Disruptions in the region have affected vessel safety and maritime operations, necessitating enhanced measures for security.
Consequently, a new maritime military force has been established to strengthen the protection of these vital waterways, ensuring the continuity of trade and navigation.
An increase of unrevealed activities
Upon examining the maritime traffic data from November to December, it's observed that the maritime environment in the Southern Red Sea has grown significantly more hazardous: “Major shipping companies have stopped using the Red Sea - through which almost 15% of global seaborne trade usually passes - and are using a much longer route around southern Africa instead.”[3]
This decline is primarily attributed to the heightened risk for vessels navigating these waters due to the presence of the Houthis in the region.
However, Unseenlabs' satellite observations reveal another trend: an uptick in RF-only emitter detections.
On November 29, a significant presence of ships was noted in the Southern Red Sea, with our satellites detecting 212 RF emitters.
Of these, 208 correlated with AIS data, leaving only 4 as RF-only ships, or dark vessels.


Fast forward to December 26, and the picture changes markedly.
The region saw a decrease in overall maritime activity, largely due to the Houthi attacks on vessels.
Our satellites registered 187 emitters through RF signals, a decline of nearly 12% from the November 29 figures.Out of these, 159 were correlated with AIS, while 28 were identified as RF-only emitters.
This represents a staggering 600% increase in dark vessel activity between the two RF data collections.The implication is clear: more vessels are opting to navigate without their AIS transponders, effectively becoming invisible to standard monitoring systems.
These dark vessels are likely ships that have deactivated their AIS transponders to remain undetected and avoid encounters with the Houthis.
There's a possibility that among the vessels, some could be military ships; however, this cannot be confirmed as the AIS system is not mandatory for such vessels.


In this challenging environment, Unseenlabs' space-based RF detection technology emerges as a mission-critical asset in maritime surveillance.
Its ability to detect and track RF-only emitters offers a significant advantage in conflict zones where defense maritime forces are primarily engaged in peacekeeping.
We provide a more exhaustive view about the real maritime traffic.
Our technology not only enhances the capabilities of maritime authorities in monitoring vessel movements but also serves as a vital support system in monitoring and countering potential illegal activities in such high-tension areas.

Conclusion

Unseenlabs' RF data collection campaign in the Southern Red Sea from November 20 to December 29, 2023, has effectively showcased the capabilities of advanced space-based RF detection technology in maritime surveillance.
Our unique technology has been instrumental in offering a comprehensive view of maritime activities, especially in monitoring and tracking dark ships—vessel not broadcasting AIS signals.
Throughout the campaign, dark vessels account for 9% of the total maritime traffic observed, highlighting the effectiveness of our methodology.
Our approach involved detecting and geolocating RF signals from electromagnetic patterns and correlating them with AIS data, leading to the interception of 1,650 emitters, including 145 RF-only emitters.
These findings indicate a substantial presence of vessels operating covertly, likely in response to the heightened regional conflict and instability.
The significant increase in dark vessel activity, with many ships choosing to navigate without AIS transponders, underscores the critical role of Unseenlabs' technology in enhancing maritime security.
Our ability to track these vessels, demonstrated through 20 detailed data collections, not only aids in maintaining maritime safety but also assists authorities in identifying potential illicit activities.
The Unseenlabs campaign has demonstrated the vital importance of innovative RF detection technology in providing detailed insights into maritime traffic and security, especially in regions experiencing conflict and heightened maritime risks.
[1] Dark vessels, or dark ships, are ships that are not equipped with AIS system or manipulate it to evade traditional surveillance systems to become invisible.
[2] What is the Red Sea crisis, and what does it mean for global trade?, The Guardian
[3] Who are the Houthis and why are they attacking Red Sea ships? - BBC NEWS


Thursday, February 29, 2024

Uncovering dark vessels with fusion technology


From Spire

Spire Maritime partnered with Ursa Space to explore how shipping behavior related to Venezuela’s oil exports changed in response to US sanctions.


US sanctions were imposed on Venezuela’s oil exports in 2019.
This set the stage for a widely chronicled practice by which Caracas employed a “dark fleet” of oil tankers intent on evading detection, allowing Venezuela to keep exports afloat and generate revenue for its economy.

When vessels turn off their transponders, significant gaps in maritime coverage are created impacting the Maritime Domain Awareness for industries such as Defense and Security, Commodities, Insurance, etc.

Collaborating with Ursa Space, Spire Maritime addresses these challenges.
The fusion of Spire Maritime’s AIS data and SAR imagery from Ursa’s virtual constellation allows the detection and tracking of ships that go ‘dark,’ (i.e., not broadcasting AIS signals).
Going ‘dark’ does not always imply nefarious activity but may indicate that a vessel is hiding its location and identity to conceal illicit activities.
By detecting and tracking dark vessels, Spire and Ursa are enhancing efforts to enforce international sanctions, prevent illegal activities, and track commodity cargoes.

Ursa Space is an analytics-as-a-service provider whose platform orchestrates satellite data and delivers analytic services at scale.
In this scenario, we’ll focus on Ursa’s maritime solutions which can detect and identify vessels using SAR (synthetic aperture radar) imagery and AIS fusion.
SAR is well suited as it can penetrate clouds and capture data day or night.
This provides enhanced situational awareness at ports and seas, delivering reliable insights into the locations and identifications of vessels.

Spire Maritime has the largest proprietary satellite constellation, tracking over 600,000 vessels and 250,000 active vessels daily, providing the most comprehensive AIS data on the market dating back to 2010.
Users can track vessels anywhere and at any time, enhancing situational awareness, and leverage precise and actionable data for well-informed decision-making, even in congested traffic areas.

Using tipping and cueing for stronger global maritime defense and security

Analyzing data from Spire Maritime and Ursa Space, we have chosen to showcase oil exports dynamics from Venezuela during US sanctions and from the short period since the sanctions were lifted in October 2023.

It is crucial to note that the United States retains the ability to reimpose sanctions, if Venezuela fails to abide by the terms of the agreement, underscoring the delicate nature of this new chapter in international relations.
Sanctions can be reimposed if the government of President Nicolas Maduro fails to abide by the terms of an agreement signed last year for a fair presidential election.
Whatever the outcome, Venezuela’s oil exports are a critical source of income.

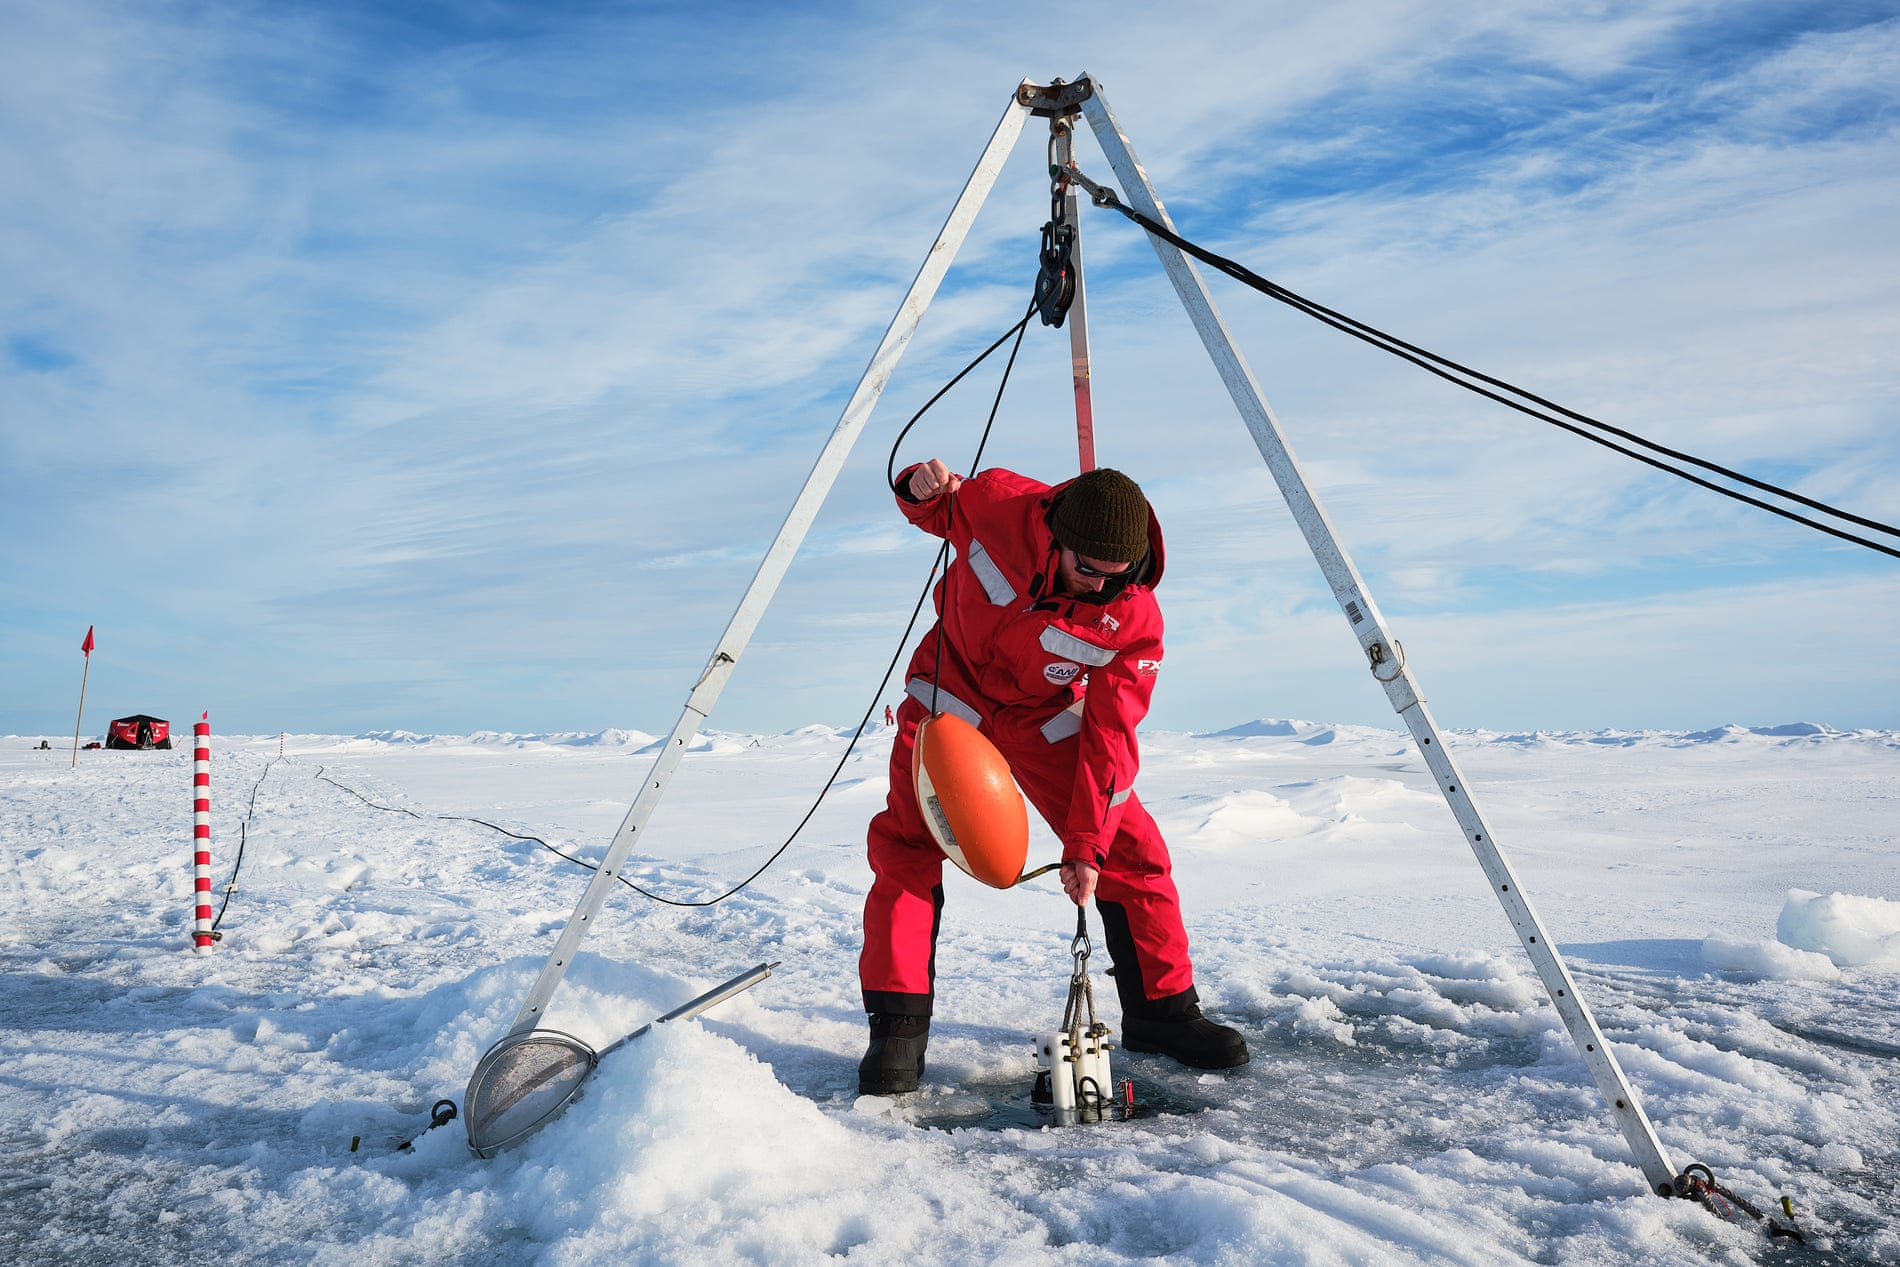
Tipping and cueing employ satellite monitoring to detect and monitor large objects.
Initially, a broad scan is conducted using a low-resolution satellite sensor, covering extensive areas in the ocean.
Once a “tip” is generated, the information is transmitted to the Ursa team for “cueing.” Subsequently, the high-resolution sensor is activated to obtain detailed information about the identified object.
We compare the scan with Spire Maritime’s AIS data to check the ship’s location.
This helps us find and track ships that turn off their transponders.

Understanding dark shipping detection methods with examples in action


The analysis involved examining shipping channels both inbound and outbound from Venezuela over the period of two years.
By pinpointing vessels that activated their AIS in the middle of the ocean, we were able to uncover unusual routes.
There was heavy shipping traffic along the northern coast of South America, but unusually, AIS tracks are much lighter-than-expected along the routes into Venezuelan ports.

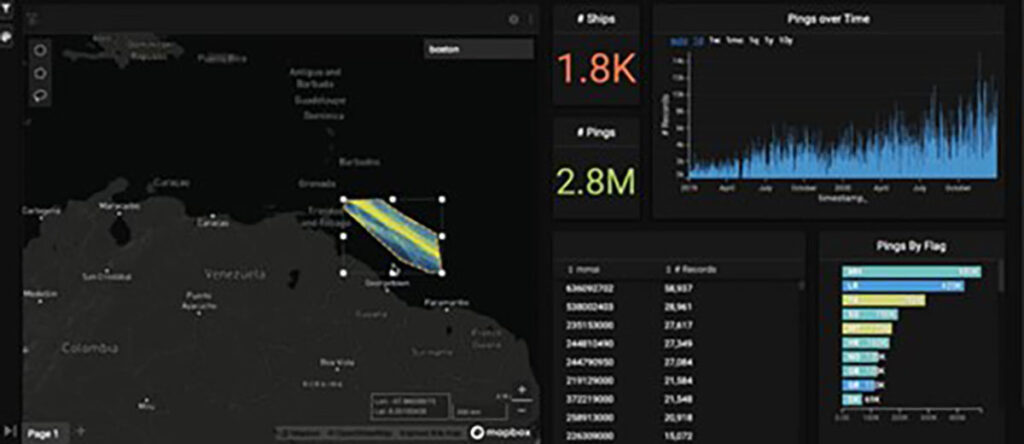
To examine the situation closer, the specific process involves taking a geographical slice by utilizing Spire Maritime’s Standard AIS data and applying a filter1 on the minutes since the last AIS contact (set to 24 hours), to identify ships that turned their AIS transponders on within the given geographic range but previously had their AIS off for an extended period.
(See figure 1)


Figure 1: Geographical slice in the Venezuelan waters

A total of 23 ships were identified through this process, signaling potential anomalies in the shipping channel.
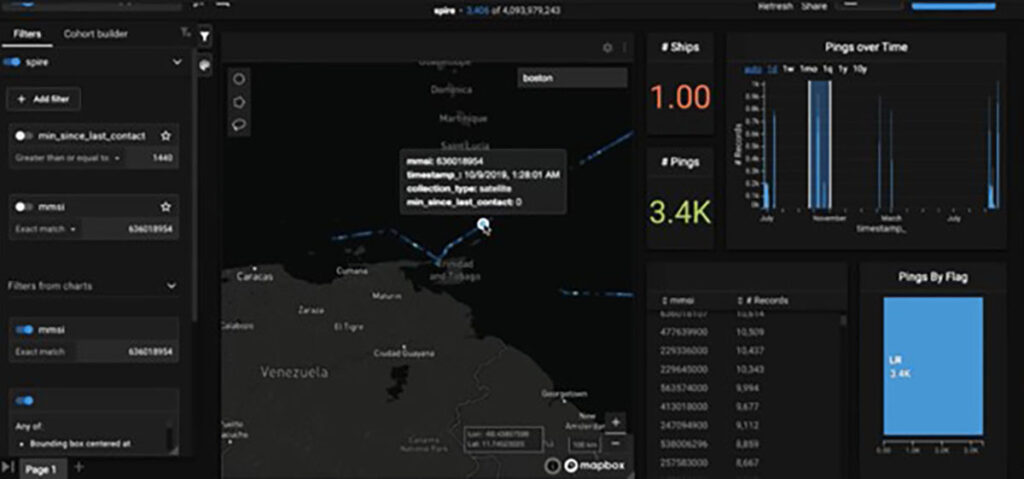
One particular vessel drew attention during the analysis (an MMSI search indicates it as a known bad actor, sparking further interest).

Zooming in on the selected vessel’s tracks: A suspicious event was identified, and the ship’s track abruptly turned on in the middle of the ocean.
(See figure 2)


Figure 2: Selected vessel’s tracks dashboard

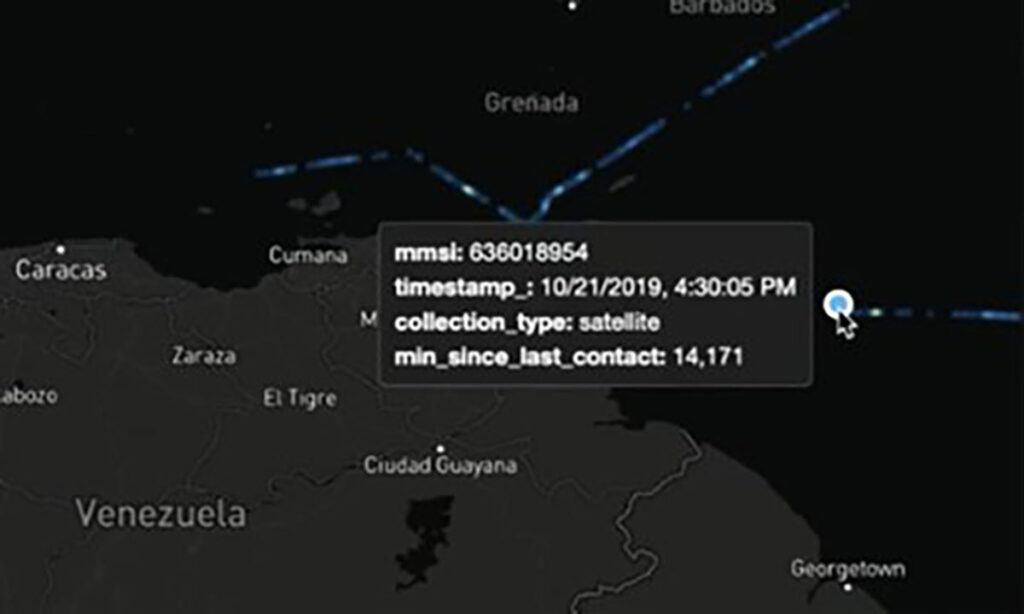
On the same day, the vessel entered Venezuelan waters, lost contact, and reappeared in a different location after a considerable gap (14,171 minutes later or around 10 days).


Figure 3: MMSI and time stamp

Cracking the code using Spire Maritime data and satellite imagery from URSA Space

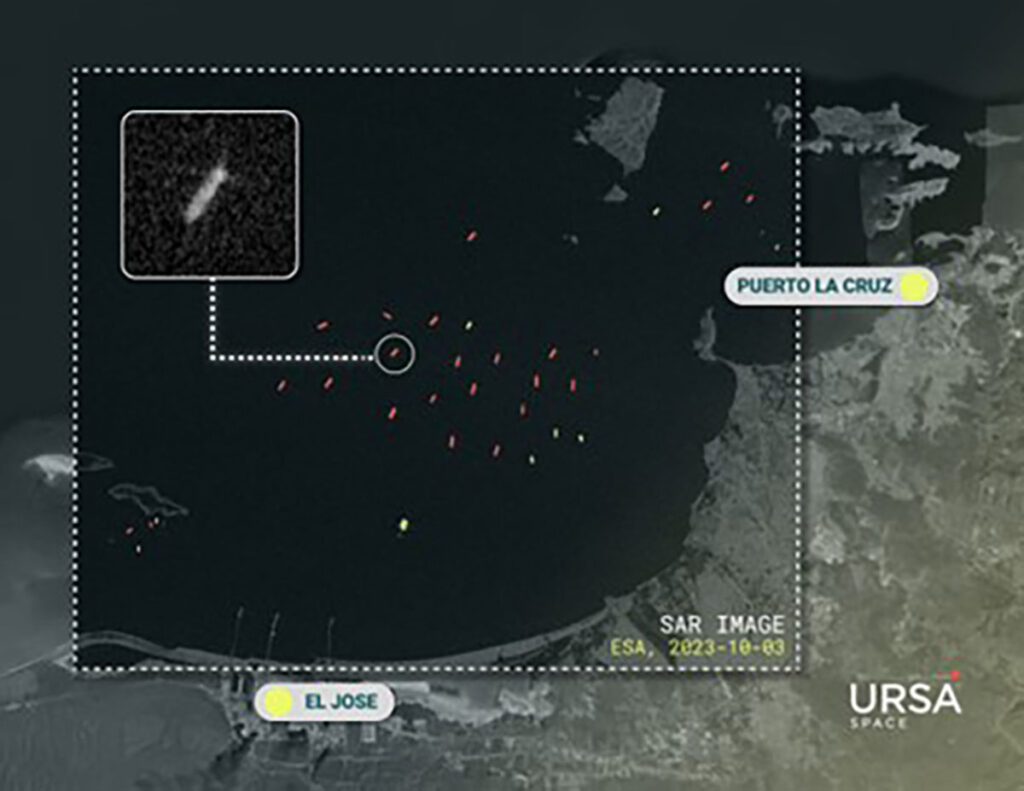
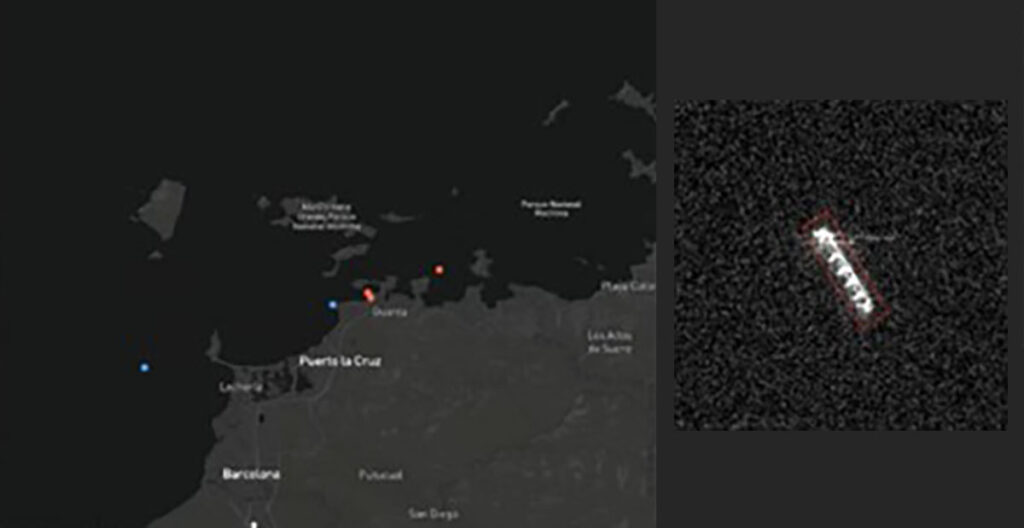
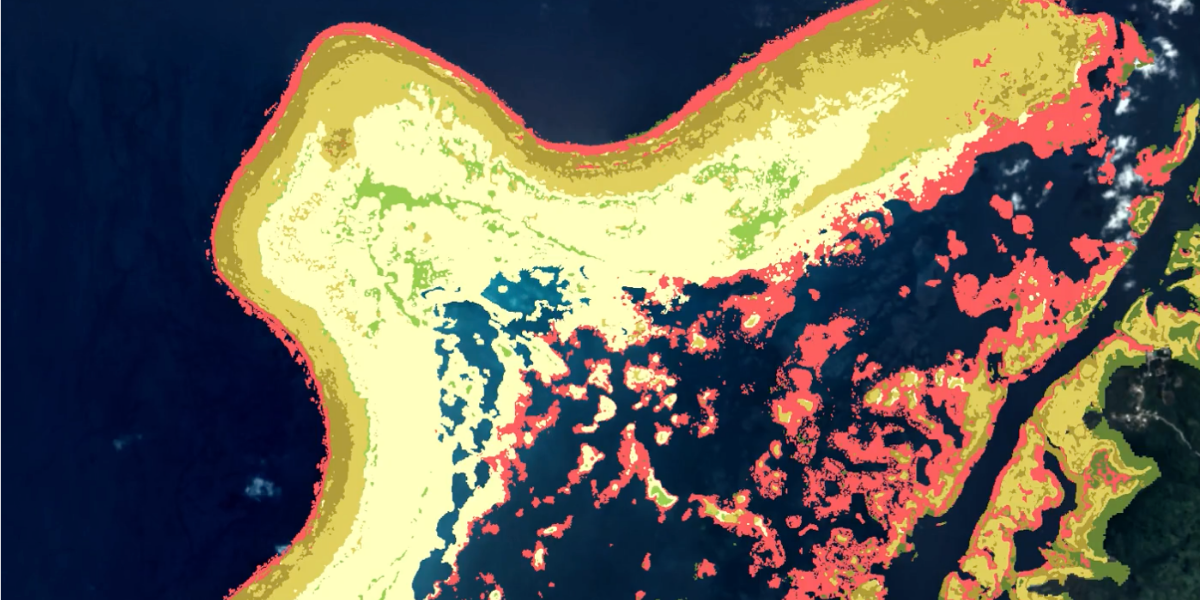
The image below shows vessels near the Venezuelan ports of El Jose and Puerto La Cruz identified using Spire Maritime AIS data.
Ursa Space’s satellite images confirm the presence of vessels, including those with turned-off AIS transponders.
There is a combination of ships with AIS turned on (green) and off (red).


Figure 4: El Jose & Puerto La Cruz Vessel detections – identified (green) and suspected dark vessels (red) – 2023


Figure 5: Puerto La Cruz Vessel detections – identified (blue) and suspected dark vessels (red) – 2019

Ship-to-ship oil transfers: A closer look at unidentified vessels

Once a tanker departs, then it’s a question of where it is headed, or more specifically where the cargo it’s carrying is going.
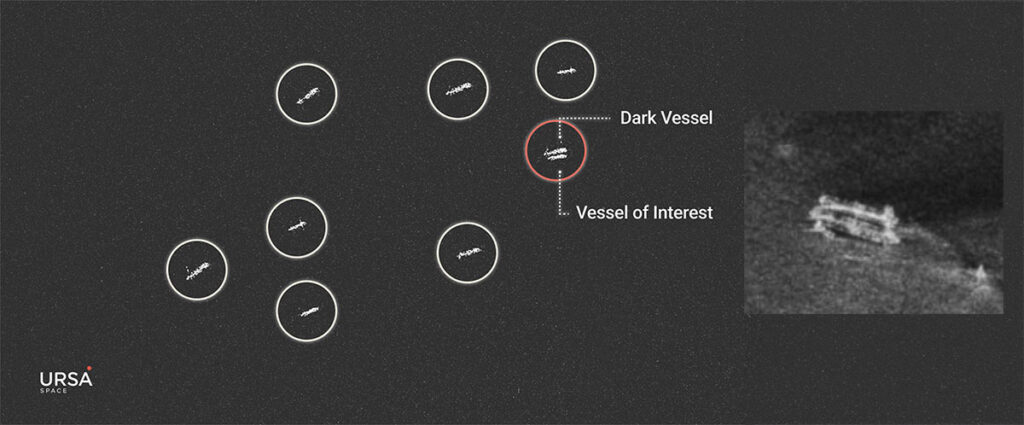
This isn’t always straight-forward because ships will sometimes transfer their cargoes to other ships at sea.

Moreover, this event – called a ship-to-ship transfer – may occur while one or both of the ships go dark.(see Figure 6)


Figure 6: Active ship-to-ship oil transfer

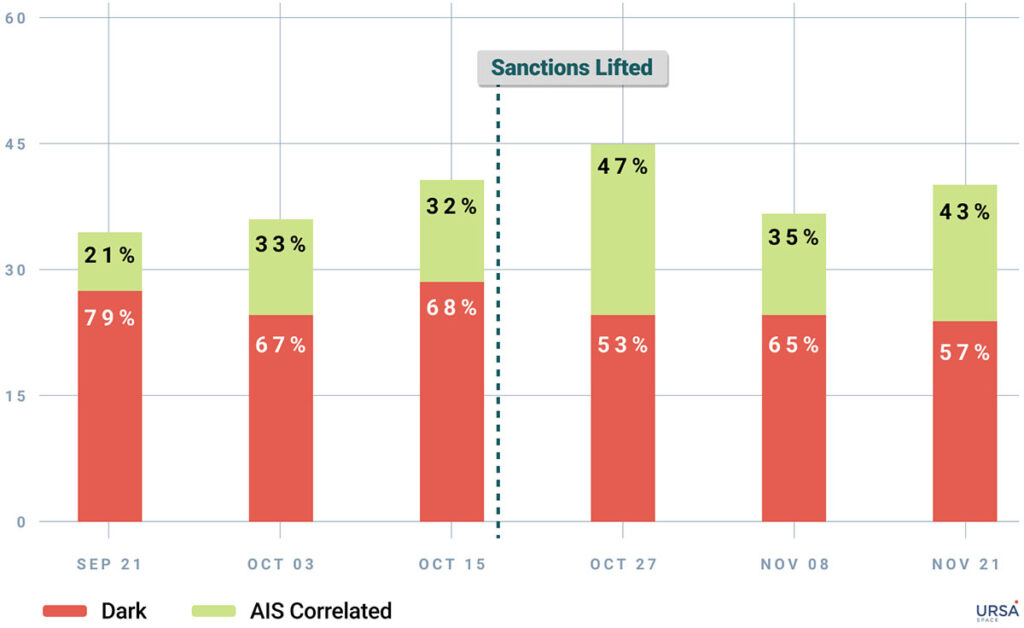
Impact on dark vessel detection changes since lifting US sanctions

When the US imposed sanctions in 2019, Venezuela responded by trying to conceal the identities and whereabouts of oil tankers in an effort to maintain exports.
These efforts continued until October 18, 2023, when the US eased sanctions on a conditional basis, and appear to have persisted afterwards.

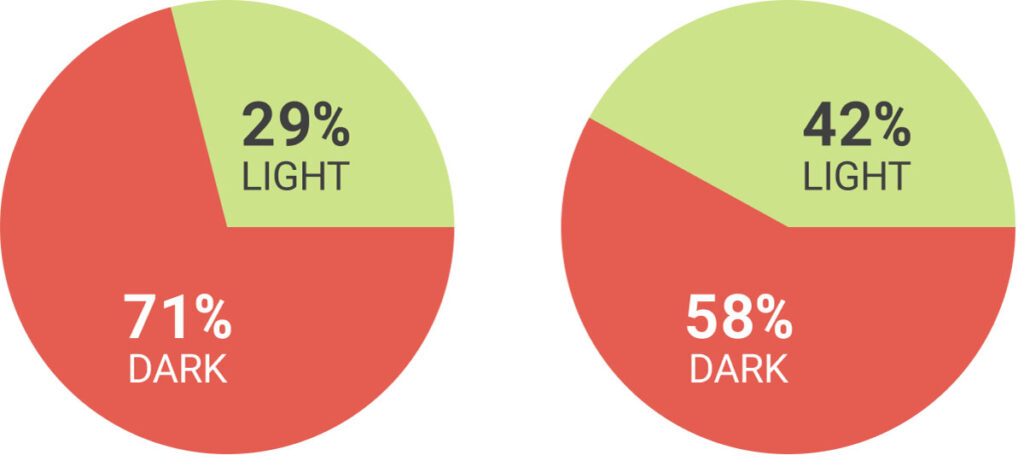
By examining AIS and SAR imagery, we found a decrease in the number of detected dark vessels in the weeks after sanctions were lifted, from 71% to 58%.
Meanwhile, the percentage of AIS-correlated ships increased from 32% to 47%.

Close monitoring will continue in April to observe the impact if sanctions are reimposed.

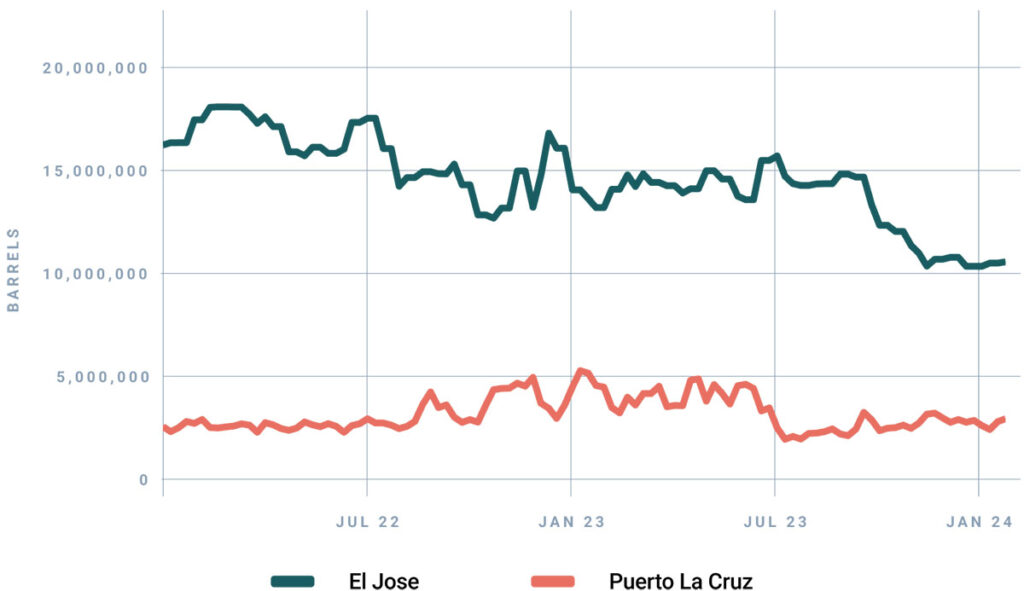
Vessel detections in El Jose & Puerto La Cruz:


Dark ships decrease post-sanctions eased:


Oil inventories also help understand import and export volumes out of Venezuela.2

In Venezuela, the country’s main oil export terminal is El Jose.
It is one of 11 Venezuelan storage locations Ursa Space monitors on a weekly basis.
In October 2023, when sanctions were lifted, Ursa’s data for El Jose, and nearby Puerto La Cruz, both saw sharp declines in inventory levels which is consistent with reports of more exports, perhaps in anticipation of sanctions being lifted.

Venezuela Oil inventories in El Jose and Puerto La Cruz:


In summary, by the fusion of AIS data and SAR imagery, it is possible to tip and queue, to focus your tracking, saving you time and money.

Links :

Wednesday, February 28, 2024

‘Spoon worms lick the seabed with a metre-long tongue’: a voyage into a vanishing Arctic world


Polarstern, a German icebreaker, on a ice thickness survey in the Arctic Ocean

From The Guardian by Tim Kalvelage (photos included)

Sea ice around the north pole is disappearing at an alarming rate.
A group of scientists are on a mission to investigate the effects of the climate crisis on the region


It is summer and the air temperature is just below freezing.
Fog has crept in, blurring the outline of Polarstern, the German icebreaker moored to a kilometre-long ice floe at 85 deg N latitude.
Next to a hole we have just drilled through 1.4 metres of ice, Morten Iversen, who studies the flow of carbon around the ocean, has attached several plastic containers to a rope secured by ice screws.
They will be left hanging in the water under the ice for a day to catch marine snow – clumps of dead algae and zooplankton faeces that sink from the upper ocean to the deep sea.

A few metres away, a team of biologists perforate the ice floe with a core drill.
They are looking for algae that grow at the bottom of sea ice, which play an important role in the Arctic Ocean food web.
Metre-long ice cores are pulled up, packed in plastic sleeves and stacked on a sledge to be processed in the ship’s laboratories.

Daniel Scholz, an engineer for the Alfred Wegener Institute, lowers an instrument that measures temperature, salinity and nitrate – an important nutrient for algae and phytoplankton – through an ice hole
 
Nets are lowred into the water to collect zooplankton
 
The ship’s helicopter carries a sensor to measure ice thickness
 
Frederik Bussmann, a marine chemist and PhD student at the Alfred Wegener Institute, measures the salinity at the edge of an ice floe.
 
Emiliano Cimoli, a researcher at the University of Tasmania, right, and an Alfred Wegener Institute technician Erika Allhusen, drill an ice core to look for sea-ice algae

One of the scientists is keeping watch, with a rifle slung over her shoulder and a flare gun on her belt.
This is, after all, a polar bear habitat – albeit a shrinking one.

Our group is part of a 100-strong expedition – half of them scientists, half ship’s crew – that set out from the Norwegian harbour of Tromsø in early August 2023 to investigate the rapid melting of the Arctic sea ice.
The team is investigating the consequences for the marine ecosystem: from nutrient cycling to ice algae and plankton productivity to seafloor animal communities that live on organic material raining down from the surface ocean.

An ice core drilled from sea ice in the central Arctic Ocean

The central Arctic is heating up much faster than most of the world.
The area covered by sea ice in the Arctic Ocean at the end of summer has shrunk by about 40%, or 2.5m square kilometres – roughly the size of the Mediterranean Sea – since satellite observations began in the late 1970s.
The remaining ice is getting thinner and multi-year floes – ice that has survived at least one summer – are becoming rarer.
The waters around the north pole could be virtually free of ice at the end of the summer as early as the 2030s, according to a recent study.

Shrinking ice cover means not only the loss of hunting grounds of polar bears or resting places and nurseries for seals, but also of an entire under-ice ecosystem: meadows of filamentous ice algae, algae-grazing zooplankton, and juvenile polar cod, which find food and shelter in the cracks and crevices beneath the floes and, when grown up, feed larger predators such as ringed seals or beluga whales.
In the short term, sea ice productivity could increase as more sunlight passes through thinner floes, boosting ice algae growth, but only as long as there is a sufficient supply of nutrients in the overall nutrient-poor central Arctic Ocean.

The same goes for planktonic algae, or phytoplankton, which profit from higher light availability and a longer growth season in the expanding open-water areas, as satellite data shows.
Changes in productivity and a shift from ice algae to phytoplankton at the base of the food web will probably have major effects on the marine ecosystem as whole.
Also, the native flora and fauna are facing new competition from invasive species, from plankton to fish, that are moving in from the Atlantic and Pacific as the oceans warm.
Predictions of the future Arctic Ocean are, however, highly uncertain due to a general lack of observation.
That is why the scientists have come here.
 
Tiny Arctic life :

A 3cm-long ice amphipod (Onisimus)

A 4cm pelagic sea slug, or sea angel (Clione limacina) found under the sea ice

A 1cm copepod (Paraeuchaeta) caught in aplankton net
 
A 2cm jellyfish (Botrynema brucei)
 
 
The chief scientist of the expedition, Antje Boetius, has been exploring the frigid waters of the Arctic for three decades.
In summer 2012 her team witnessed the lowest sea-ice minimum on record, in the Arctic Ocean’s Eurasian Basin.

“Now, we are following the same route to repeat previous measurements on the ice-ocean system all the way down to the seabed,” says the deep-sea ecologist, who is also director of the Alfred Wegener Institute for Polar and Marine Research in Bremerhaven, Germany.

The ice-covered Arctic Ocean, especially its deeper realms, is one of the least explored regions on Earth.
To catch a glimpse of larger creatures inhabiting the abyssal plains on the ocean floor and uncharted underwater mountains, the deep-sea ecologists have brought a camera system that is towed behind Polarstern.
 
Polar bears are an occupational hazard on the Arctic ice

The abundance and diversity of life in this cold, dark and food-scarce environment is truly astonishing: in places, large numbers of sea cucumbers and huge colonies of filter-feeding feather stars appear in the spotlights.
We marvel at basketball-sized sponges flickering across the scientists’ screens, at apricot-coloured anemones and star-shaped patterns extending around the burrows of spoon worms, which lick the seabed for food particles with a metre-long tongue.

Polarstern regularly moors alongside large floes and part of the science team heads out on to the sea ice, pulling sledges heavily loaded with drilling tools and other equipment.

The expedition leader, Antje Boetius, on Polarstern’s bridge

Flags on bamboo poles set up by a scouting party mark routes to different research sites.
Meanwhile, the ship’s helicopter passes over them, with a torpedo-shaped sensor suspended below it that measures the thickness of the sea ice.

The rhythm of life onboard is determined by how fast the ship gets through the ice, the schedule for the research expeditions, and, most reliably, meal times: breakfast at 7.30am, lunch at 11.30am, coffee at 3.30pm, dinner at 5.30pm.

The scientists work around the clock, and often use any time off to catch up on sleep after a long night in the lab or outside on deck in freezing temperatures.
Yet they still find time for social activities in the evenings, be it card games in the cosy red salon, water basketball in the ship’s swimming pool, or a pub quiz in the bar.

Towards the end of the expedition, when Polarstern is going south and the sun disappears below the horizon again after weeks of polar day, powerful spotlights are used to navigate through the ice

Although the sea ice coverage in the study area and in the Arctic Ocean overall is higher in 2023 than in previous years, the expedition makes good progress.
We encounter thicker – but quite old and rotten – ice that Polarstern easily breaks through, and large gaps of open water between the floes.

And so, on 7 September, almost effortlessly, the ship reaches the northernmost point of the planet: the geographic north pole.

For most onboard, it is the first time; for Polarstern it is the seventh time.
In 1991, with the Swedish ship Oden, it was the first conventional icebreaker to reach the latitude 90 deg N.

The Arctic Ocean has changed dramatically since that first arrival, says the captain, Stefan Schwarze.
“Three decades ago, we needed two icebreakers to fight our way through the pack ice,” he says.
“Today, we have reached the north pole with 30% of our engine power.”

Armed guards keep a lookout for polar bears while their colleagues work

Tuesday, February 27, 2024

From the sky to the sea: using satellites to map the world’s unidentified reefs


Coral reefs possess a quarter of all marine life and contribute to the well-being and livelihoods of a billion people worldwide.
Image credit: Chris Roelfsema.
 
From National Geographic by Elisabeth Marie

Detailed satellite mapping of the world’s reefs has revealed there is more coral reef area across the globe than previously thought – information that’s aiding conservation efforts of these environment
s.

Scientists have identified 348,000 square kilometres of shallow coral reefs up to 20 to 30 metres deep thanks to new technology.

“The total area of coral reef ecosystems is more extensive than previously thought,” said Dr Mitchell Lyons from the University of Queensland’s School of the Environment, working as part of the Allen Coral Atlas project.
“We can now confidently say there are almost 350,000 square kilometres of coral reef, which is about 50 to 100,000 kilometres more than previous estimations.”
 
Dive under the waves and explore our global habitat maps.
The maps classify reefs into benthic and geomorphic zones to support reef restoration and protection.
 
Identify reefs experiencing low, moderate, and severe bleaching with the Atlas monitoring system.
Know when and where to focus restoration efforts.
 
Monitor changes in water quality over time by identifying turbidity in your area.
Use it to identify sources of land-based pollution and prioritize action.

Dr Mitchell said researchers also found that about 80,000 square kilometres of reefs have a hard bottom, where coral tends to grow, as opposed to soft bottoms like sand, rubble or seagrass.
“This specialised data on area and composition will allow scientists, conservationists and policymakers to better understand and manage reef systems,” he said.
 
 
A map showing coral reefs around Australia.
Image credit: Allen Coral Atlas
 
Making the map

The map, known as the Allen Coral Atlas, was developed by the late Paul Allen’s Vulcan Inc. and is managed by Arizona State University and the University of Queensland along with partners Planet and Coral Reef Alliance.

Using fine-scale, high-resolution pictures from Planet Dove cubesat satellites and scientific-grade information from the Sentinel-2 satellite, scientists processed 100 trillion pixels to produce a global map of coral reefs.

The satellite images were then put through a machine-learning algorithm along with more than 1.5 million training samples curated from data collected by over 480 contributors identifying types of reefs, and the system then predicted any unmapped information to fill in data gaps.
 
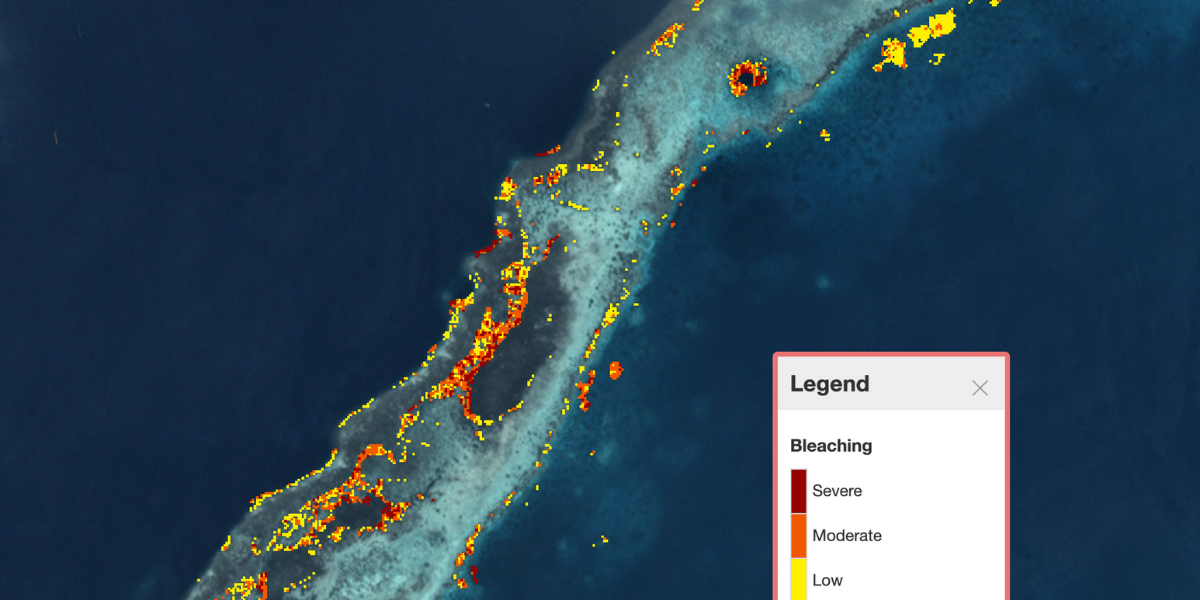
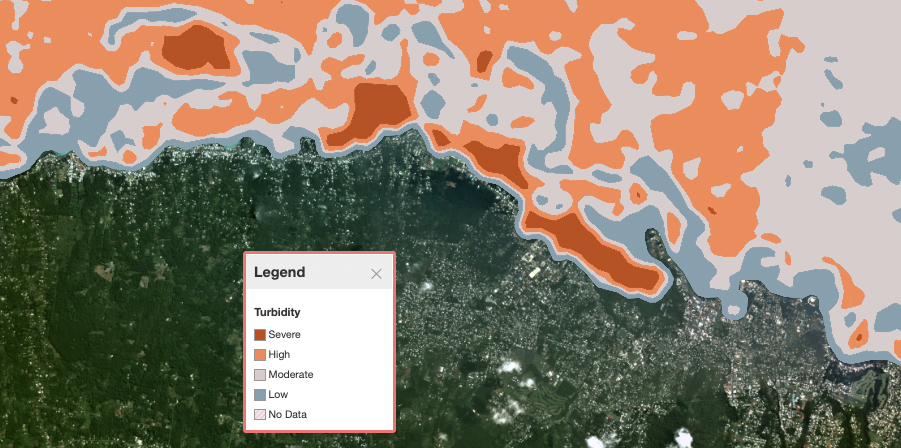
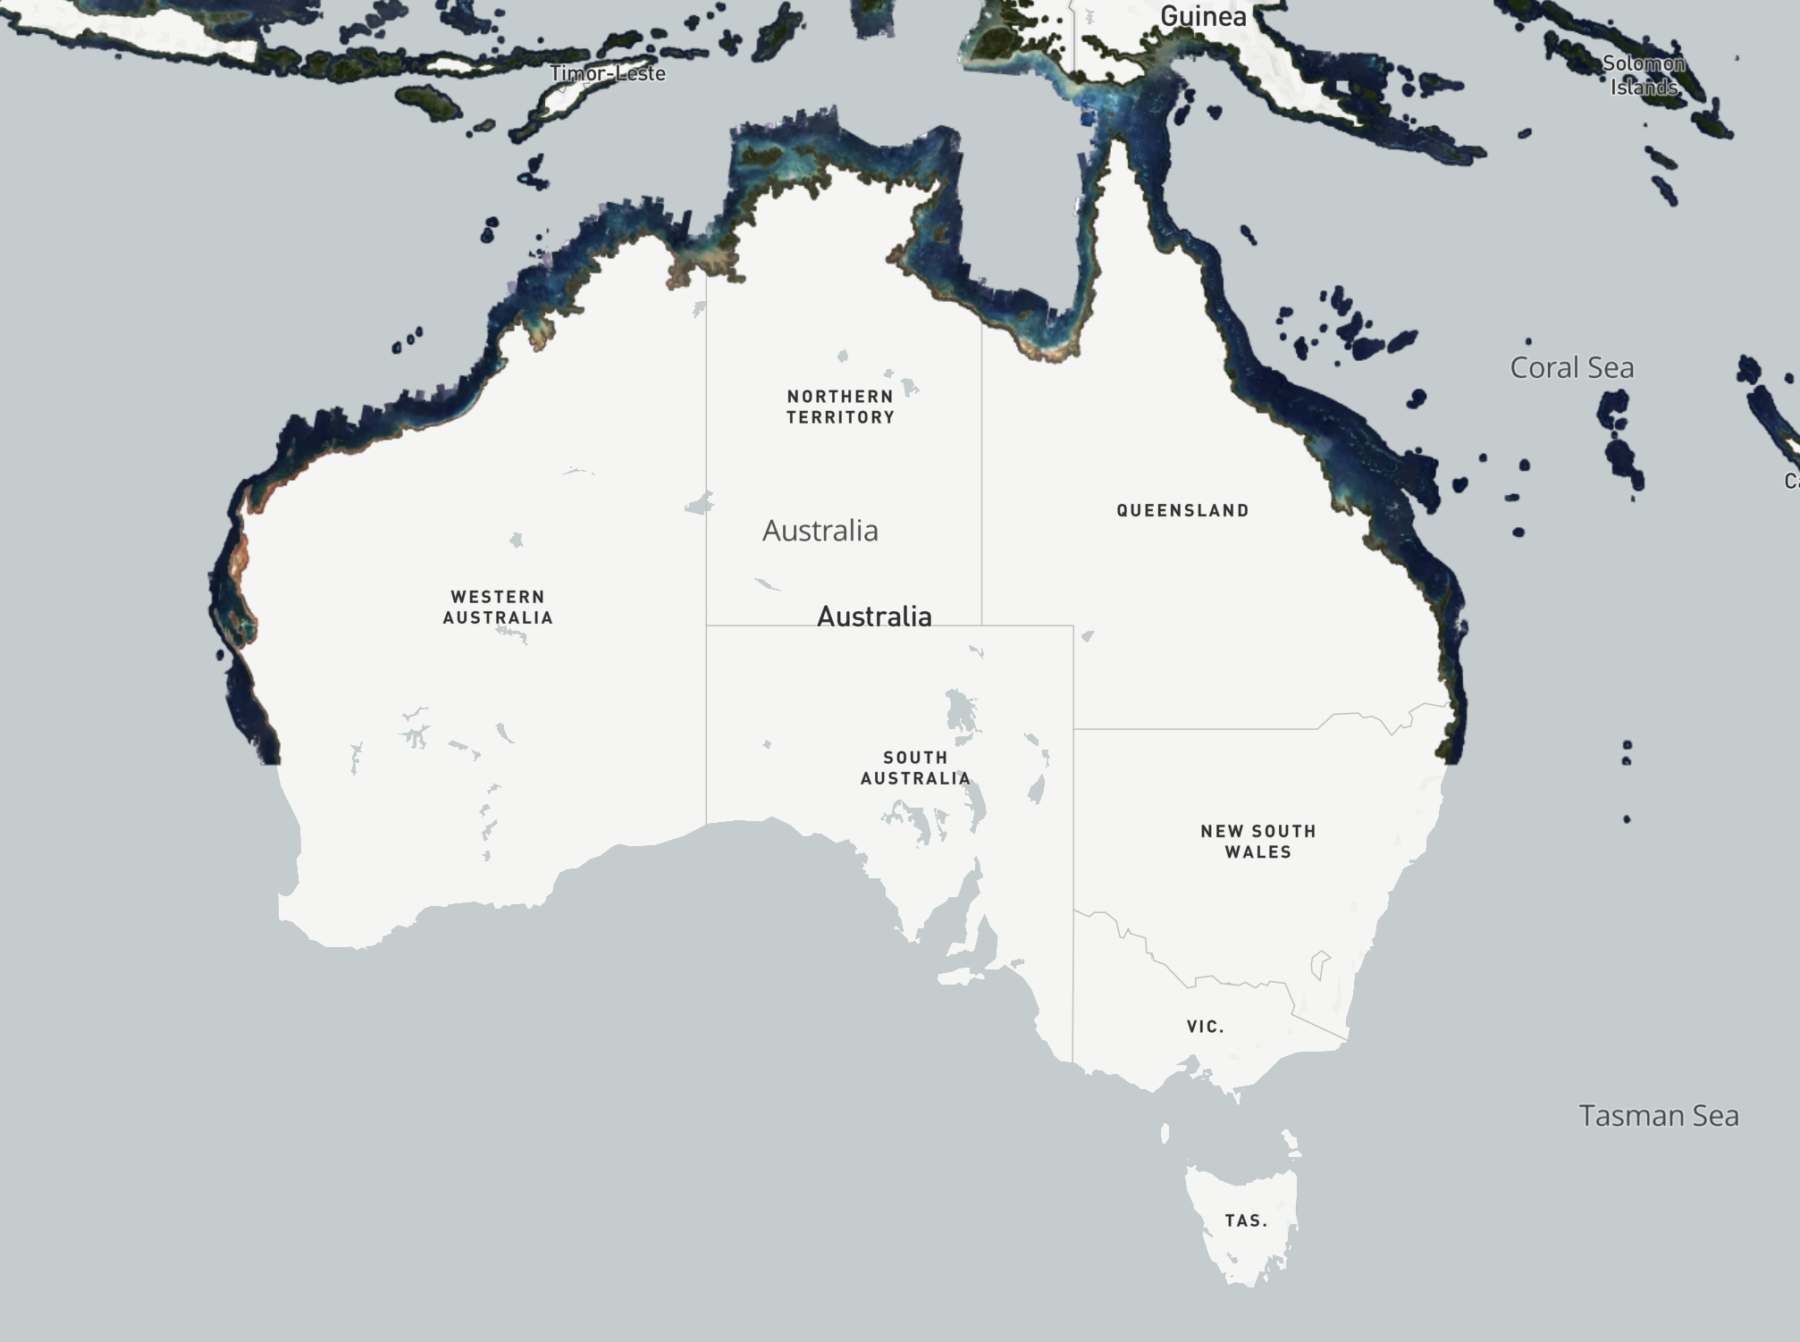
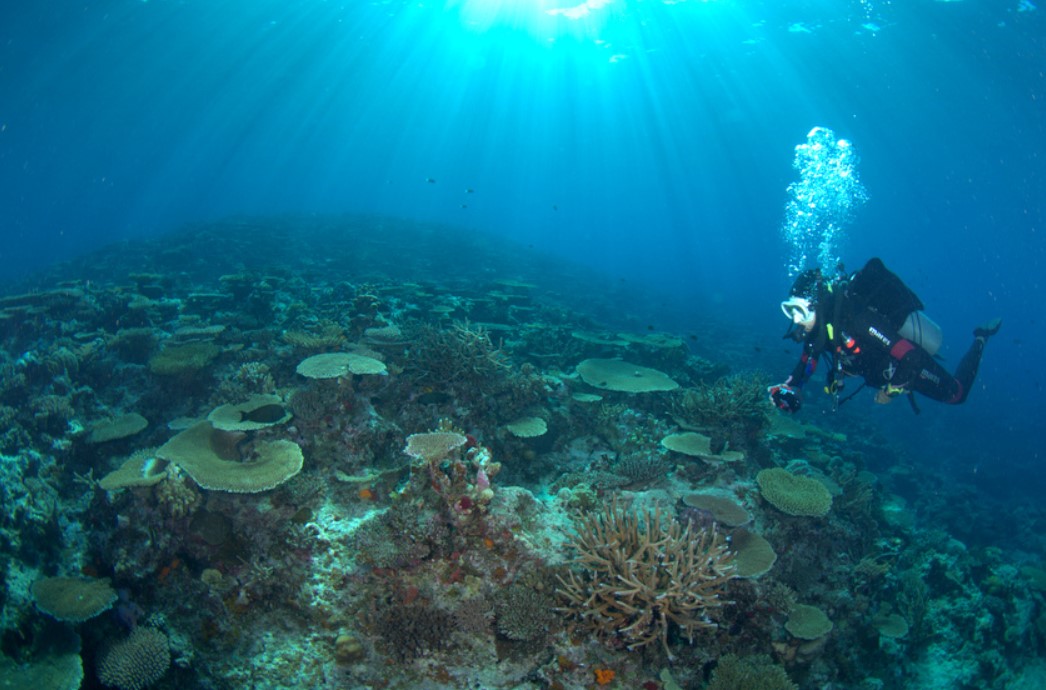
Thousands of people and organisations are using the Allen Coral Atlas to help direct conservation efforts.
Image credit: Chris Roelfsema.

Conserving coral

According to Dr Mitchell, although coral reefs account for only a small proportion of the ocean, they provide tremendous biodiversity that humans rely on for culture, commerce, scientific output and medicine.

“Coral reefs possess a quarter of all marine life and contribute to the wellbeing and livelihoods of a billion people worldwide,” Dr Mitchell said.
“Maps of ecosystems underpin many science and conservation activities, but until recently, there were no consistent high-resolution maps of the world’s coral reefs.
“Hundreds of thousands of people have already accessed the maps, and they are already being used directly around the world for marine spatial planning, marine protected areas, environmental accounting and assessments, restoration, and education.”

In 2022, more than 80,000 people accessed the Allen Coral Atlas, including conservation groups using the technology to advance their initiatives.
 
From geospatial data scientists to directors of conservation to fisherman, “we are all integrated in this effort”
In Indonesia, teams are using the Allen Coral Atlas to inform the country's reef management strategies.
 
 Groups include the Coral Reef Rescue Initiative, a global programme of scientists, NGOs and partners working in collaboration with governments and communities to safeguard reefs, food security and livelihoods against climate change; and the Philippine Reef and Rainforest Conservation Foundation, a non-profit organisation focused on environmental conservation on Danjugan Island.

The Coral Triangle Initiative, a multilateral partnership between Indonesia, Malaysia, Papua New Guinea, Philippines, Solomon Islands and Timor-Leste working to sustain marine and coastal resources by addressing food security, climate change and marine biodiversity, is also accessing the Allen Coral Atlas.

The information provided by the map will also have broader uses for Australian researchers and conservationists.
“We tend to be really interested in coral bleaching, so the map can help target locations where we know the reefs have hard substrate for coral to grow,” Dr Mitchell said.
“The Allen Coral Atlas also has a tool that allows pinpointing of areas affected by coral bleaching to help alert to the potentially growing issue.
“It’s more than just maps,” he said. “It’s a tool for positive change for coral reefs, and coastal and marine environments at large.”

Links :