Saturday, June 1, 2013

World's largest jellyfish


The world's largest jellyfish may look intimidating,
but it must be aware of it's surroundings or it will be eaten alive.

Friday, May 31, 2013

U.S. Chart No. 1: Symbols, Abbreviations and Terms used on nautical charts


From NOAA

 U.S. Chart No.1, Nautical Chart Symbols, Abbreviations and Terms, is an essential aid for new chart users and a useful reference for all mariners.

The new edition updates the descriptions and depictions of the basic nautical chart elements and symbols used on nautical charts produced by the National Oceanic and Atmospheric Administration (NOAA) and the National Geospatial-Intelligence Agency (NGA).


U.S. Chart No. 1: Symbols, Abbreviations and Terms used on Paper and Electronic Navigational Charts provides descriptions and depictions of three nautical chart symbology sets.

  • "INT1" symbols specified by the International Hydrographic Organization (IHO).

  • U.S. symbols used on nautical charts published by the National Oceanic and Atmospheric Administration (NOAA) and the National Geospatial-Intelligence Agency (NGA), when they differ from INT1 symbols.

  • ECDIS symbols used to display Electronic Navigational Chart (ENC) data on Electronic Chart Display and Information Systems (ECDIS) as specified by the IHO.
Edition 12, dated April 2013, supersedes all previous editions of U.S. Chart No. 1.
(It supersedes the December 8, 2011, 11th edition edition of U.S. Chart No. 1.)
 
Free copies of U.S. Chart No. 1 in PDF format are available below:

Download U.S. Chart No. 1
(132 MB)
Please be patient. This large file may take a few minutes to download.

South China Sea tension mounts near Filipino shipwreck

Second Thomas Shoal ‘could be the next flashpoint’ 
The shoal, alternately known as Ayungin (Filipino), Second Thomas (English), or Ren’ai Jiao (named 'Jen-ai Chiao' on the above NGA map) in Chinese, is located 105 nautical miles from the nearest island of the Philippines, Palawan (9°44 N / 115°52' E)
source : NGA chart #93046 Mantangule island to Eran Bay (1:250,000)
>>> geolocalization with the Marine GeoGarage <<<

From Reuters

A wrecked navy transport ship perched on a remote coral reef could be the next flashpoint in the South China Sea, where China and five other claimants bitterly dispute territory.

 Photo of Filipino wrecked warship (BRP Sierra Madre)
stuck in Ayungin Shoal serves as an outpost for the Philippine Navy
at 25 miles from Mischief Reef occupied by the Chinese.
-taken by a Chinese helicopter-

The Philippine government is accusing China of encroachment after three Chinese ships, including a naval frigate, converged just 5 nautical miles from an old transport ship that the Philippines deliberately ran aground on a reef in 1999 to mark its territory.

Philippine officials say they fear the Chinese ships will block supplies to about a dozen Filipino marines stationed in abject conditions on the rusting ship, raising tensions over one of Asia's biggest security issues.
The area, known as Second Thomas Shoal, is a strategic gateway to Reed Bank, believed to be rich in oil and natural gas.

Second Thomas shoal (center) with Mischief reef (NW of the island)
source : wikimapia

 Second Thomas Shoal is an atoll of Spratly Islands.
(retouched picture, cropped and cleared clouds) 

In 2010, Manila awarded an Anglo-Filipino consortium a license to explore for gas on Reed Bank but drilling stalled last year due to the presence of Chinese ships.


Manila says Reed Bank, about 80 nautical miles west of Palawan island at the southwestern end of the Philippine archipelago, is within the country's 200-nautical mile exclusive economic zone.
Beijing says it is part of the Spratlys, a group of 250 uninhabitable islets spread over 165,000 square miles, claimed entirely by China, Taiwan and Vietnam and in part by Malaysia, Brunei and the Philippines.
"China should pull out of the area because under international law, they do not have the right to be there," said Raul Hernandez, a spokesman for the Philippine Department of Foreign Affairs, noting the area's proximity to Palawan, the country's largest province.
He said the Chinese ships were a "provocation and illegal presence".
Chinese Foreign Ministry spokesman Hong Lei said on Tuesday the Second Thomas Shoal was part of the Spratly Islands, over which China had "indisputable sovereignty".
"It is beyond reproach for Chinese boats to carry out patrols in these waters," Hong said, adding China called on all parties to "refrain from taking actions that complicate the situation".


The tension illustrates how a decades-old territorial squabble over the South China Sea is entering a more contentious chapter as claimant nations spread deeper into disputed waters in search of energy supplies, while building up navies and alliances with other nations.
Second Thomas Shoal is one of several possible flashpoints in the South China Sea that could force the United States to intervene in defense of its Southeast Asian allies.
The tension comes just before U.S. Defense Secretary Chuck Hagel meets his Asia-Pacific counterparts at the so-called Shangri-La Dialogue in Singapore at the weekend.
The South China Sea is on the agenda of the regional security forum.

"Clear and present danger"

Philippine authorities say the three Chinese ships arrived in Second Thomas Shoal on or around May 8, escorting a fleet of 30 fishing boats.
Two days later, the Philippines formally lodged a protest with China over the vessels.
As of Tuesday, two Chinese marine surveillance ships remained in the area, Philippine navy spokesman Colonel Edgardo Arevalo said.
The fishing boats and the frigate had left, he said.
"The presence of those ships is a clear and present danger," said another senior Philippine navy officer, who declined to be identified as he is not authorized to speak to the media.
He said the Philippines believed China was trying to pressure it to leave the shoal.
"We don't want to wake up one day with fresh structures sitting near our navy ship there. We have to bite the bullet and strengthen our position there or risk losing the territory."
The wrecked U.S.-built ship, the BRP Sierra Madre, is among Asia's loneliest military outposts.
The ship was launched in World War Two, saw action in Okinawa and was used again in the Vietnam War.
It was transferred to the Philippine government in 1976 under a military assistance program.
Soldiers are equipped with a small generator for cooking.
Radios are battery-powered and supplies are delivered by boat.
"They want us out of the area," another Philippine navy officer said of China.

 The island of Kalayaan, which means “Freedom” in Filipino,
that was created in 1978 mainly to assert the Philippines’ claim to the disputed territory
in the Spratlys, a chain of islets in the South China Sea.
(AFP/Kayalaan Municipal Office)
>>> geolocalization with the Marine GeoGarage <<<

 Island of Kalayaan named Zhongye Dao or Thitu island
on NGA chart 93044 -Yongshu Jiao to Yongdeng Ansha (South China)-

The Association of South East Asian Nations (ASEAN), a 10-nation grouping that includes the Philippines, has been talking to China about a binding code of conduct to ease tension.
But China says it will negotiate "when the time is ripe".
ASEAN foreign ministers are due to meet in Thailand in August to forge a position on the code of conduct before meeting Chinese officials in late August or early September in Beijing.

 A newly-constructed radar dome on Chinese-controlled Subi Reef,
in the disputed Spratly islands region.
China says it has sovereign rights over nearly all of the South China Sea,
even waters far away from its main landmass
and approaching the coasts of Southeast Asian countries.
(AFP)
>>> geolocalization with the Marine GeoGarage <<<

 on NGA chart #93061

China’s lighthouse located southwest of Subi Reef seen by the Philippine Navy
Under international law, a lighthouse is a recognized base point from where a state can measure its maritime regimes,
including territorial sea (12 nautical miles from the baseline), contiguous zone (24 nm), economic exclusive zone (200 nm), continental shelf (200 nm) and extended continental shelf (350nm). 
>>> geolocalization with the Marine GeoGarage <<<

The easternmost territory held by China is Mischief Reef, about 65 km (40 miles) northwest of Second Thomas Shoal.
China occupied it in 1995.

 An aerial view of BRP Sierra Madre (LT-57), a 100-metre ship
(Philippine Government)

The Philippines occupied Second Thomas Reef with the BRP Sierra Madre in 1999, preventing China moving further east.
In March, Malaysia protested against the incursion of four Chinese ships in James Shoal, about 80 km (50 miles) off Sarawak on Borneo island.
Chinese sailors fired guns in the air during the visit to the shoal.
Last month, a Chinese maritime surveillance ship returned to James Shoal to leave behind steel markers to assert its claim.

Risk of miscalculation

Zha Daojiong, an international relations professor at Beijing's Peking University, said China was serious about asserting its claims in the South China Sea and it was important the region did not misunderstand this.
"There is now a quiet agreement among different Chinese voices that sometimes you have to act as well as issuing statements," he said.
China would, however, never completely close the door on possible co-operation.
Ian Storey, a scholar at Singapore's Institute of South East Asian Studies, said tension at Second Thomas Shoal could prove more dangerous than last year's stand-off at unoccupied Scarborough Shoal, given the presence of Filipino troops.
"It is hard to imagine China using force to gain full control over Second Thomas, but some kind of blockade to drive out the Philippines' troops would have to be a possibility," Storey said.
"There is a real chance of escalation or miscalculation."

Links :

Thursday, May 30, 2013

NOAA issues new nautical chart for Bering Strait

 16190 Bering Strait North (zoom on Diomede Islands)
>>> geolocalization with the Marine GeoGarage <<<

From NOAA

Chart improves navigational safety for maritime gateway to the Arctic.

NOAA Office of Coast Survey has released a new nautical chart for the Arctic, which will help mariners navigate the Bering Strait.
Chart 16190 (Bering Strait North) incorporates precise depth measurements acquired recently by NOAA Ship Fairweather hydrographic surveys.

 Chart 16190 (Bering Strait North)

Coast Survey is also releasing a new edition of Chart 16220 (St Lawrence Island to Bering Strait).

"Our Arctic Nautical Charting Plan identified the need for 14 new charts in the Arctic," explains Commander Shep Smith, chief of Coast Survey's Marine Chart Division.
"Chart 16190 was high on our list of priorities, since the Bering Strait is the maritime gateway from the Bering Sea in the Pacific Ocean to Chukchi Sea in the Arctic Ocean."

"Charting the gateway is absolutely vital for safe navigation, but it is more than that," Smith says.
"In addition to the very practical aspects, this chart also symbolizes an opening to the growing opportunities for maritime transportation in the Arctic."

Charts 16190 and 16220 include recent hydrographic information in U.S. waters between Cape Prince of Wales and the immediate waters surrounding Little Diomede Island.
They also include recent NOAA shoreline surveys of the Diomede Islands and Cape Prince of Wales.
  • Chart 16190 provides 1:100,000 scale coverage, including a 1:40,000 scale inset of Little Diomede Island.
  • Chart 16220 provides 1:315,350 scale coverage.
Prior to these charts, the best available information was from Chart 16005, at a scale of 1:700,000.
At that scale, every charted depth was separated by about two nautical miles and the chart depicted only a handful of depths.
Most of the old charted depths were from 1950 and provided incomplete information about the depths or possible hazards on the sea floor.

Chart 16190 is the second new chart resulting from the Arctic Nautical Charting Plan.
Coast Survey created the first of the new Arctic charts, Chart 16161 (Kotzebue and Approaches), in April 2012. (See New Alaska navigational chart makes increased Arctic shipping safer.)
Chart 16220 had previously been maintained by the National Geospatial-Intelligence Agency, but Coast Survey assumed responsibility for it in 2010.

The equivalent NOAA electronic navigational charts (NOAA ENC®) for 16190 will be available this summer.
Watch for US4AK8D (Bering Strait North), and US5AK8D (Little Diomede Island).
The 16220 ENC equivalent -- US3AK89M -- was created in 2012 and included the new Fairweather hydro.

US NOAA update in the Marine GeoGarage


52 charts have been updated in the Marine GeoGarage (with 1 new chart 16190)
(NOAA update March/April/mi-May 2013)
 

  • 11347 Calcasieu River and Lake
  • 11361 Mississippi River Delta;Southwest Pass;South Pass;Head of Passes
  • 11402Intracoastal Waterway Apalachicola Bay to Lake Wimico
  • 11411Intracoastal Waterway Tampa Bay to Port Richey
  • 11415Tampa Bay Entrance; Manatee River Extension
  • 11416Tampa Bay;Safety Harbor;St. Petersburg;Tampa
  • 11425Intracoastal Waterway Charlotte Harbor to Tampa Bay
  • 11545 Beaufort Inlet and Part of Core Sound;Lookout Bight
  • 12211 Fenwick Island to Chincoteague Inlet;Ocean City Inlet
  • 12245Hampton Roads
  • 12272Chester River; Kent Island Narrows. Rock Hall Harbor and Swan Creek
  • 12338 Chesapeake Bay Mobjack Bay and York River Entrance
  • 12342 Harlem River
  • 13203 Georges Bank Western part
  • 13237 Nantucket Sound and Approaches
  • 13295 Kennebec and Sheepscot River Entrances
  • 13312Frenchman and Blue Hill Bays and Approaches
  • 16190 Bering Strait North;Little Diomede Island
  • 16220 Bering Sea, St. Lawrence Island to Bering Strait
  • 18421 Strait of Juan de Fuca to Strait of Georgia; Drayton Harbor
  • 18427 Anacortes to Skagit Bay
  • 18640San Francisco to Point Arena
  • 18645Gulf of the Farallones;Southeast Farallon
  • 18680Point Sur to San Francisco
  • 1116A Mississippi River to Galveston (Oil and Gas Leasing Areas)
  • 11330 Mermentau River to Freeport
  • 11340 Mississippi River to Galveston
  • 11348 Intracoastal Waterway Forked Island to Ellender. including the Mermantau River. Grand Lake and White Lake
  • 11378 Intracoastal Waterway Santa Rosa Sound to Dauphin Island
  • 11481 Approaches to Port Canaveral
  • 11503 St. Marys Entrance Cumberland Sound and Kings Bay
  • 11537 Cape Fear River Cape Fear to Wilmington
  • 12222 Chesapeake Bay Cape Charles to Norfolk Harbor
  • 12230 Chesapeake Bay Smith Point to Cove Point
  • 13224 Providence River and Head of Narragansett Bay
  • 13283 Portsmouth Harbor Cape Neddick Harbor to Isles of Shoals; Portsmouth Harbor
  • 16304 Kuskokwim Bay to Bethel
  • 11341 Calcasieu Pass to Sabine Pass
  • 11376 Mobile Bay Mobile Ship Channel-Northern End
  • 11439 Sand Key to Rebecca Shoal
  • 12285 FOLIO SMALL-CRAFT CHART Potomac River-; District of Columbia
  • 12339 East River Tallman Island to Queensboro Bridge
  • 12343 Hudson River New York to Wappinger Creek
  • 13324 Intracoastal Waterway Sandy Hook to Little Egg Harbor
  • 14832 Niagara Falls to Buffalo
  • 17331 Charham Strait Ports Alexander. Conclusion. and Armstrong
  • 17333 Ports Herbert. Walter. Lucy and Armstrong
  • 17335 Patterson Bay and Deep Cove
  • 17360 Etolin Island to Midway Islands. including Sumner Strait;Holkham Bay;Big Castle Island
  • 18453 Tacoma Harbor
  • 18703 Estero Bay;Morro Bay
  • 19357 Island of O'ahu;Barbers Point Harbor
Today 1024 NOAA raster charts (2166 including sub-charts) are included in the Marine GeoGarage viewer.

Note : NOAA updates their nautical charts with corrections published in:
  • U.S. Coast Guard Local Notices to Mariners (LNMs),
  • National Geospatial-Intelligence Agency Notices to Mariners (NMs), and
  • Canadian Coast Guard Notices to Mariners (CNMs)
While information provided by this Web site is intended to provide updated nautical charts, it must not be used as a substitute for the United States Coast Guard, National Geospatial-Intelligence Agency, or Canadian Coast Guard Notice to Mariner publications

Please visit the
NOAA's chart update service for more info.

Map room: Borders on top of the world


At 100 square miles, Petermann Ice Island was the largest piece of free-floating ice ever filmed
(and the second largest in recorded history).

From World Policy Institute (by Mark Terry and Adam Scholl)

Yes, the melting polar ice caps are opening up new transportation routes and revealing untapped mineral wealth that will benefit us all.
Uh, hold on, say Mark Terry and Adam Scholl.
They remind us that increased accessibility could well lead to overlapping and dangerous territorial claims.

A century ago, traversing the Northwest Passage was a grueling effort that often took years.
Explorers frequently perished as their boats sunk or got trapped in the abundant pack ice.
Today, these waters are mostly ice-free during the summer, and ships can sail through with ease.
The Arctic is warming twice as fast as the rest of the planet, while much of the Antarctic is warming three times as fast.
As a result, the amount of Arctic sea ice has shrunk dramatically, and last year’s extent was the lowest ever recorded.
In the last 30 years, the annual minimum size of the polar ice cap has shrunk by more than half, receding by 1.5 million square miles, an area approaching the size of India, France, and Italy combined.


Global Warming effects on the Arctic Ocean
The surface waters of a major portion of the Arctic Ocean are becoming saturated with carbon dioxide sooner than many scientists expected, all but halting the watery region's ability to sop up more of the greenhouse gas from Earth's atmosphere, new research finds.

This melting is occurring more rapidly than predicted and continues to accelerate.
Strikingly, between 2011 and 2012, the ice cap shrunk by 386,102 square miles, an area larger than Texas and Arizona combined, and according to Cambridge University professor Peter Wadhams, the entire Arctic ice cap could melt as soon as the summer of 2015.


Paring 3 years to 3 weeks

In October 2010, I was the first filmmaker to cross the Northwest Passage via the seldom-navigated Prince of Wales Strait.
I sailed aboard the Canadian Coast Guard icebreaker Amundsen, named after Roald Amundsen, the famous Norwegian explorer who was the first man to navigate the passage successfully.
In 1903, his trip took three years. Since most of the water was completely ice-free, my trip took just three weeks.
Shockingly, it wasn’t until we reached the southern entrance of the Prince of Wales Strait, which historically has almost always been frozen solid, that we even began to see sea ice.
One obvious result of glacial melt is the rise in sea levels.
On one expedition, I captured the only footage of Petermann Ice Island, the second largest piece of free-floating ice in recorded history (and the largest piece ever filmed).
Carved from a massive glacier in Greenland, this chunk of ice—which, at 100 square miles, was five times the size of Manhattan—floated by, destined to dissolve in the sea.
The melting process triggers a vicious feedback loop at the poles, since open water absorbs more of the sun’s heat than ice.
As McGill University professor Bruno Tremblay explains, “You warm the surface ocean; you melt more ice; you melt more ice, you have more open water; more open water, more sunshine being absorbed; and you can actually lose a lot of ice very quickly.”
Ice melt may also release even more greenhouse gas into the atmosphere.
The Arctic Ocean contains more methane than the rest of the world’s oceans combined, and this gas is released as ice vanishes. Evidence of this phenomenon has already been observed.
Though scientists were mystified at first, they determined that a series of strange formations appearing on the floor of Hudson Bay—some 650 feet in diameter and 100 feet tall—are the result of enormous methane bubbles rising through the seabed. Considering that each pound of methane warms the climate 22 times more than a pound of carbon dioxide, these bubbles could amplify the greenhouse gas effect.
As the Northwest Passage becomes increasingly ice-free, it could replace the Panama Canal as the chief maritime conduit between Europe and Asia, between eastern North America and Asia, and between western North America and Europe, shortening each of these voyages by thousands of miles. Similarly, it could replace interstate highways and transcontinental railways as the primary shipping route between the North American coasts.
As more shippers use this shortcut, trade will become cheaper and faster.

Below the Seabed

Though the Northwest Passage has enormous economic value as a commercial route, the resources in the seabed below could prove even more lucrative.
According to a United States Geological Survey report, a quarter of the oil left on earth is in the Arctic, and of that, more than half lies beneath the waters of the Northwest Passage.
This section of sea floor, which until recently was inaccessible beneath the ice, contains abundant natural gas along with unconventional energy resources like shale gas, tar sands, and methane hydrates.

It is a trifle ironic that humans have gained access to these vast new oil reserves, at least in part, by burning so much oil from elsewhere that the polar ice caps started melting.
Now, all governments with Arctic borders are scrambling to claim a piece of this valuable hydrocarbon pie and are readjusting their frontiers.

According to international law, all states own any resources found within 200 nautical miles of their coast (unless another state is closer).
Most Arctic resources fall within these boundaries, so are uncontested, but even the resources outside these boundaries are worth potentially huge sums of money.
Six countries—the United States, Canada, Russia, Norway, Denmark, and Iceland—have made territorial claims to areas far from their coasts.
Some of these claims overlap.
To win Arctic sovereignty disputes, states must provide proof to the UN Commission on the Limits of the Continental Shelf that their continental shelf, and no one else’s, extends into the disputed area. Some governments have sent submarines deep underwater to prove these assertions.
Vladimir Putin had one crew use their submarine’s robotic claw to plant a Russian flag in the seafloor at the North Pole, prompting outrage from Canadian officials.
The UN commission is expected to resolve most of these disputes within a few years, though at least one may linger.
Since the Senate has not ratified the UN Convention on the Law of the Sea, the United States has no standing to prove some of its claims to Arctic territory and could lose them altogether.

 Map of the Arctic

We map the cap

On the following two pages, World Policy Journal maps the melting Arctic ice cap alongside the shipping lanes, oil basins, and land claims that are springing up in its wake.
This new northern frontier will have a transformative impact on politics, industry, and the environment, and governments and companies across the globe are racing to take advantage of its opportunities.
Perhaps it will be a boon for tourism, too.
After all, it may only be a few more years before you can go swimming at the North Pole—no visa required.

Links :

Wednesday, May 29, 2013

Image of the week : Plankton bloom, Black Sea

acquired May 9, 2013
(Note that north is to the upper left in this image.)
>>> geolocalization with the Marine GeoGarage <<<

From NASA

The Black Sea, a large inland water body that connects eastern Europe and Asia Minor, frequently hosts widespread blooms of phytoplankton during the spring and summer seasons.
This astronaut photograph, taken from the International Space Station, highlights a recent bloom in the Black Sea’s eastern half.

The phytoplankton are visible as blue to turquoise streams and swirls, carried by currents along the coastline and further out towards the middle of the sea.

 Russian nautical map

The urban areas of Anapa and Novorossiysk—the largest Russian seaport on the Black Sea—are visible along the northern shoreline as grey-white regions nestled between the sea and uplands dotted with limestone quarries.

Phytoplankton occupy the base of most aquatic food chains and therefore serve as the primary producers in these ecosystems, despite being microscopic in size.
The term “phytoplankton” includes a number of organisms—cyanobacteria, diatoms, dinoflagellates, algae, and coccolithophores—that feed larger creatures such as fish and shrimp.

The Black Sea receives contributions of freshwater from several river systems, including the Danube, Dnieper, Dniester, and Don, but it is also connected to the saline Mediterranean and Marmara Seas.
These same river systems transport nutrient-filled urban and agricultural runoff to the Black Sea; the nutrients are consumed by phytoplankton and lead to blooms.

Tuesday, May 28, 2013

Opinion: How the Prime Meridian changed the world

The Prime Meridian line.
Photograph by Danita Delimont, Alamy

From National Geographic

Some 250 years ago, a British astronomer published the first of a series of guidebooks that would ultimately establish Greenwich, England, as the world's zero-degree longitude location, the "prime meridian."

Nevil Maskelyne's 1763 The British Mariner's Guide—and his follow-up The Nautical Almanac and Astronomical Ephemeris, published annually beginning in 1766—would set the standard for nautical navigation for decades to come.

And though the world has largely forgotten the Guide and Almanac, modern technology has not.
Any device that uses maps and geolocation—from smartphones to global positioning system (GPS) devices to GPS-enabled trucks, airplanes, and ships—still hails the prime meridian flag that Maskelyne planted at his observatory, the Royal Observatory in Greenwich, two-and-a-half centuries ago.

That's because defining zero degrees longitude—which effectively divides the world into East and West—is the first step toward finding every other point of longitude on the map, and finding your way in general.
And that was once a very big deal.

A Longitude Problem

Indeed, before the Guide and Almanac, the world had a deadly longitude problem.
Navigation at sea was extremely difficult, resulting in countless disasters and disappearances over the centuries because ships' captains simply could not figure out where they were.

For instance, on Oct. 22, 1707, more than 1,400 British sailors died because a storm caused the fleet's navigators to lose their location; then the navigators and naval officers mistook the craggy archipelago on which the fleet wrecked for the western entrance to the English Channel.

Pre-Meridian sailing was difficult, as depicted in this illustration of the Vitus Bering expedition wrecked upon the Aleutian Isles in 1741.
Illustration from North Wind Picture Archive/Alamy 
 

But by the spring of 1763, after decades of hardscrabble observations and calculations, astronomers had finally cracked the code to predict the moon's meandering path across the sky.
No mere academic exercise, this breakthrough would enable mariners around the world to locate their longitude at sea—turning the moon into the world's first global positioning satellite.

Though he was not the first scientist who attempted to resolve the longitude issue, Maskelyne was the first to put forward a practical solution, one that wound up being so good it effectively enshrined Greenwich as the prime meridian for the entire world, says Rebekah Higgitt, curator of history of science and technology at the Royal Observatory in Greenwich.
Thus he was, she says, "very central to creating Greenwich as it has come to be known.


The discovery of a way to measure longitude revolutionised long-distance sea travel forever, but the institution which made it happen has all but disappeared from memory.
Now researchers led by Professor Simon Schaffer are launching a new project to remember the Board of Longitude and tell its remarkable story in full for the first time.

An Arbitrary Matter

Unlike latitude, which represents angular distance from the equator, longitude on a spinning earth is based on a zero-degree prime meridian that's simply a matter of arbitrary convention.
By the 1760s, many seagoing nations had established their own zero-degree longitude point.
The Royal Observatory in Paris, for example, was France's prime meridian, while the tip of the most southwestern of the Canary Islands was Spain's prime meridian.

Naturally, Great Britain produced maps and charts based on its prime meridian in Greenwich.
But what transformed the country's standard into the worldwide standard was the precision, practicality, and utility of Britain's longitude solution.

For more than two centuries before Maskelyne, scholars across Europe had been talking about using the moon to find longitude at sea.
But two vast problems stood in the way.

The first involved measurement.
No simple, portable device existed to precisely gauge the angular separation between the moon and the sun or a known reference star—the raw numbers navigators needed to derive longitude. But between 1730 and 1760, various technologists across Europe devised ever-better quadrants, octants, and sextants that solved the measurement problem.

Mapping the Moon's Position

The second and larger issue was prediction: In order for a sailor or anyone else to know his longitude, one must compare local time (via a sundial, for instance) with the exact local time at the prime meridian, using some sort of universal clock.

And the best universal timepiece, scientists throughout the 17th and 18th centuries recognized, is the moon, which slowly moves through the sky over a 28-day cycle.
So its position compared with the location of the sun or the stars could serve as the celestial clock's hand.

 Finding Greenwich time while at sea using a lunar distance.
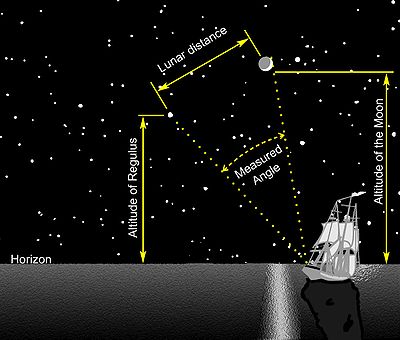
The Lunar Distance is the angle between the Moon and a star (or the Sun).
The altitudes of the two bodies are used to make corrections and determine the time.

Unfortunately, the moon's precise motion through the sky is anything but regular.
Tugged as it is variously by the earth and sun and following an oblong orbit that never is quite the same, the moon's exact path was extraordinarily difficult to forecast in advance.

That is, until the 1750s, when German mapmaker Tobias Mayer finally mastered the pages of complex equations that would enable astronomers to precisely forecast the moon's position a year or more ahead of time.
This discovery would finally provide navigators with the lunar almanacs they needed.

In the spring of 1763, Maskelyne published the first lunar charts based on Mayer's work in his British Mariner's Guide, allowing navigators to measure the moon's position in the sky and to derive Greenwich time at that very instant.
Ships' captains and navigators could better do their jobs, kicking off a decade of revolutionary innovation that solved one of the greatest technological problems of the 18th century—navigation at sea.
"This method carried into practice," Maskelyne wrote in the Mariner's Guide, "will ... bring the longitude to great nearness."

Still, the British Mariner's Guide left a lot of legwork to be done.
Navigators using the Guide could spend up to four hours calculating their location.
Maskelyne's solution was feasible, in other words, but it was still not practical.

 Lunars in the Nautical Almanac (Reed Navigation)
Online tool : A complete online Nautical Almanac covering the period 1750 to 2050.
The positions of the Sun, Moon, navigational planets and stars are generated for every hour of the day at a high level of accuracy just as in the published almanacs;
it permits customization of display options so that data are generated that are relevant for your location and interests.

A Navigational Breakthrough

However, with Maskelyne's subsequent innovation, the Nautical Almanac, it took just 30 minutes to crank out lunar longitudes.
The Almanac anticipated every possible calculation that could be done in advance and simply listed the answers in a reference table, so mariners at sea did not have to run the numbers themselves.

To do this, Maskelyne employed a cottage industry of human "computers"—mathematical prodigies whose only job was to crunch the numbers that would ultimately appear in the Almanac—working day and night beginning in 1765.

Now to find a boat's longitude at sea, all a navigator needed to know was the local time and the position of the moon and a nearby reference point, whether that was the sun or a well-known evening star.

Thus, the Almanac was a breakthrough for mariners, including one of its first customers, Lieutenant (ultimately Captain) James Cook, who field-tested the reference book on his first voyage around the world, finding it superior to any way-finding technique he'd yet seen.

The normally reserved Cook recorded in his journals his pleasure with the Almanac's precision and ease of use.
"It is only by this means that this method of finding the longitude at sea can be brought into universal practice," Cook wrote.
"[It is] a method which we have found may be depended on to within a half a degree! Which is a degree of accuracy more than sufficient for all nautical purposes."

It's Official

Higgitt says that soon after the Almanac—which like the Mariner's Guide before it used the Greenwich Observatory as its prime meridian—was published, merchant fleets and navies beyond British shores began to adopt Britain's superior navigational technology.

For example, France's nautical almanacs, Connaissance des Temps, simply reprinted Maskelyne's lunar charts verbatim from 1772 onward—effectively appointing Greenwich as their prime meridian too.

Moreover, British cartographers used the Mariner's Guide and Almanac to help them map the planet.
This opened up another channel to disseminate the Greenwich prime meridian around the world, as navies and merchant fleets from France, Holland, Spain, and elsewhere came to rely on the often superlative British maps.

By 1884, some 72 percent of the world's shipping tonnage was following the Greenwich standard. And that year, a congress of nations around the world made it official, declaring the Royal Observatory in Greenwich, England, as the Earth's true prime meridian.

Time zones

Greenwich Time

After Greenwich was appointed the Earth's geographical standard-bearer, a similar need for a global time standard led it to become the world's default timekeeper too.
So whenever NASA today launches a rocket into outer space, its clocks are set not to Houston or Kennedy Space Center time but rather to absolute Greenwich Time, also called "Universal Time," which doesn't change with the seasons like in other time zones.
Airplane pilots also use Greenwich as their fallback time zone, calling it "Zulu Time."

Moreover, the selection of Greenwich as the prime meridian helped establish the international date line exactly halfway around the globe from Greenwich.
Transpacific travelers must set their calendars ahead by one day when they travel west across the date line, and back by one day when they cross it going east.

And so today, the prime meridian at Greenwich, England, stands as a quiet testimonial on every modern map, navigational chart, and GPS device to the astronomers who finally cracked the longitude puzzle, changing the world—including how easily we get from place to place and tell what time it is when we arrive—forever.

Links :


Monday, May 27, 2013

Why warming oceans could mean dwindling fish


Fish catches could be hurt by climate change, making fishes move towards North :
 ocean warming means a new paradigm for the world's fisheries
Jeff Rotman/Photolibrary/Getty Images

From Time

It’s easy to forget that global warming doesn’t just refer to the rising temperature of the air.
Climate change is having an enormous, if less understood, impact on the oceans, which already absorb far more carbon dioxide than the atmosphere.
Like so much of what goes on in the vast depths that cover more than two-thirds of our planet’s surface, the effect of climate change on the oceans remains a black box, albeit one that scientists are working to illuminate.

Here’s one way: fisheries.
Wild fish remain a major source of protein for humanity — as well as a major source of reality-TV shows — and for some coastal communities, fish mean even more.
Scientists aren’t clear about what effect climate change, including the warming of the oceans, will have on wild fisheries.
As Mark Payne of the National Institute of Aquatic Resources writes in a new piece in Nature, ocean researchers “tend to view climate change as a dark cloud on the horizon: potentially problematic in the future, but not of immediate concern” — especially compared with the much more pressing threat of simple overfishing


Changes in MTC (Mean Temperature of the Catch) and SST (Sea Surface Temperature)
of 52 LMEs (Large Marine Ecosystems) between 1970 and 2006.

But now a new study in Nature makes the case that climate change — including the warming of the oceans — is already having a direct impact on global fisheries.
Researchers led by William Cheung at the University of British Columbia’s Fisheries Centre created a new model that took the known temperature preferences of different species of commercial fish and compared those figures with catch numbers from around the world.
They found that species comfortable in warmer waters have been replacing fish that are more accustomed to cool temperatures.
That means climate change is altering the makeup of fisheries around the world — and that could be particularly bad for the tropics, which may eventually become too hot for even for fish that tend to prefer it on the warmer side.

As Cheung’s co-author Daniel Pauly put it in a statement:
We’ve been talking about climate change as if it’s something that’s going to happen in the distant future — our study shows that it has been affecting our fisheries and oceans for decades.
These global changes have implications for everyone in every part of the planet.

The study’s methodology is clever.
Trying to estimate fish populations and distributions has always been a difficult and highly contentious process for the simple reason that there is so much ocean.
You can use sonar estimates and trawl surveys — literally dredging the ocean — to try to get more precise samples, but that’s difficult and expensive.
Another option is to use commercial-catch statistics, which are kept by nearly every country in the world but tend to lack the requisite rigor.
Countries have all sorts of motivations to fudge their catch numbers — especially in an age when catch quotas are being implemented to limit overfishing — and fishermen logically go after commercially viable species over unpopular fish, which then further skews the data.

Species from warmer waters are replacing those that are traditionally caught in fisheries worldwide. This graphic presents concepts from Cheung et al. (2013).
The thermometers are representative of trends in ocean temperature over time and the fish are representative of trends in catch composition over time.
They do not represent specific values.
Please consult the results section of Cheung et al. (2013) for exact data points.
Graphic by The Pew Charitable Trusts’ ocean science division.

The Nature team got around this problem by developing a sort of “thermometer” for fish distribution, analyzing the mean temperature of the catch (MTC).
For each species in their database, the researchers derived a characteristic temperature range — in short, how hot or cold the fish could stand — weighted by the amount of each species caught.

They applied their metric to nearly 1,000 species across 52 large marine ecosystems from 1970 to 2006, looking at how water temperature changed over that period. (Hint: it got warmer.)
And they found what you might expect: as water temperatures increased, so did the MTC, meaning that warm-water-preferring species moved in and cold-water-preferring species moved out.

Because catch numbers do not automatically equal actual populations, we can’t say for sure that the changes Cheung and his colleagues saw are an absolute reflection of what’s happening to wild fish beneath the waves.
Other factors — like consumer preferences or fuel costs — influence what kinds of species fishermen think are worth catching.
But even the changes in the catch data alone are startling — especially for tropical regions, as Payne writes:

In these regions, the fact that the catch composition seems to have reached the terminal hot-water state means that further warming may reduce fishery yields, if it has not already done so.
The countries that border tropical waters are also those that are the most dependent on fisheries as sources of employment, foreign revenue and food, and are least able to adapt to such changes.

The oceans can sometimes seem so vast that nothing we could do could possibly alter them.
But climate change — and our enormous hunger for seafood — seems up to the task.

Links :
  • CSMonitor : Blue crabs in Maine? Something fishy about global warming.
  • Huffington Post : Climate change impacts ripple through fishing industry while ocean science lags behind

Sunday, May 26, 2013

Container shipping the world in a box


Containers transporting everything from shoes to aerospace parts make over 200m journeys a year by ship, truck and train.
In the second video in the FT's 50 Best Business Ideas series, David Pilling, Asia Editor, explains why standardised containers revolutionised world trade by minimising transport costs

 
Largest container ship in the world: CMA CGM Marco Polo