Raw power of the ocean
— Science girl (@sciencegirl) February 24, 2026
pic.twitter.com/B3ON0Yv0ep
Saturday, June 6, 2026
Raw power of the ocean
Earth's deep tectonic “pump” moves billions of microbes to the surface in an evolutionary cycle
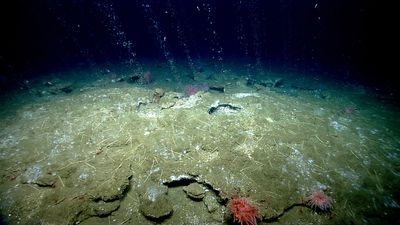
Cold seeps offer a brilliant window into this otherwise hidden world.
These cracks in the ocean floor act as vents, spewing enormous volumes of fluid from the subseafloor into the sea above.
Image credit: NOAA Office of Ocean Exploration and Research, 2013 ROV Shakedown and Field Trials in the U.S. Atlantic Canyons
Image credit: NOAA Office of Ocean Exploration and Research, 2013 ROV Shakedown and Field Trials in the U.S. Atlantic Canyons
From IFLS by Tom Hale
Earth's lifeless geology and its organic inhabitants share a surprisingly harmonious, cyclical relationship.
Beneath the seafloor, rich colonies of microbes thrive within buried ocean sediment.
Through the slow grind of tectonic plates, some are carried to the surface while others are swallowed into the planet's interior in what geologists have dubbed a "tectonic pump."
Until recently, scientists had little idea of just how much life lurks below the surface.
The deep subsurface was long considered too hot, too pressurized, too starved of nutrients to harbor much of anything.
But over the past few decades, advances in sampling technology and DNA sequencing have revealed a hidden “deep biosphere” of staggering scale.
By some estimates, the majority of microbes on the planet live underground, sometimes sitting dormant for thousands or even millions of years.
According to new research by the University of Southern California, the “tectonic pump” may be an important part of this process.
The researchers unearthed evidence of a giant geological “elevator” upon noticing that regions with more earthquake activity tended to harbor a greater abundance of underground-dwelling microbes on the seafloor.
Earthquakes, it seemed, were dredging these microbes up from the deep.
“We can also examine how seismic activity relates to the relative abundance of different microbial groups, and we find a positive correlation between seismic energy and the abundance of subsurface-associated microbes,” Zhengze Li, a PhD student at the University of Southern California, said in a statement.
Li and the team explain how the tectonic pump is linked to subduction zones, places where one tectonic plate slides and descends beneath another.
As the downgoing plate sinks, layers of sediment are scraped from its surface and pile up in a wedge against the overriding plate, squeezing fluid and microbial life upward in the process.
Meanwhile, many microbes on the downgoing plate are sent on a “trip to hell,” Li said, deeper within Earth’s interior to its mantle.
For those brought back toward the surface, the journey may be a fundamental part of their evolutionary cycle, allowing them to wake from dormancy and reproduce after millions of years of dormancy.
"The full cycle – from burial and transport with the subducting plate to eventual return – can take tens of millions of years or longer," Li said.
From lava lakes to hydrothermal vents, microbial communities can survive in some of the most extreme conditions on the planet—and nowhere is that more apparent than the peculiar landscapes of the deep sea.
Dive deep with geobiologist Jeffrey Marlow to explore the hidden worlds inside a volcano and at the bottom of the oceans and discover how the incredible microbes that live there are essential to the health of our planet in ways we’re only just beginning to understand.
It doesn't just take a catastrophic earthquake to set the pump in motion.
The models suggest that even a “silent” slow slip event and the gradual creeping of plates can mobilize fluid and send microbes on their way.
The scale of this movement is monumental.
According to their models, the tectonic pump could circulate more than 1 million gigatons of fluid per million years, potentially transporting up to 1030 (that’s 1,000,000,000,000,000,000,000,000,000,000) microbial cells.
They may be microscopic, and it takes hundreds of thousands of years, but this would represent the largest migration of life ever recorded.
The research was recently presented at the 2026 Seismological Society of America Annual Meeting.
Friday, June 5, 2026
Strategic pings: the big silent hunters
 Silent Giant - Thomas Meurling (Nano Banana and Photoshop)
From Pulse by Thomas Meurling
Extra-Large Uncrewed Underwater Vehicles, or XLUUVs, are changing undersea warfare.
Not because they are big.
Not because they are unmanned.
And not because they look impressive in defense exhibition renderings.
They matter because they can carry mission payloads into places where humans should not have to go, stay there for a long time, and collect acoustic intelligence in a GPS-denied, radio-silent, pressure-heavy environment.
But here is the uncomfortable truth.
An XLUUV without the right sonar payload is just an expensive underwater bus.
 Underwater Bus
The platform provides endurance.
They matter because they can carry mission payloads into places where humans should not have to go, stay there for a long time, and collect acoustic intelligence in a GPS-denied, radio-silent, pressure-heavy environment.
But here is the uncomfortable truth.
An XLUUV without the right sonar payload is just an expensive underwater bus.
Underwater BusThe platform provides endurance.
The payload provides purpose.
The sonar provides understanding.
Why XLUUVs Are Not Underwater Trucks, They Are Sensor Weapons
For more than a century, the submarine was the apex predator of the undersea domain.
Silent, expensive, crewed, and politically sensitive.
Now something different is entering the water.
It does not need coffee.
Now something different is entering the water.
It does not need coffee.
It does not need sleep.
It does not complain about hotel points.
It can transit quietly, sit near the seabed, map a cable route, carry payloads, listen for activity, and move again when the mission requires it.
Welcome to the age of the XLUUV.
The industry loves to talk about size, range, endurance, payload bay, and autonomy.
Welcome to the age of the XLUUV.
The industry loves to talk about size, range, endurance, payload bay, and autonomy.
Fair enough.
These things matter.
Boeing describes Orca as an XLUUV with a large modular payload section intended for open-ocean transit, bottom-following, seabed operations, and mission flexibility.
NAVSEA accepted delivery of the first Orca XLUUV test asset in December 2023, emphasizing the modular payload section for sensors, communications, and mission-specific systems.
But the real question is not: how far can it go?
The real question is: what can it understand when it gets there?
Because underwater autonomy is not magic.
But the real question is not: how far can it go?
The real question is: what can it understand when it gets there?
Because underwater autonomy is not magic.
It is acoustics, navigation, signal processing, and mission doctrine wrapped inside a pressure hull.
In the air, a drone can use GPS, cameras, radio links, radar, and satellite communications.
In the air, a drone can use GPS, cameras, radio links, radar, and satellite communications.
Underwater, most of that disappears very quickly.
Radio frequency energy dies.
Cameras are range-limited.
GPS does not work at depth.
Communications are slow, intermittent, and acoustic.
The XLUUV relies solely on sound.
That means sonar is not a bolt-on accessory. It is the nervous system.
The XLUUV relies solely on sound.
That means sonar is not a bolt-on accessory. It is the nervous system.
XLUUVs Missions
For mine warfare and seabed operations, active sonar becomes critical.
Synthetic aperture sonar, or SAS, provides high-resolution imagery over wide areas and helps solve one of the old problems of side-scan sonar: resolution degradation at range.
Traditional side-scan sonar can tell you that something interesting may be on the seabed. SAS gets you closer to understanding what it is, where it is, and whether it matters.
Multibeam echo sounders add the 3D picture.
Multibeam echo sounders add the 3D picture.
They provide bathymetry, slopes, seabed shape, and clearance data.
That matters if you are navigating near the bottom, selecting a payload placement location, inspecting infrastructure, or avoiding an expensive collision with geology.
Passive sonar plays a different game.
Passive sonar plays a different game.
It listens. It does not reveal itself by transmitting.
For ISR, anti-submarine support, pattern-of-life monitoring, and covert surveillance, passive arrays can be more important than active imaging.
The XLUUV can be equipped with a passive sonar suite; conformal array, flank array, towed array, and intercept array.
Sometimes the smartest acoustic move is to shut up and listen.
XLUUV Approaches
This is where the XLUUV conversation becomes interesting.
 Collage of different XLUUVs (China, USA, Australia and UK)
Boeing Orca represents the heavy modular approach.
Anduril’s Dive-XL represents a fast-moving, software-heavy approach.
In March 2026, Anduril said the U.S. Navy and DIU selected it for the Combat Autonomous Maritime Platform project, aimed at advancing extra-large autonomous underwater vehicles.
XLUUVs carry payloads and provide persistence.
XLUUVs carry payloads and provide persistence.
Medium UUVs classify and survey.
Small UUVs inspect.
USVs communicate, launch, recover, and relay.
Seabed nodes listen.
AI helps sort the acoustic mess.
Humans still define intent.
The sonar benchmark remains platforms like Kongsberg’s HUGIN Superior, even if it is not an XLUUV.
The sonar benchmark remains platforms like Kongsberg’s HUGIN Superior, even if it is not an XLUUV.
It shows what high-end undersea sensing can look like when the payload is treated as the heart of the system.
Kongsberg states that HUGIN Superior carries HISAS 1032 dual-receiver synthetic aperture sonar, generating about 1,000 meters of swath at 2.5 knots with consistent high-resolution SAS imagery, along with an EM2040 Mk II multibeam.
That is the difference between “something is down there” and “that is a mine-like object, next to a cable, on rippled sand, at this coordinate.”
Other nations are moving too.
That is the difference between “something is down there” and “that is a mine-like object, next to a cable, on rippled sand, at this coordinate.”
Other nations are moving too.
The Royal Navy’s XV Excalibur, developed under Project Cetus, is a 12-meter, 19-ton experimental XLUUV testbed intended to explore payloads, autonomy, and future crewed-uncrewed teaming.
China’s new generation of XLUUVs suggests a serious shift in undersea power.
China’s new generation of XLUUVs suggests a serious shift in undersea power.
The focus is no longer just on small autonomous underwater vehicles for survey or inspection.
China appears to be moving toward much larger, mission-capable underwater drones designed for ISR, seabed operations, mine warfare, and potentially payload delivery.
Reports describe multiple Chinese XLUUV designs, including the AJX-002 and HSU-100, with some larger concepts reportedly exceeding the scale of the U.S. Boeing Orca.
 Chinese XLUUV programs
The provocative point is that China is not betting on one platform.
Chinese XLUUV programsThe provocative point is that China is not betting on one platform.
It is building a family of large unmanned underwater systems with different roles, sizes, and likely mission profiles.
That gives China more flexibility than a single-purpose vehicle focused mainly on mine deployment. Compared with Western efforts such as Orca and emerging systems like Dive-XL, China’s approach looks broader, faster, and more aggressive.
The undersea competition is moving from experimental autonomy to deployable sensor-and-payload networks.
Russia continues to pursue a split path between deep-water ISR vehicles and strategic underwater weapons.
Russia continues to pursue a split path between deep-water ISR vehicles and strategic underwater weapons.
The details are often opaque, and we should be careful not to pretend that every sonar suite is publicly known.
XLUUV Trends
But the trend is obvious.
The undersea domain is becoming more distributed, more autonomous, and more sensor-driven.
And that leads to the provocative point.
The next undersea arms race will not be won by the country with the biggest unmanned submarine.
It will be won by the country that best integrates sonar, autonomy, payloads, and mission doctrine into one coherent undersea system.
Because endurance without sensing is tourism.
Autonomy without sonar is wandering.
And a beautiful XLUUV without acoustic intelligence?
That is just an underwater bus with a defense budget.
So next time someone shows you a sleek unmanned submarine rendering, ask the uncomfortable question:
Nice hull. What sonar is on it? (see below)
Links :
- THALES 76Nano sonar for XLUUV
- National Interest : Why China’s XLUUV Drones Are Sea Monsters
Thursday, June 4, 2026
Fifteen maps that changed how we see the ocean floor

From The Library of Lost Maps by James Cheshire
Celebrating the Pioneering Cartography of Marie Tharp and Bruce Heezen
“I had a blank canvas to fill with extraordinary possibilities, a fascinating jigsaw puzzle to piece together: mapping the world’s vast hidden seafloor.
It was a once-in-a-lifetime—a once-in-the-history-of-the-world—opportunity for anyone, but especially for a woman in the 1940s.” Marie Tharp.
A few weeks into my exploration of the University College London Geography Map Library I happened upon two drawers filled with vast “physiographic” maps.
These were not conventional contour maps, but textured, almost sculptural views of the Earth’s surface.
Many were by Armin Lobeck and Erwin Raisz, pioneers of the approach, which was especially popular in the 1940s and 1950s.
 Physiographic Diagram of North America: The Geographical Press, Columbia University (1948) 57 × 79.5cm
Among the maps of mainland Europe and North America were three enormous ocean‑floor maps — spanning the South Atlantic, the Western Pacific, and the Indian Ocean — created by Marie Tharp and Bruce Heezen.
Tharp is now one of the most celebrated cartographers from the 20th Century (even being featured as a Google Doodle in 2022).
The maps of the ocean floor she produced with Heezen transformed our understanding of the landscape beneath the waves, simultaneously capturing the imagination of millions but also informing the theory of plate tectonics: one of the most important scientific breakthroughs of the postwar era.
When I first found these maps I recognised Tharp’s name, but I knew little about how these maps had been made.
My curiosity got the better of me, so I extended a pre-booked trip to Washington to spend several days sifting through Tharp’s vast archive housed at the Library of Congress.
Only there did I truly understand the scale and ambition of the maps of the ocean floor she dedicated her career to.

A dream come true: Viewing the “World Ocean Floor Panorama” at the Library of Congress
There so much fantastic material that has already been written about Tharp and her legacy (I’ve listed some at the end), but nowhere have I found the most signficant maps she helped to create gathered in one place.
So I have created a chronology of these ocean floor maps to show how they became some of the most well-known and influential maps of the twentieth century.
I know there are a few I’ve missed that are in National Geographic atlases and on globes, but the fifteen below show the most comprehensive evolution of the ocean floor mapping work I’ve found to date.
I’ve kept the text to the minimum here, but if you want to read my detailed version of the story it can be found in the later chapters of The Library of Lost Maps!
n.b. : Images below are largely scanned from maps held by UCL Geography/ my own collection and used here for educational purposes.
The maps remain in copyright so permission for re-use should be sought from the relevant holders.
1. Physiographic Diagram Atlantic Ocean (1957)
 Physiographic Diagram Atlantic Ocean: The Geological Society of America (1957) 137.5 × 68.5cm
In September 1957 Heezen co-authored a paper in The Bell System Technical Journal titled “Oceanographic Information for Engineering Submarine Cable Systems”.
It was a specialist paper for engineers interested in laying cables, but in the back was the “Physiographic Diagram Atlanitc Ocean”, which was the first of Tharp’s major creations.
Detailed bathymetric contours were considered militarily sensitive at the time, so Tharp and Heezen took a different approach.
Instead of only charting precise depths, they focussed on the terrain and shapes of the seafloor and deflty skirted the censors.
The result was an entirely different impression of what the bottom of the ocean looked like.
Gone was the idea that it was flat and featureless: the map suggested something much more textured and intriguing.
Gone was the idea that it was flat and featureless: the map suggested something much more textured and intriguing.
 Section of Physiographic Diagram Atlantic Ocean: The Geological Society of America (1957)
This map was also significant as Tharp had sketched in a rift valley along the centre of the Mid-Atlantic Ridge.
She had deduced its existence from assembling cross‑sections of depths and noticing a V‑shaped indentation in all of them that could be aligned to indicated a vast fracture splitting the ocean floor.
At first, the idea was dismissed, not least by Heezen, who like many geologists of the time, found the notion uncomfortable.
A rift implied movement.
And movement, in turn, hinted at continental drift — an idea that was still considered controversial.
But Tharp’s data became impossible to ignore, so in 1957 (the same year as the physiographic map), Tharp, Heezen, and Maurice Ewing published their findings, announcing the rift valley as a major feature of the ocean floor.
The media seized on the story.
Headlines proclaimed that the world was “cracking up.”
In the Library of Congress is a globe that Heezen has painted over to show the key geological features of the seafloor, not least his vision for a “world girdling” rift valley (in red) which dissected the oceans.


The combination of a map that transformed deep from a featureless plain to a dramatic series of mountains and canyons, and the finding that Earth was “cracking up” ignited the public’s imagination and caught the attention of the biggest magazines of the era.
2. The Newly Discovered World Beneath the Waves (1959)

The Newly Disvovered World Beneath the Waves: Fortune Magazine (1959)
Tharp and Heezen’s data found its way into magazines like Life and Fortune, illustrated by some of their most skilled graphic artists.
Among the first was Richard Edes Harrison, whose 1959 world map of the ocean floor brought this hidden landscape into homes and classrooms.
He used an innovative projection that helped to create this single ocean view as he explains to readers:
“The surface of the earth has been cut, like the skin of an orange, along the American continents (at longitude 70° west) and pressed flat in such a way that the relative sizes of all areas are free from distortion.”
I think this is the first global map of the ocean floor that includes the data processed by Tharp and Heezen.
It is printed on very shiny paper – in subtle colours – so was very hard to do justice in a photo!

3. The New Portrait of Our Planet (1960)

The New Portrait of Our Planet: Life (1960) 128.5 × 76cm
Kenneth Fagg’s rendering, published in 1960, is one of my favourites.
It is huge poster that splits Earth into four hemispheres set on a near black background.
Life Magazine also included it within their “Life Nature Library” books.
He chose to colour the floor by sediment type, which makes Earth look more like Mars, but Heezen felt was slightly “too bold”.

4. The Floor of the World Ocean (1961)

The Floor of the World Ocean: Association of American Geographers (1961) 68 × 40cm
In 1961 Edes Harrison produced a second map in much more muted tones to Life’s version as a supplement to an academic journal.
It was printed much larger in comparison to his original version and without the ocean currents on the top.
The thicker, uncoated, paper gives the map a much classier feel than the glossy magazine format of his first version.
5. Physiographic Diagram of the South Atlantic Ocean (1961)

Physiographic Diagram of the South Atlantic Ocean: The Geological Society of America (1962) 118 × 142cm
Buoyed by the success of their first map and the interest it generated, Tharp and Heezen pushed on into the early 1960s with their physiographic maps.
They benefitted too from a wealth of data that was being gathered on numerous expedition ships.
In 1961 they published what was to be the largest in the series: the South Atlantic Ocean…which was followed by the Indian Ocean in 1964.
6. Physiographic Diagram of the Indian Ocean (1964)

Physiographic Diagram of the Western Pacific Ocean: The Geological Society of America (1962) 116 × 84cm
7. Indian Ocean Floor (1967)
 Indian Ocean Floor: National Geographic Magazine (1967) 63.2 × 48.2cm
The yellow and blue physiographic giants could be purchased for a few dollars and sent out either folded or in tubes.
These maps appealed to a fairly niche crowd of geologists and oceanographers, and certainly weren’t going to make Tharp and Heezen as well known as they are today.
It wasn’t until the late 1960s that National Geographic Magazine initiated a collaboration that would define the visual language of the ocean floor for generations.
They paired Tharp and Heezen with an Austrian artist named Heinrich Berann.
The three of them would collaborate for over a decade, with Berann taking Tharp and Heezen’s processed data and sketches to create his own renderings under their careful supervision.
The first result was a map of the Indian Ocean, published in 1967.
It amazed millions of readers with this unfamiliar perspective and shocked them with the sight of great fissures carving up the Indian Ocean.
The success of the map led to a second comission for the Atlantic Ocean in 1968.
8. Atlantic Ocean Floor (1968)

Atlantic Ocean Floor: National Geographic Magazine (1968) 38 × 50cm
Probably the most recognisable of the National Geographic Maps is the “Atlantic Ocean Floor”.
Whilst being visually stunning, it also shows a further breakthrough by including “transform faults”.
These are large cracks that can be seen running perpendicular to the Mid-Atlantic Ridge and are caused by the tension of the plates either side of it moving at different speeds along their length (plate tectonics was by now a widely accepted theory) .

Below is I photo I took (standing on a stepladder!) of the “South Atlantic Ocean” alonside the National Geographic poster to demonstrate just how large the former is – and how much Berann squeezed into the latter!

9. Western Pacific Ocean (1971)

The final map from Tharp and Heezen in their physiographic style is of the Western Pacific Ocean.
I love how Tharp breaks the neatline around the edge of the map to squeeze in (most of) New Zealand and Australia.
10. Pacific Ocean Floor (1969)
 Pacific Ocean Floor: National Geographic Magazine (1969) 63.2 × 48.2cm
The penultimate map published in National Geographic Magazine was of the Pacific and, finally, the Arctic followed two years later…
11. Arctic Ocean Floor (1971)
 Pacific Ocean Floor: National Geographic Magazine (1971) 63.2 × 48.2cm
Thanks to National Geographic and the collaboration with Berann, millions — perhaps tens of millions — of people had seen the ocean floor in a whole new light by the start of the 1970s.
12. Carte du Fond des Océans (1973)
 Carte du Fond des Océans: Éditions Pierre Charron (1977) 96 × 54.5cm
National Geographic went ocean-by-ocean, so it had been over a decade since any illustrators had tackled a global map of the ocean floor.
Then in late 1968/early 1969 the geologist Xavier Le Pichon commissioned an illustrator named Tanguy de Rémur to create a world map (in French) based on the available maps including the physiographic maps that Heezen and Tharp had completed.
“Carte du Fond des Océans” was the result.
In the back catalogue of Heezen and Tharp’s maps the de Rémur map is often mistaken for one that they had a direct hand in.
This is understandable because it has clearly drawn inspiration from the National Geographic maps and, what’s more, a later edition was published in english under the banner of the American Geographical Society that is credited to Heezen and Tharp.
In this case their exisiting maps were used but to my knowledge they did not supply data and supervision in the way they had for the other maps
13. The Floor of the Oceans (1976)

The Floor of the Oceans: American Geographical Society (c.
1976) 96 × 54.5cm
1976) 96 × 54.5cm
The map above was sold by the AGS to raise much-needed funds for the society.
14. Physiographic Map of the Earth (1975)
 Physiographic Map of Earth (1975) 76 x 50cm
Now this map by William Chesser, published in 1975 to accompany the textbook Exercises in Physical Geology by W. K. Hamblin & J. D.Howard, is the one I know least about!
I spotted no reference to it in the Tharp archive but she and Heezen are prominently credited as data sources.
It is the only map in the physiographical style of the entire globe to include land and oceans I have found and is probably not as well known.
Not least because it lacks some of the visual impact of the de Rémur map that was doing the rounds at the same time.
It would also have been eclipsed by what would be Tharp, Heezen’s and Berann’s final map…
15. World Ocean Floor Panorama (1978)
 World Ocean Floor (1978) in this case published as a special version for the UK’s Open University.
161 x 94 cm.
In 1974, with support from the US Office of Naval Research, work began on what would become the World Ocean Floor Panorama.
This was not a compilation of previous maps, it was a painstaking re‑evaluation of the underlying data.
Heezen and Tharp returned to original soundings, refining details across every ocean basin.
In his studio near Innsbruck (Austria) Berann, joined by his assistant Heinz Vielkind, translated Tharp’s sketches into a continuous, rolling vision of the planet.
Tharp and Heezen travelled to Austria to oversee the work and by 1977 it was finished.
They were able to carefully roll the map and fly back with it to the US.
The first print tests were completed just before they headed off on a research voyage to the coast around Iceland.
It was on this trip that tragedy struck and Heezen died suddenly of a heart attack while exploring the Reykjanes Ridge in a submarine.
Tharp learned of his death by radio, while aboard another research vessel.
Upon her return, and after making arrangements for Heezen’s repatriation and funeral, Tharp continued pushing to get the map printed.
She refined the colours, oversaw the labelling, and arranged the printing.
When World Ocean Floor Panorama was finally published in May 1978, it bore a dedication from the United States Navy honouring Heezen’s contributions.
She refined the colours, oversaw the labelling, and arranged the printing.
When World Ocean Floor Panorama was finally published in May 1978, it bore a dedication from the United States Navy honouring Heezen’s contributions.
 Photo of the World Ocean Floor Panorama manuscript
Getting to see the orignal up close (in the Library of Congress) was an extraordinary experience.
Berann and Vielkind had created a map that looked like a 3D model not a 2D painting.
It stands alone as a stunning artwork.
You can see the full size scan here.
Berann and Vielkind had created a map that looked like a 3D model not a 2D painting.
It stands alone as a stunning artwork.
You can see the full size scan here.
 World Ocean Floor: (1977) 191.5 × 106cm
Final thoughts
 Marie Tharp in later years surrounded by her many maps.
 Photo: Lamont-Doherty Earth Observatory and the estate of Marie Tharp.
Half a century after is was published, the “World Ocean Floor Panorama” map and others that Tharp and Heezen had a hand in still sit at the top of the Google rankings — unmatched in clarity and beauty.

A recent Google Image search for “ocean floor map”.
The maps boxed in red come from the list above.
In an era before digital cartography, Tharp and Heezen estimated that over fifty million maps based on their work were already in circulation.
Today, that number must be vastly higher.
Billions of people have absorbed an understanding of the Earth shaped by Marie Tharp’s vision.
Further Reading
I wanted to pull together what I see are the fifteen most important maps that Tharp and Heezen were involved in to provide cartographic inspiration and broaden their canon beyond the “World Ocean Floor Panorama” which is the most frequently used to illustrate Tharp’s story.
But there is so much more to say!
So if you would like read more about how the maps were made and how they influenced the science of the time, this is what I write about in The Library of Lost Maps so do pick up a copy!
If you would like to know more about Tharp’s life and her relationship with Heezen (and others in the scientific community) I heartily recommend Hali Felt’s book: Soundings.
The Library of Congress is home to the Tharp archive and has published several articles and blog posts about it.
See here and here for two recent examples.
And if you are a cartographer looking to create your own maps in the Berann style see here.
Links :
- GeoGarage blog : Mapping the deep: Marie Tharp's physiographic diagram of ... / Marie Tharp: the woman who mapped the ocean floor / Geologist Marie Tharp mapped the ocean floor and helped ... / 1968 Tharp and Heezen Map of the North Atlantic Ocean Floor / How one brilliant woman mapped the ocean floor's secrets / If the ocean was transparent : the see-through sea / The great challenge of mapping the sea / Secretly mapping the sea floor / Why the first complete map of the ocean floor is stirring ... / Secretly mapping the sea floor / Nippon Foundation wants to map entire Ocean Floor by 2030
Wednesday, June 3, 2026
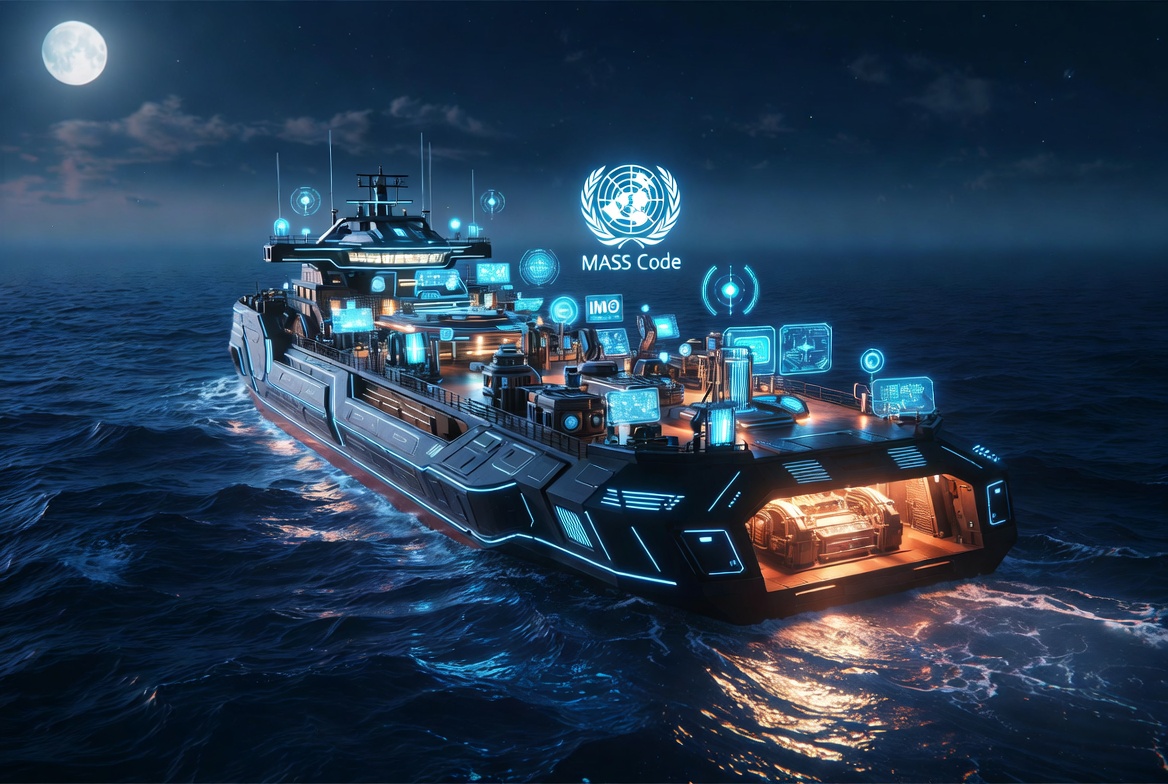
IMO approves global framework for maritime autonomous ships
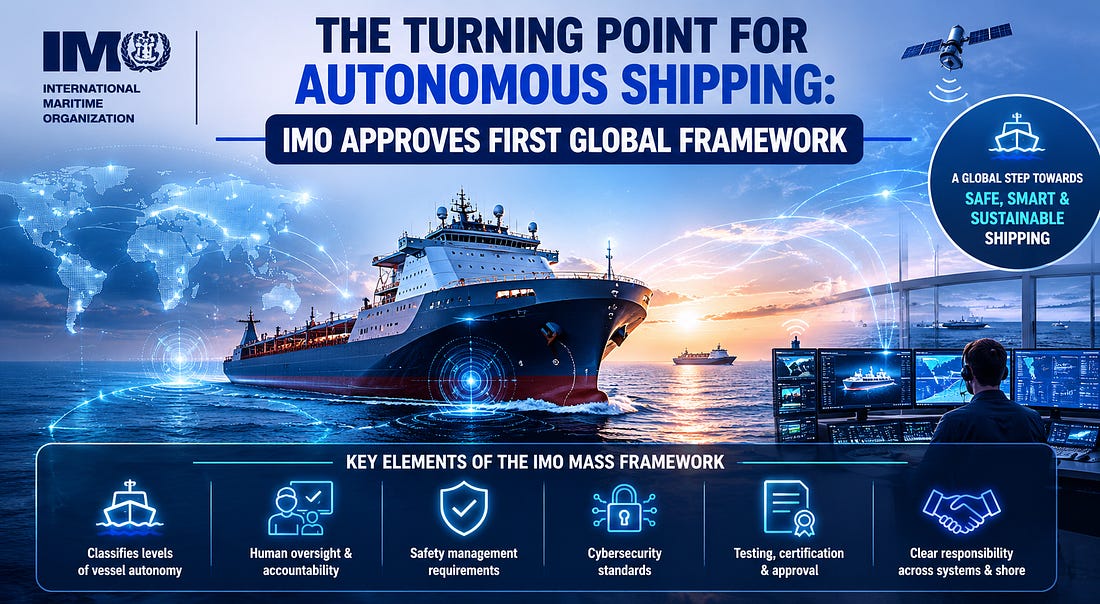
The International Maritime Organization (IMO) has taken a significant step toward the commercial adoption of autonomous shipping by approving the first global regulatory framework for Maritime Autonomous Surface Ships (MASS).
The framework establishes baseline international requirements for the safe operation of autonomous and remotely operated vessels.
The framework establishes baseline international requirements for the safe operation of autonomous and remotely operated vessels.
It is designed to provide a harmonised approach across flag states, reducing fragmented national interpretations and creating a consistent structure for future deployment.
The IMO Maritime Safety Committee has approved the introduction of the VHF Data Exchange System (VDES) into the regulatory framework, with implementation expected from January 1, 2028.
VDES is often described as the next evolution of AIS, but its significance goes beyond vessel tracking.
VDES is often described as the next evolution of AIS, but its significance goes beyond vessel tracking.
While AIS primarily broadcasts a vessel's identity, position, speed, and course, VDES enables richer and more secure bidirectional communication between:
→ Ship-to-ship
→ Ship-to-shore
→ Ship-to-satellite
It also enables the exchange of operational and sensor data across the maritime ecosystem.
This is a key step toward a connected maritime future where:
- Vessels become data nodes
- Ports become intelligence hubs
- Fleets operate as coordinated networks
- Maritime awareness extends beyond individual platforms
VDES alone will not create a network-centric ocean, but it provides one of the critical communication layers needed to make it possible.
The future of maritime autonomy is not just autonomous vessels.
It is connected maritime intelligence.
Key elements of the framework
The approved framework includes several foundational components intended to govern the safe integration of autonomous vessel technologies:
The approved framework includes several foundational components intended to govern the safe integration of autonomous vessel technologies:
- Classification of different levels of vessel autonomy, from ship-controlled to fully autonomous operations
- Requirements for human oversight and accountability, including the role of shore-based control centres
- Mandatory safety management provisions for autonomous and remotely operated systems
- Cybersecurity standards addressing system resilience and operational integrity
- Testing, certification, and approval processes for autonomous vessel technologies
- Allocation of responsibility between onboard systems, remote operators, and regulatory authorities
Yara Birkeland was the world’s first fully autonomous container ship
(source: Yara Marine Technologies)
Why this matters for shipping markets
For years, autonomous vessel technology has progressed through trials and pilot projects, but regulatory uncertainty has remained one of the main barriers to wider commercial adoption.
For years, autonomous vessel technology has progressed through trials and pilot projects, but regulatory uncertainty has remained one of the main barriers to wider commercial adoption.
This framework provides the first structured pathway for integration into international shipping rules.
The development is relevant not only for maritime technology providers but also for commodity shipping markets, where operational efficiency and cost structures are closely linked to vessel performance.
Expected operational benefits
Autonomous and AI-enabled vessel operations are expected to support several efficiency gains across global shipping networks:
The IMO’s move reflects a broader industry transition toward digitalisation, where AI-assisted navigation, digital twins, and advanced analytics are becoming increasingly embedded in vessel operations.
Rather than being a standalone innovation, autonomous shipping is emerging as part of a wider transformation in how maritime logistics systems are managed and optimised.
The development is relevant not only for maritime technology providers but also for commodity shipping markets, where operational efficiency and cost structures are closely linked to vessel performance.
Expected operational benefits
Autonomous and AI-enabled vessel operations are expected to support several efficiency gains across global shipping networks:
- Improved voyage optimisation and route planning
- Reduced fuel consumption and emissions
- More efficient port arrivals and reduced waiting times
- Enhanced predictive maintenance capabilities
- Greater use of remote monitoring and operational support
The IMO’s move reflects a broader industry transition toward digitalisation, where AI-assisted navigation, digital twins, and advanced analytics are becoming increasingly embedded in vessel operations.
Rather than being a standalone innovation, autonomous shipping is emerging as part of a wider transformation in how maritime logistics systems are managed and optimised.
MASS stands for Maritime Autonomous Surface Ships.
These are ships that can operate with varying degrees of autonomy, ranging from partial automation to fully autonomous operations without human intervention.
The International Maritime Organization (IMO) has defined four levels of autonomy for MASS:
Degree One: Crewed Ships with Automation: Ships with automated processes and decision support. Seafarers are on board to operate and control shipboard systems and functions. Some operations may be automated.
Degree Two: Remotely Operated Ships with Crew Onboard: Remotely controlled ships with seafarers on board. The ship is controlled and operated from another location, but there are still crew members on board.
Degree Three: Remotely Operated Ships without Crew Onboard: Remotely controlled ships without seafarers on board. The ship is operated entirely from a remote location, and there is no crew on board.
Degree Four: Fully Autonomous Ships: Fully autonomous ships. The ship’s operating system can make decisions and take actions independently without human intervention.
What comes next
While fully autonomous deep-sea bulk carriers and tankers remain some way off, this framework marks an important transition from experimentation toward regulated implementation.
It will be interesting to see which segment adopts first: coastal shipping, offshore support vessels, short-sea trades, or eventually large-scale deep-sea commercial fleets.
Links :
Tuesday, June 2, 2026
A vast dam across the Bering Strait could stop the AMOC collapsing

The Bering Strait separates Alaska and Russia
Ocean Color/OB.DAAC/OBPG/NASA
Ocean Color/OB.DAAC/OBPG/NASA
From NewScientist y Joshua Howgego
If a key ocean current collapses it could plunge northern Europe into a
big freeze.
Now researchers are weighing up a drastic intervention – building a 130-kilometre-wide dam between the US and Russia
Now researchers are weighing up a drastic intervention – building a 130-kilometre-wide dam between the US and Russia
It would be an engineering project on a truly epic scale, but we may one day need to consider building a dam between Alaska and eastern Russia.
The audacious proposal would be designed to stave off the worst consequences of the collapse of a vital ocean current, and researchers have been mulling it over this week at a major conference.
The idea comes from Jelle Soons and his colleague Henk Dijkstra at the University of Utrecht in the Netherlands, who study the Atlantic Meridional Overturning Circulation or AMOC.
This current system, which includes the Gulf Stream, is a major reason why northern Europe has a relatively mild climate for its latitude.
However, we know the current is weakening.
There is huge uncertainty about what would happen if it collapses, but some models suggest it could see temperatures in northern Europe drastically plunge.
Soons thought a dam could be a possible intervention after hearing about how during the Pliocene era, from roughly 5.3 to 2.6 million years ago, sea levels were lower and there was a land bridge where we now find the Bering Strait.
Simulations of the Pliocene climate show the AMOC was stronger then, mainly thanks to that land bridge.
“I was like: ok, could we do this again?” says Soons.
To investigate the effects of building such a dam, Soons and Dijkstra ran simulations of the AMOC varying both the date when the dam would be built and the exact amount of freshwater present.
Freshwater is a key part of the equation because it currently flows from the Pacific through the Bering Strait into the north Atlantic, which weakens the AMOC.
Building a dam would stop or slow the flow.
In work published a few weeks ago, Soons and Dijkstra obtained mixed results: in some scenarios the dam appeared to strengthen the AMOC, but in others it had the opposite effect.
However, those results came from a relatively simple and low-resolution model.
On 5 May at the European Geosciences Union general assembly in Vienna, Austria, Soons presented work that repeated the simulations on a supercomputer using a much more advanced climate model.
This indicated that closing the Strait would strengthen AMOC, especially if the dam were built early – by at least 2050.
“I was surprised at how strong the recovery was,” says Soons.
The Bering Strait is only 59 metres deep at its deepest point and there are two small islands in the middle, meaning any barrier could conceivably be built in two halves.
Ed McCann, a past president of the Institution of Civil Engineers and now at Expedition Engineering says the best way to do this would be to avoid concrete and instead use floating machinery to build a barrier of rock and dredged sand.
“This sort of construction is pretty simple, just very big and very expensive,” he wrote in an email.
Jonathan Rosser at the London School of Economics says that the work is interesting but that because we don’t fully understand the AMOC, we can’t be sure of the consequences of such an intervention.
“These drastic things really do have big uncertainties attached.”
Soons agrees and says that while building a dam might be helpful to northern Europe, it could create other problems, such as altering rainfall patterns, elsewhere.
“Whether you would consider this a serious proposal? I don’t think we’re there yet,” he says.
This is not the first time that researchers have mulled the idea of building a huge sea dam to mitigate climate change.
In 2020, Sjoerd Groeskamp at the Royal Netherlands Institute for Sea Research unveiled an idea called the Northern European Enclosure Dam, which would involve building two barriers to hem in the sea between the UK and Europe and prevent rising sea levels from inundating low-lying parts of the continent.
As well as effects on climate, any such dam would have other side effects on things like marine-mammal migrations, tides and shipping to remote communities.
Soons says he has toyed with ideas like building half a barrier or having it descend to a depth of only say 10 metres.
These are “interesting ideas” he says, although he hasn’t yet had a chance to consider their merits properly.
Links :
Monday, June 1, 2026
ECDIS knowledge gaps exposed: what 5,000 bridge team assessments reveal about navigational risk

From Safety4Sea
The recently released NorthStandard ECDIS Training Assessment (ETA) Report provides one of the most revealing datasets yet on how bridge teams understand and use ECDIS onboard.
Based on more than 5,000 assessments conducted since February 2024, the report exposes a reality the industry has long suspected but rarely quantified: mandatory ECDIS certification does not necessarily translate into operational competence.
The findings are important because ECDIS today is no longer simply a chart display tool.
It is effectively the primary navigation environment onboard most SOLAS vessels.
When bridge teams misunderstand safety contours, datums, ENC updates, alarms, display layers or data quality indicators, the result is not merely inefficiency.
It creates elevated grounding risk, unsafe passage planning, alarm fatigue, positional inaccuracies and degraded situational awareness.
The report is particularly valuable because it moves beyond generic “training awareness” discussions and identifies where the actual knowledge gaps exist at a granular operational level.
What the ETA initiative is about
NorthStandard launched the ECDIS Training Assessment (ETA) platform in February 2024 as a structured competency assessment tool for bridge teams.
The objective is to evaluate practical ECDIS knowledge across the four pillars of passage management: Appraisal, Planning, Execution and Monitoring.
The platform is not designed merely as another CBT module.
It functions more as a diagnostic intelligence tool for identifying competency weaknesses at both individual and fleet level.
The assessment evaluates how bridge teams understand:
- ENC installation and updates
- Safety settings and contours
- Alarm management
- Display layers and scale usage
- Datum interpretation
- CATZOC and data quality
- Passage plan verification
- Monitoring and positional awareness
That distinction matters enormously.

Why the report is important
The significance of the report lies in the fact that it moves beyond theoretical training discussions and quantifies actual operational weaknesses using real assessment data.
The findings suggest that while most bridge teams can operate ECDIS functionally, many officers still lack a strong understanding of the system’s logic, limitations and risk implications.
This distinction is critical.
Modern navigational incidents increasingly stem not from absence of technology, but from overreliance on automation, alarm fatigue, poor understanding of safety settings and incorrect interpretation of navigational data.
Among the report’s key findings:
- Around one-third of bridge teams lacked understanding of critical ECDIS features such as datum discrepancies and ENC updates.
- Nearly half failed to prioritise correct ENC scale during passage planning.
- Half of respondents struggled to distinguish alarms from alerts and highlights.
- Significant gaps were identified regarding safety contours, symbols, display layers and ENC update management.
- Perhaps most concerning, the report found that many bridge teams relied excessively on automated route checking without performing sufficient visual verification of planned passages.
10 Key lessons learned from the ETA Report
1. Mandatory ECDIS certification is not enough
The report demonstrates that certified officers still show major competency gaps in operational ECDIS use.
Knowledge deficiencies appeared consistently across all four operational pillars.
This reinforces that compliance-driven training does not automatically produce operational mastery.
2. Datums remain a major industry weakness
Datum-related misunderstanding appeared repeatedly throughout the report.
Many bridge teams failed to understand WGS84 discrepancies, sounding datums and vertical datum implications.
This is dangerous because datum errors directly affect positional accuracy, under-keel clearance calculations and air draft assessments.
3. ENC updating is poorly understood
Nearly two-thirds of crews struggled to recognise ENC updates and understand update content.
This is not a procedural detail.
Outdated or improperly updated ENCs can create direct navigational hazards.
4. Officers overtrust automation
The report highlights overreliance on automated route checks and automated alarm logic.
ECDIS should support navigational judgement, not replace it.
Visual verification and critical assessment remain essential bridge team responsibilities.
5. Alarm fatigue and alarm confusion are still widespread
Half of the assessed personnel struggled to distinguish alarms, alerts and highlights.
Poor alarm understanding leads directly to alarm desensitisation, which is a recurring contributor in navigational incidents and casualty investigations.
6. ENC scale selection is frequently mishandled
Nearly half of bridge teams failed to prioritise correct ENC scale during passage planning.
Using the wrong scale can hide critical hazards or create excessive clutter that reduces situational awareness.
7. Safety contours are commonly misunderstood
The report repeatedly identified confusion around safety contours, deep contours and available charted depth contours.
This is one of the most operationally critical findings because incorrect contour logic directly affects grounding prevention.
8. Crews often do not understand data quality indicators
Many respondents misunderstood CATZOC, M_SREL, pick reports and survey reliability indicators.
ECDIS is only as reliable as the underlying hydrographic data.
If officers cannot assess data quality, they cannot assess navigational risk properly.
9. GPS overreliance persists
Some respondents reportedly believed GPS provides “100% accuracy.” This remains a dangerous mindset in an era of spoofing, jamming and sensor degradation.
10. Practical familiarisation is still weak
The report identified weak understanding of hover-over functions, display layers, symbol recognition, time zones and practical monitoring features.
This suggests that many officers use ECDIS functionally but not fluently.
There is a major difference.
Action plan for ship managers and maritime stakeholders
The ETA findings suggest that ECDIS competence should increasingly be treated as an operational risk management issue rather than purely a training compliance matter.
Ship managers and maritime stakeholders should consider the following actions:
Conduct fleetwide ECDIS competency assessments
Managers should identify vessel-specific and rank-specific weaknesses through structured assessments and scenario-based evaluations.
Prioritise high-risk competency areas
According to the report, urgent attention should focus on:
- ENC installation and updating
- Datum understanding
- Safety contours and safety settings
- Alarm management
- ENC scale usage
- Symbol recognition
- Display layer configuration
Traditional CBT and generic certification alone are insufficient.
Practical simulator-based training involving real operational scenarios should become standard.
Rebuild manual verification culture
Bridge teams should be encouraged to challenge automation rather than rely blindly on automated checks and alerts.
Standardise ECDIS procedures fleetwide
Companies should harmonise:
- Safety setting procedures
- Alarm management protocols
- ENC update verification
- Passage planning standards
- Watch handover checks
Internal audits should focus more closely on actual ECDIS operational practices, including alarm settings, ENC management and safety contour logic.
Enhance type-specific familiarisation
Differences between ECDIS manufacturers and presentation libraries remain a source of confusion and require more robust familiarisation practices.
Integrate ECDIS competence into SMS risk management
ECDIS competency should become part of navigational risk assessment frameworks and not remain isolated within training departments alone.
Final thoughts
The NorthStandard ETA report sends an important message to the industry: ECDIS competency gaps remain widespread despite years of mandatory implementation.
The issue is no longer whether bridge teams can operate ECDIS systems mechanically.
The challenge is whether they fully understand how those systems behave under operational conditions, how to interpret their limitations and how to manage navigational risk when automation fails or becomes misleading.
As vessels increasingly depend on integrated digital navigation systems, strengthening operational ECDIS competence may become one of the most important loss prevention priorities for the maritime industry over the coming years.
Links :
Sunday, May 31, 2026
Birth of a rainbow
第一次看到彩虹的诞生,这个摄影师好厉害。 pic.twitter.com/2F9JZEiGLn— Gavinly (@Fengyi1811) May 29, 2026
Subscribe to:
Posts (Atom)