Saturday, June 9, 2012

A virtual first look at unexplored seafloor : Farallon islands

Take a virtual ride over topography that would be right at home in a national park — except it's at the bottom of the ocean.
A new mapping tool has given scientists a first glimpse of the seafloor in an area off the coast of northern California. (Credit: NOAA)

A new mapping tool has given scientists a first glimpse of an area of the seafloor just west of the San Francisco Bay and, thanks to a new animation, ordinary people can take a ride over the newfound and dramatic topography.

Approaching the Farallones
>>> geolocalization with the Marine GeoGarage <<<

The newly mapped ocean floor lies within the Gulf of the Farallones National Marine Sanctuary, a protected area that spans 1,279 square miles (3,312 square kilometers) of the Pacific Ocean just northwest of San Francisco.

Thanks to a sonar mapping tool, scientists with the National Oceanic and Atmospheric Administration recently got a look at some unexplored areas of the sanctuary.
A video using data gleaned from sonar reveals dramatic ravines and canyons that plunge 4,000 feet (1,219 meters) into the deep ocean.

Virtual fly-through of San Francisco Bay revealing the seafloor as if the water was drained from the Bay.
The movie flies through the south and central Bay, pausing over prominent seafloor features including, large sand waves, rock pinnacles, current scour pits, as well as many human impacts on the seafloor. (source USGS)

These dramatic cliffs and two other areas are garnering some of the most attention from scientists. These seafloor regions have been well mapped for the first time, and may prove to be home to a host of valuable ocean species.
"These are the first highly detailed images of these areas in our sanctuary," Jan Roletto, sanctuary research coordinator, said in a statement.
"This area has promising potential as habitat for deep-sea corals and sponges."

Storms and cold weather left the air over the Bay Area clearer than usual, allowing the Farallon Islands to be seen on the horizon over the Golden Gate Bridge, with Alcatraz Island in the foreground.
Soon-to-be setting sn to the lower-left, accounting for semi-sihouette of foreground elements. 

Scientists are planning to revisit these areas in October 2012 to take even better measurements and better understand what creatures live there.
They plan to use a deep-diving robot to explore the depths.

Some of the sanctuary's most famous residents don't require deep-diving robots to get a good look. Great white sharks crowd the waters around the Farallon Islands, a smattering of tiny, steep mountains that rise from the sea about 25 miles (40 km) west of San Francisco's Golden Gate Bridge.

Links :


Friday, June 8, 2012

Celebrate World Oceans Day !

World Oceans Day is being celebrated by millions of people all over the globe.
 Be a part of the movement to protect our oceans!


On World Oceans Day, let’s first check out the importance of water:

About 70 percent of the Earth’s surface is water-covered, and the oceans hold about 96.5 percent of all Earth’s water.
Water also exists in the air as water vapor, in rivers and lakes, in icecaps and glaciers, in the ground as soil moisture and in aquifers, and even in you and your dog.


Water is never sitting still, though, and thanks to the water cycle, our planet’s water supply is constantly moving from one place to another and from one form to another.
Things would get pretty stale without the water cycle!

Oceans cover 71% of the planet and are the source of life on Earth.
Over a billion people, including some of the poorest in the world, depend on the oceans and wild seafood for survival.
But our blue planet is under threat.
Each day we remove more than the oceans can replenish.
We are draining our oceans of life and protein for a hungry planet.
The good news is that our oceans are astoundingly resilient.
Contrary to popular belief, the sea is not ungoverned.
Ten countries control most of the world's wild seafood catch.
Oceana has won critical policy victories in many of these countries, protecting more than a million square miles of ocean.
We can turn things around if we focus on three goals: ending overfishing, controlling bycatch and protecting our ocean nurseries.

Now let’s check out the importance of our oceans:

The Ocean Is Earth’s Life Support
  • 50 to 70 percent of the oxygen we breathe comes from the ocean. That’s more than every one of the world’s rainforests combined.
  • The ocean is the #1 source of protein for more than a billion people. Sea life provides one fifth of the average person’s animal protein intake.
  • The ocean regulates our climate, absorbs carbon dioxide, holds 97% of Earth’s water, and supports the greatest abundance of life on our planet.
But The Ocean Is In Trouble
  • 90% of the big fish are gone. Tuna, swordfish, halibut, cod, and flounder populations have been devastated by overfishing. Many of the fish caught today never even have the chance to reproduce.
  • The average size of the remaining big fish has been cut in half or less in the last 50 years. The average weight of a swordfish caught today is 90 lbs., down from 266 lbs. in 1960.
  • Discarded plastic bags and other trash have formed a toxic “plastic soup” that is gathering in five massive ocean gyres around the world. As the plastic breaks down, it is eaten by sea animals, birds, and fish, causing illness and death. It eventually enters our diets, too.
  • Our oceans account for 71% of the planet, but less than 2% of our oceans are protected. We have protections in place for nearly 12% of all land (through areas like national parks).

11x World champion surfer, Kelly Slater, and The Nature Conservancy are working to save our oceans
So there you have it – now go celebrate our beautiful oceans and make a pledge today to do all you can to protect them!


Links :
  • HuffingtonPost : If the Sea Was a Child: In Honor of World Oceans Day

Thursday, June 7, 2012

Canada CHS update in the Marine GeoGarage


19 charts have been updated (May 27, 2012) and 102 has been withdrawn :

    • 1234    CAP DE LA TETE AU CHIEN TO CAP AUX OIES
    • 1310    PORT DE MONTREAL
    • 1312    LAC SAINT-PIERRE
    • 1313    BATISCAN TO LAC SAINT-PIERRE
    • 1314    DONNACONA TO BATISCAN
    • 1431    CANAL DE BEAUHARNOIS - LAC SAINT-LOUIS TO SAINT FRANCOIS
    • 1432    LAC SAINT-FRANCOIS/LAKE ST.FRANCIS B-C
    • 2023A    PETERBOROUGH TO LAKEFIELD
    • 2023B    LAKEFIELD TO BURLEIGH FALLS
    • 2023C    STONY LAKE
    • 2202A    PORT SEVERN TO TOMAHAWK ISLAND
    • 2202B    TOMAHAWK ISLAND TO TWELVE MILE BAY
    • 2202C    TWELVE MILE BAY TO ROSE ISLAND
    • 2202D    SOUTH CHANNEL AMANDA ISLAND TO PARRY SOUND
    • 2202E    MOON ISLAND AND SURROUNDING AREAS
    • 2204A    BYNG INLET TO KILLARNEY
    • 2204B    BYNG INLET TO KILLARNEY
    • 2204C    BYNG INLET TO KILLARNEY
    • 2204D    BEAVERSTONE BAY TO KILLARNEY
    • 3526    HOWE SOUND
    • 4003    CAPE BRETON TO CAPE COD
    • 4012    YARMOUTH TO HALIFAX
    • 4098    SABLE ISLAND / ILE DE SABLE
    • 4099    SABLE ISLAND / ILE DE SABLE - WESTERN PORTION
    • 4233    CAPE CANSO TO COUNTRY ISLAND
    • 4234    COUNTRY ISLAND TO BARREN ISLAND
    • 4845    RENEWS HARBOUR TO MOTION BAY
    • 4956    CAP-AUX-MEULES

    So 688 charts (1659 including sub-charts) are available in the Canada CHS layer. (see coverage)

    Note : don't forget to visit 'Notices to Mariners' published monthly and available from the Canadian Coast Guard both online or through a free hardcopy subscription service.
    This essential publication provides the latest information on changes to the aids to navigation system, as well as updates from CHS regarding CHS charts and publications.
    See also written Notices to Shipping and Navarea warnings : NOTSHIP

    Venus transit offers opportunity to study planet's atmosphere

    It won't happen again until December 2117.
    On June 5th, 2012, Venus transited the face of the sun in an event of both historical and observational importance
    The Venus Transit 2012 has come and gone but the Solar Dynamics Observatory has left us with memories that will last a lifetime.

    From CSMonitor

    The planet Venus made a slow transit across the face of the sun on Tuesday, the last such passing that will be visible from Earth for 105 years.

     Transits of Venus happen in pairs, eight years apart, with more than a century between cycles.
    During Tuesday's pass, Venus took the form of a small black dot slowly shifting across the northern hemisphere of the sun.

    Launched on Feb. 11, 2010, the Solar Dynamics Observatory, or SDO, is the most advanced spacecraft ever designed to study the sun.
    During its five-year mission, it will examine the sun's atmosphere, magnetic field and also provide a better understanding of the role the sun plays in Earth's atmospheric chemistry and climate.  SDO provides images with resolution 8 times better than high-definition television and returns more than a terabyte of data each day.
    On June 5 2012, SDO collected images of the rarest predictable solar event--the transit of Venus across the face of the sun. 
    This event happens in pairs eight years apart that are separated from each other by 105 or 121 years. 
    The last transit was in 2004 and the next will not happen until 2117.

    Armchair astronomers watched the six-hour and 40-minute transit on the Internet, with dozens of websites offering live video from around the world.
    Closeup views from the Prescott Observatory in Arizona, fed into Slooh.com's webcast, showed a small solar flaring in the making just beneath Venus' sphere.

    This movie shows the transit of Venus on 5-6 June 2012 as seen from SWAP, a Belgian solar imager onboard ESA's PROBA2 microsatellite.
    SWAP, watching the Sun in EUV light, observes Venus as a small, black circle, obscuring the EUV light emitted from the solar outer atmosphere - the corona - from 19:45UT onwards.
    At 22:16UT - Venus started its transit of the solar disk
    The bright dots all over the image ('snow storm') are energetic particles hitting the SWAP detector when PROBA2 crosses the South Atlantic Anomaly, a region where the protection of the Earth magnetic field against space radiation is known to be weaker.
    Note also the small flaring activity in the bright active region in the northern solar hemisphere as Venus passes over.

    Towards the end, you can see a big dim inverted-U-shape moving away from the Sun towards the bottom-right corner.
    This is a coronal mass ejection taking off.

    Tuesday's transit, completing a 2004-2012 pair, began at 6:09 p.m. EDT (2209 GMT).


    Skywatchers on seven continents, including Antarctica, were able to see all or part of the transit. Even astronauts aboard the International Space Station joined in the spectacle.
    "I've been planning this for a while," space station flight engineer Don Pettit said in a NASA interview. "I knew the transit of Venus would occur during my rotation, so I brought a solar filter with me."

    Venus transits the face of the Sun as it rises over the Mediterranean in Malta

    It's not all about pretty pictures.

    Several science experiments were planned, including studies that could help in the search for habitable planets beyond Earth.
    Telescopes, such as NASA's Kepler space telescope, are being used to find so-called extrasolar planets that pass in front of their parent stars, much like Venus passing by the sun.

    During the transit of Venus, astronomers planned to measure the planet's thick atmosphere in the hope of developing techniques to measure atmospheres around other planets.
    Studies of the atmosphere of Venus could also shed light on why Earth and Venus, which are almost exactly the same size and orbit approximately the same distance from the sun, are so different.
    Venus has a chokingly dense atmosphere, 100 times thicker than Earth's, that is mostly carbon dioxide, a greenhouse gas.
    Its surface temperature is a lead-melting 900 degrees Fahrenheit (480 degrees Celsius) and towering clouds of sulfuric acid jet around the planet at 220 miles per hour dousing it with acid rain.

    "Venus is known as the goddess of love, but it's not the type of relationship you'd want," an astronomer said on the Slooh.com webcast.
    "This is a look-but-don't-touch kind of relationship."

    Scientists are interested in learning more about Venus' climate in hopes of understanding changes in Earth's atmosphere.
    During previous transits of Venus, scientists were able to figure out the size of the solar system and the distance between the sun and the planets.

    Tuesday's transit is only the eighth since the invention of the telescope, and the last until December 10-11, 2117.
    It also is the first to take place with a spacecraft at Venus.

    Observations from Europe's Venus Express probe will be compared with those made by several ground and space-based telescopes, including NASA's Solar Dynamics Observatory, the joint U.S.-European Solar and Heliospheric Observatory and Japan's Hinode spacecrafthttp://solar-b.nao.ac.jp/index_e.shtml.

    Links :
    • NASA : Venus transit 2012
    • Fotopedia : images of the Venus transit

    Wednesday, June 6, 2012

    If seas are to survive, we need a New Deal for the Oceans

    Ocean of Life: How Our Seas Are Changing is published by Allen Lane

    From TheGuardian

    Callum Roberts is a marine biologist, writer and conservationist.
    His career has taken him round the world to study the planet's reefs, shoals and seabeds and his latest book, Ocean of Life, provides a detailed analysis of the woes that now beset these places: from plastic pollution to oil slicks; from melting icecaps to rising levels of acid waters; and from disintegrating coral reefs to spreading blooms of toxic algae.
    Yet Roberts maintains that we can still save our beleaguered seas.
       
    The picture that you paint of our oceans is very bleak. Is there any hope?
    I think there is. We have this enormous challenge, I admit that.
    The oceans are changing faster than at any time in human history, indeed for millions of years into the past.
    But I think we can deal with those changes if we act carefully and quickly.

    OK, so first outline the damage.
    There are three main strands of destruction going on now.
    The first concerns the rate at which we are removing life from the oceans.
    Consider British waters.
    In 1938, the UK fishing fleet landed more than five times more fish than we do now.
    Yet trawlers today bristle with hi-tech gear such as echo-locators and scanners.
    We cannot match past rates of catches because we have taken so many fish from the oceans.
    Our fish stocks are heading for collapse while our dredgers are churning up the seabed, turning complex marine habitats into monotonous expanses of shifting gravel, sand and mud.
    The second strand is pollution.
    We are poisoning the seas in myriad different ways.
    Some of them involve chemicals such as DDT and brominated flame retardants.
    These are used on land, but get washed off by streams and rivers into the seas.
    The oceans are the ultimate sinks and normally these toxins would settle on the seabed, but because we are dredging up ocean floors systematically the toxins get mixed back into the water.
    As a result, many forms of sea-life – from seabirds to whales – have been found with high levels of toxins in their tissue.
    The rising level of carbon dioxide in seawater is making it more acidic and more difficult for molluscs to form shells.
    Then there is habitat destruction.
    We are ripping up mangroves, marshland and beaches to make way for hotels, resorts and ports.
    And on top of all those, there is the issue of climate change.
    As icecaps melt, cold freshwaters pour from Greenland and the Antarctic and threaten to disrupt currents, including the Gulf Stream, which keeps Britain warm.

    Not much to be cheerful about…
    No. It is a grim picture, particularly as there will be up to 11 billion human beings on the planet by the end of the century.
    That means we end up trying to intensify our fishing even further to provide as much food as possible.

     Callum Roberts: 'We can deal with these changes if we act carefully and quickly.'

    So what can we do?
    There are measures we can take, though we have to realise that things will get worse before they get better and will involve a radical overhaul of the way we steward the seas.
    First, we need to curtail fishing to about a half of the current level and, for good measure, ban all fishing below depths of half a mile.
    The deeper you go, fish take longer to grow and reproduce so that it takes longer to recover from depletion down there.
    We also need to phase out the most destructive fishing gear including equipment that is used to dredge the sea floor for scallops and other bottom-dwelling species.
    Expanding marine reserves is crucial.
    We need them to cover about a third of the oceans and prohibit any exploitation of sea life within their boundaries.
    This will give species places to recover, particularly in zones where the effects of global warming are likely to be more pronounced.
    We have recently seen new reserves set up at Hol Chan in Belize, Cabo Pulmo in Mexico and Sea Park in the Bahamas.
    We just need to expand the system.

    And the stuff we dump in the seas?
    We need to cut down and control more effectively toxins such as flame retardants that are ending up in the seas.
    We also need to look at more commonplace forms of rubbish – plastic bags and bin liners get swept into rivers and seas and end up choking seabirds and turtles.
    Controlling the way we dispose of supermarket packaging and the like is a simple business, but it would have a really beneficial impact on the marine environment.
    We need to control the amounts of fertilisers and nutrients we put on our fields, which also get swept into the rivers and the seas, triggering the growth of toxic blooms of algae.
    Finally, we need to protect our coastal zones, with their mangrove swamps and fragile banks of sands.
    The crucial point is that none of these measures involves major political upheavals but they will have enormous consequences.
    What we are talking about is the setting up of a New Deal for the Oceans.

    Links :
    • TheGuardian : Sea creatures and ocean vistas: the watery world under threat - in pictures
    • CSMonitor : The Ocean of life
    • WSJ : Fathoming the Ocean's Future
    • DailyBest : ‘The Ocean of Life’—And the Sorrow Beneath the Sea
    • TheEconomist : An ocean of troubles

    Tuesday, June 5, 2012

    Warns of the effects of shipping emission policy on the world economy

    Animation comprised of a NO2 map placed on top of a shipping route map to show the routes clearly correspond to the pattern of detected NO2 (source : ESA)

    From Lloyd's List

    HELLENIC Chamber of Shipping president George Gratsos has urged regulators to pause to consider research that warns that reduction of sulphur content in bunkers may exacerbate global warming.


    “Presently enacted regulations represent inadvertent geo-engineering increasing our planet’s temperature,” said Mr Gratsos.
    “Governments should carefully study the repercussions of their regulations before they inflict irreversible damage to society with inappropriate legislation,” he said in a keynote speech to the Mare Forum Blue Shipping Summit in Athens.
    “Our society has developed substantial analytical capabilities to help guide us.”

    Mr Gratsos in particular cited a new study by researchers from the UK Met Office that examined aerosols and climate variability in the North Atlantic (see Nature).
    Published last month, the paper “clearly indicates that the reduction in sulphur aerosols over the Atlantic Ocean have increased water temperature, increasing the severity of hurricane activity and Sahel and Amazon droughts”, according to Mr Gratsos.
    The effects had “variously influenced the whole planet”, he said.

     Ship tracks off British Columbia (source : NASA)

    Reducing the sulphur content of bunker fuels outside SECAs would worsen the problem, Mr Gratsos warned.
    Shipping has been pointing out side effects of lower sulphur policy to regulators for some time, Mr Gratsos acknowledged, but “to no avail”.
    A familiar industry argument is that higher cost of 0.1% distillate, the limit for ECAs, compared to heavy fuel oil may cause a modal shift from ships to trucks that will see CO2 emissions from transport multiply.


    Mr Gratsos also said that the IMO had enacted the regulation reducing sulphur content despite research into the cooling effects of ship emissions of sulphur dioxide.
    However, he told Lloyd’s List, the recent Met Office research “is a game changer, or at least it should be”.
    The Met Office describes itself as “a world leader in providing weather and climate services”.
    Mr Gratsos also warned of the effects of shipping emission policy on the world economy.
    Market-based mechanisms, which in effect would add the price of carbon to fuel prices, could significantly increase the cost of freight, slowing or even reversing globalisation, he said.
    Since the average loaded trading speed of bulk carriers in 2012 appeared to be 20% lower than five years ago, this had reduced ship emissions by 50%, Mr Gratsos said.

    Links :
    • DailyMail : How 16 ships create as much pollution as all the cars in the world
    • TheGuardian : Health risks of shipping pollution have been 'underestimated'
    • EPA :  Diesel pollution from the shipping industry
    • BBC : Health risks of shipping pollution have been 'underestimated'

    Monday, June 4, 2012

    DHN Brazil update in the Marine GeoGarage


    14 charts have been added and 14 have been updated 
    (DHN update 18/21 May, 2012)

    • 303 DO CABO MAGUARI À MOSQUEIRO
    • 315 DA BOCA DA VIGIA À MOSQUEIRO
    • 410 PROXIMIDADES DA BAÍA DE SÃO MARCOS
    • 1002 BARRA DO RIO SÃO FRANCISCO DO NORTE
    • 1101 PROXIMIDADES DO PORTO DE SALVADOR
    • 1103 BAÍA DE ARATU E ADJACÊNCIAS
    • 1107 BAIA DE TODOS OS SANTOS PARTE OESTE
    • 1110 BAÍA DE TODOS OS SANTOS
    • 1402 DO PONTAL DA REGÊNCIA À PONTA DO UBU
    • 1404 PROXIMIDADES DA PONTA DO UBU
    • 1531 ILHA DO BOQUEIRÃO E ADJACÊNCIA
    • 1607 BAÍAS DA ILHA GRANDE E DE SEPETIBA
    • 1637 BAÍA DA RIBEIRA
    • 1904 CANAL SUL DE SANTA CATARINA
    • 21020 DE SALINOPOLIS A FORTALEZA
    • 23100 DO RIO DE JANEIRO À SANTOS
    • 3335 DO RIACHO GUAICURUS À ILHA SANTA MARIA
    • 3336 DA ILHA SANTA MARIA A PORTO MURTINHO
    • 3338 DO CUÑATAY A ILHA FECHO DOS MORROS
    • 3339 DA ILHA CAMBA A ILHA JOSE RIKA
    • 3340 DO PORTO GUARANI À VOLTA DO JENIPAPO
    • 3341 DA BAÍA DA SUCURI AO PASSO OLIMPO
    • 3430 DO PASSO BAÍA DAS ÉGUAS À MONTANTE DO PASSO CORIXÃO
    • 3431 DA ILHA DA BAIAZINHA À ILHA DO BEIÇUDO
    • 3432 DO PASSO DO BEIÇUDO AO BARRANCO VERMELHO
    • 3433 DO PASSO DO SOLDADO À FIGUEIRA DO TUCUM
    • 3434 DA ILHA DO POTE AO PASSO CAMBARÁ
    • 3435 DA ILHA DO JAURU VELHO À BAÍA GRANDE

    Today 320 charts (367 including sub-charts) from DHN are displayed in the Marine GeoGarage

    NOAA : New Alaska navigational chart makes increased Arctic shipping safer

    chart 16161 Kotzebue harbour and approaches on the Marine GeoGarage

    From NOAA

    NOAA formally presented to Alaska officials a new nautical chart for Kotzebue Sound in the Alaskan Arctic, a sparsely charted region that is seeing increased vessel traffic because of the significant loss of summer sea ice.

    The new chart depicts the full range of depth measurements and object detection acquired during a full ocean bottom survey last summer by the NOAA hydrographic survey ship Fairweather.
    It replaces a chart showing depth measurements last taken in the 19th century spaced three to five miles apart, leaving room for possible undetected dangers in between.

     Kotzebue Harbor chart replaces measurements last taken in 19th century
    The new navigational chart 16161 addresses a pressing need for this Northwest Alaska transportation hub, located in the Arctic Circle.
    Most importantly, the improved navigational information will help mariners protect life and property, on board ship and in the coastal waters of Kotzebue.
    (source : NOAA)

    The new navigational chart addresses a pressing need for this Northwest Alaska transportation hub, located in the Arctic Circle.
    Barge shipments and large transport ships must be anchored at least 14 miles out in the Kotzebue Sound due to shallow waters and inadequate charts and navigational aids.
    Freight must then be transferred by smaller barges to Kotzebue.

    “This new chart is just one of the many critical navigational services that NOAA provides to support safe navigation and maritime commerce while protecting important marine resources,” said Kathryn D. Sullivan, Ph.D., deputy NOAA administrator and assistant secretary of commerce for environmental observation and prediction.
    “Based on stakeholder discussions and developing Arctic vessel traffic patterns, NOAA will improve the existing charts and navigational data to position the regional maritime economy to meet emerging opportunities, as we expand our commerce and energy sectors into the Arctic region.”
    Sullivan presented the chart to Alaska Lt. Governor Mead Treadwell during NOAA’s Hydrographic Services Review Panel meeting in Anchorage.

    NOAA Ship Fairweather worked around the clock while acquiring Kotzebue data
    during the summer of 2011.

    Using millions of precise depth measurements gathered by Fairweather last summer, the new chart will give mariners a much better – and safer – map. Fairweather’s hydrographic surveys of critical areas of the sound will improve safety and efficiency of freight transfer operations.
    “With the reduction in Arctic ice coverage, we are starting to see growing shipping traffic in the Arctic, and this growth is driving an increase in maritime concerns,” said NOAA Corps Capt. David Neander, who was the commanding officer of the NOAA Ship Fairweather during the survey. “Starting in 2010, we began surveying in critical Arctic areas where marine transportation dynamics are changing rapidly. These areas are increasingly transited by the offshore oil and gas industry, cruise liners, military craft, tugs and barges and fishing vessels.”

    The new chart, number 16161, depicts measured ocean depths at a scale of 1:50,000. An inset for Kotzebue Harbor will have even more detail, with a scale of 1:25,000.
    Mariners had been using a chart with a 1:700,000 scale, mostly depicting water depths measured in the 1800s, before technology was able to acquire data with today's level of precision and accuracy, and before today’s increased shipping necessitated updating of these navigational surveys.
    “With the new chart, mariners who are unfamiliar with the region will have more information and can make better decisions when they approach Kotzebue,” said Capt. Doug Baird, chief of NOAA Coast Survey’s marine chart division.
    “The chart has accurate and precise depth measurements, which will make ocean-going vessel traffic more efficient through northwest Alaska. Most importantly, the improved navigational information will help mariners protect life and property, on board ship and in the coastal waters of Kotzebue.”

    The charts were made available to the public on May 11, as an online Print on Demand chart through OceanGrafix.

    About one third of U.S. Arctic waters are important to navigation, based on water depth, the draft of ships transiting the region, and the potential for unknown hazards or dangers to navigation.
    NOAA’s Office of Coast Survey has identified 38,000 squares miles as its surveying priority and estimates it will take more than 25 years to complete updated charts for this area.

    NOAA’s Office of Coast Survey is the nation’s chartmaker.
    Continuing a heritage of service to the maritime transportation system, Coast Survey has been America’s trusted source of navigational charts, data, and services for two centuries.
    NOAA Ship Fairweather is part of the NOAA fleet of ships and aircraft operated, managed and maintained by NOAA's Office of Marine and Aviation Operations, which includes commissioned officers of the NOAA Corps and civilian wage mariners.
    NOAA’s mission is to understand and predict changes in the Earth's environment, from the depths of the ocean to the surface of the sun, and to conserve and manage our coastal and marine resources. Join NOAA on Facebook, Twitter and our other social media channels.

    The NOAA nautical charts layer is back


    4 days after our electrical outage, the NOAA layer is available again in the Marine GeoGarage


    Compact Doppler Velocity Log (DVL) : a new navigation capability for racing sailing boats

    Nortek DVL installed in keel (photo courtesy of PUMA Ocean Racing Team)

    Nortek announced that it has collaborated with the PUMA Ocean Racing team to develop a modified compact Doppler Velocity Log (DVL) for PUMA’s Mar Mostro Volvo Open 70 yacht competing in the Volvo Ocean Race 2011-2012.
    The project, which was completed over the course of the past year, has resulted in the successful integration of boat speed, leeway and in-situ ocean current readings.
    Translation: a secret weapon in the battle to go as fast and efficiently as possible.

    From Nortek

    “The collaboration between Nortek and the entire PUMA team has resulted in an tool that provides unique information to the sailing crew.
    They can now measure leeway, a first in sailing, and use it to measure ocean currents much more precisely than ever before,” said Atle Lohrmann, CTO of Nortek.

    Nortek started developing this capability during the 2008 Star class Olympic trials with the Norwegian team skippered by Eivind Melleby, also a veteran of the Volvo Ocean Race.
    Nortek went on to work with the TP52 ocean racing team Caixa Galicia with a predecessor to the existing sensor with Caixa navigator Robert Hopkins.
    “This is the biggest advancement in sailing instrumentation since the invention of the GPS,” said Hopkins, who runs performance testing for PUMA and worked with Nortek on the project.
    “Nortek adapted their new DVL technology to our sailing performance needs, to measure very high speeds along the boat's track and very low speeds across it. With Nortek's history of deploying instruments on buoys in hostile Arctic conditions, we knew that we could trust the Nortek DVL in a race around the world.”


    Leeway is the sideways skidding angle a boat makes as it sails forward.
    Leeway can be changed on a Volvo Open 70 yacht by adjusting the daggerboard immersion and canting the keel.
    The adjustable daggeboards and keel act like wings underwater to counteract the force of the sails. The crew relies on Nortek DVL leeway measurements to optimize PUMA's Mar Mostro performance at all times, providing the core data upon which every other performance measurement is based.

    “I can't tell you how important it is to finally know how fast the boat is going in all conditions. We really feel this is the first time boat speed has been accurately measured without using various types of cumbersome and complex tables within the boat’s instrumentation. It’s a huge factor for something as simple as a sail change or as complex as routing,” said Ken Read, skipper of the PUMA Ocean Racing team.
    “Nortek and our entire team, especially the shore crew, worked diligently to make this project a reality. The technology already helped us to win the Transatlantic Race in July, and it will be a key component as we race around the world.”

    The Nortek DVL uses acoustic techniques to measure water velocity along each of the four beams.
    The sensor is mounted in the bottom of the lead bulb of the keel.
    The acoustic beams are oriented forward, aft and abeam.
    Data from each beam is streamed to the on board computer which also receives data from the inertial motion sensor and the keel cant angle sensor.
    Velocity and orientation measurements are then used to output true forward boat speed and leeway. Real time currents can be directly estimated by differencing the GPS boat speed over ground and the boat speed through the water.

    Two step procedure to estimate currents in real time;
    (a) First estimate the through the water velocity -- resultant of forward speed, leeway, and heading; (b) followed by differencing with the through the water boat speed and GPS estimate (speed and course over the ground).

    Similar systems were developed for the seismic survey fleet and Nortek recently delivered the first operational navigation system to Fugro-Geoteam in Oslo to be mounted on two Barovane seismic diverters.
    The diverters keep the towed acoustic streamers separated and like the Puma-DVL, the system measures the angle of attack, the through water speed and ocean currents near the surface.
    The difference was the space available for the acoustic transponder.

    The image shows the track of Mar Mostro (yellow) as it transits westwards to Alicante. 
    The red lines indicate the real time currents estimated with the DVL. 
    This is overlaid on top of current estimates from a four day average of satellite altimetery data.

    “We worked very hard to miniaturize the DVL unit that was installed aboard PUMA’s Mar Mostro,” stated Lohrmann.

    The project is an important milestone for Nortek because it demonstrates how well the acoustic Doppler technology performs in very challenging conditions and that the system can be fully integrated into modern navigation systems.
    The fact that the PUMA Ocean Racing technology team was able to integrate the DVL with other sensors on the boat is a testament to the quality and sophistication of modern yacht racing.


    Sunday, June 3, 2012

    From steel beams to American icon: Golden Gate Bridge celebrates 75 years as an engineering masterpiece


    The orange hue of the Golden Gate Bridge was an accident of history.
    San Francisco owes the iconic color of its bridge to Irving Morrow, the consulting architect, who noticed the striking reddish-orange hue of the primer coat, and lobbied to have it made permanent.


    From DailyMail


    It was built as the country was emerging from the Great Depression, and grew into an icon of America.
    It was also heralded as an engineering marvel when it opened in 1937.
    It was the world's longest suspension span and had been built across a strait that critics said was too treacherous to be bridged.
    But as the iconic Golden Gate Bridge approaches its 75th anniversary over Memorial Day weekend, the generations of engineers who have overseen it all these years say keeping it up and open has been something of a marvel unto itself.


    Dream becomes reality: The idea for a bridge across the Golden Gate strait, where San Francisco Bay meets the Pacific Ocean, was championed by the engineer Joseph Strauss in the 1920s
    Dream becomes reality: The idea for a bridge across the Golden Gate strait, where San Francisco Bay meets the Pacific Ocean, was championed by the engineer Joseph Strauss in the 1920s
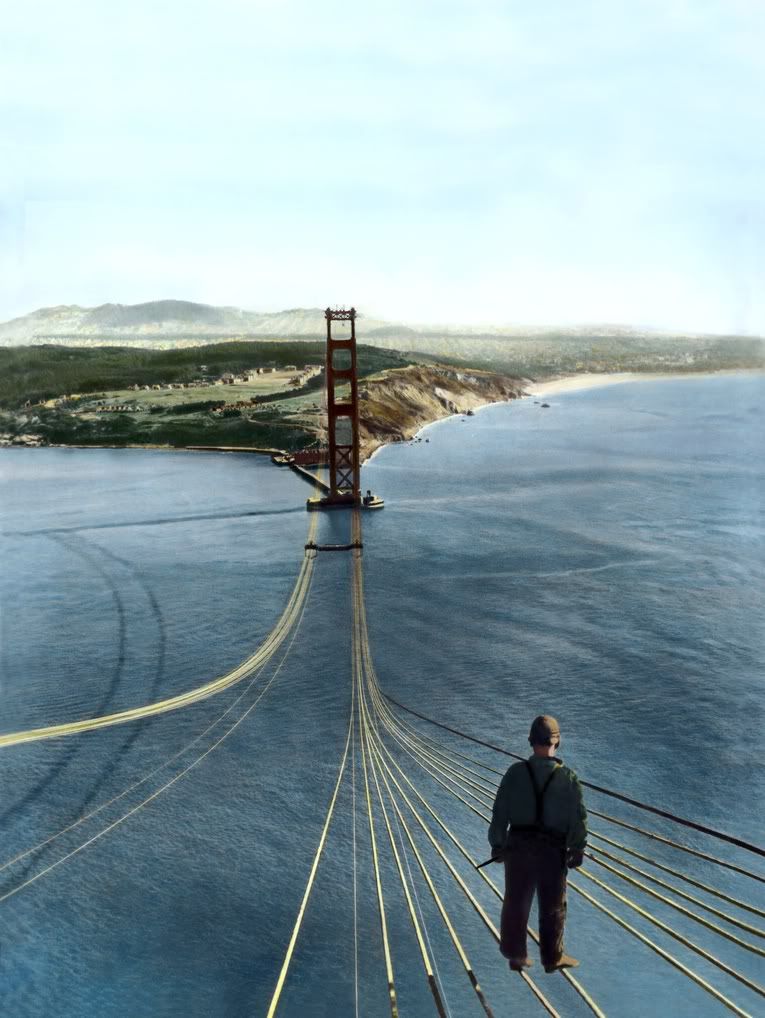
    Under construction: The bridge was completed in 1937 and became the largest suspension bridge ever built; workers, right, carried heavy iron beams in 1936


    Such great heights: Painter Don Dulac, the oldest on the painting crew, scales dizzying heights top of the North Tower, paint brush in hand
    Such great heights: Painter Don Dulac, the oldest on the painting crew, scales dizzying heights top of the North Tower, paint brush in hand
    Crews had to install a bracing system after high winds lashed and twisted the span in the 1950s, raising fears it would collapse.
    Years later, they had to replace vertical cables when they were found to have corroded in the bridge's damp, foggy climate, potentially destabilizing the span.
    The bridge, which rises majestically above a Civil War-era fort on the San Francisco side and arches across to the Marin County headlands on the north side, is currently in the midst of a seismic upgrade that has seen many of its key structures replaced or modified. 
    Plans for a moveable barrier to separate north and southbound traffic and a net system to prevent suicides are also moving forward.

    'When (one of the bridge's designers) made his final speech during opening day ceremonies in 1937, he said, `I present to you a bridge that will last forever,'' said Daniel Mohn, the bridge's former chief engineer, who co-authored a book about the span.
    'What he should have said is, `I present to you a bridge that will last forever if properly maintained.'
    The idea for a bridge across the Golden Gate strait, where San Francisco Bay meets the Pacific Ocean, was championed by the engineer Joseph Strauss in the 1920s.


    Engineering marvel: On completion, the steel bridge was the longest suspension bridge main span in the world and cost approximately $35 million
    Engineering marvel: On completion, the steel bridge was the longest suspension bridge main span in the world and cost approximately $35 million


    Darker side: With a drop of 245 feet to the water below, the bridge has become the biggest suicide site in the world
    Darker side: With a drop of 245 feet to the water below, the bridge has become the biggest suicide site in the world


    Slowly but surely: By 1935, construction was well underway and workers began to lay further foundation to the bridge's towers
    Slowly but surely: By 1935, construction was well underway and workers began to lay further foundation to the bridge's towers


    Impossible dream: The bridge had to be light enough to hang from its own cables, but still strong enough to withstand the strait's fierce winds and the possibility of earthquakes - some said it was impossible
    Impossible dream: The bridge had to be light enough to hang from its own cables, but still strong enough to withstand the strait's fierce winds and the possibility of earthquakes - some said it was impossible

    Incredible feat: The tourist attraction was the world's longest suspension span at the time, built across a strait that critics said was too treacherous to be bridged


    Strauss's original design, submitted to San Francisco city officials in 1921, called for a hybrid cantilever-suspension bridge.
    The idea for a full-suspension span - the design that was ultimately built - came later.


    At a little more than three-fourths of a mile in length, the Golden Gate Bridge would become the world's longest suspension span.
    It had to be light enough to hang from its own cables, but still strong enough to withstand the strait's fierce winds and the possibility of earthquakes. Some said it was impossible.
    Engineers also had to calculate all the potential forces on the bridge without the help of computers.
    'In those days, you had (notebooks) and a number two pencil and you wrote it out, did all the math at your desk,' said Kevin Starr, a history professor at the University of Southern California, who has also written about the bridge.
    Eleven men died during construction from 1933 to 1937 - ten of them when scaffolding fell through a safety net that had been set up to protect workers.
    The conditions were difficult, cold, foggy and windy, and workers who helped construct supports for the south tower had to contend with dangerous tides.
    Looking on: A young family gazed out into the bay looking at the nearly-completed bridge; it opened to the public on May 27, 1937
    Looking on: A young family gazed out into the bay looking at the nearly-completed bridge; it opened to the public on May 27, 1937


    But it was the wind that would continue to vex engineers years after the bridge's completion.
    In 1951, it was closed for several hours when wind gusts approached 70 mph and caused the bridge to flutter.
    It was twisting so badly, Mr Mohn recalled during a recent phone interview, that the light standards at the centre of the span were striking the main cables.
    'It sure almost destroyed the Golden Gate Bridge,' he said.
    The Tacoma Narrows Bridge in Washington - a suspension bridge whose designer also worked on the Golden Gate - had twisted and snapped in about 40 mph winds a little more than a decade earlier. That 1940 collapse was captured on film.
    Although the Golden Gate Bridge had stiffening trusses that made it less susceptible to wind, it did sustain damage, Mr Mohn said.
    Officials decided to add lateral bracing that made the trusses more stable and reduced the chances of the bridge going into a potentially catastrophic twisting motion.


    In the mists: The top towers of the bridge peek out from clouds and mist, with the signature red paint offering a stark contrast to the white fog
    In the mists: The top towers of the bridge peek out from clouds and mist, with the signature red paint offering a stark contrast to the white fog


    Nestled in: An August moon appears to rest on the top of the south tower of the Golden Gate Bridge, with the city's iconic skyline as background
    Nestled in: An August moon appears to rest on the top of the south tower of the Golden Gate Bridge, with the city's iconic skyline as background


    Anticipation: On Sunday, May 27, 2012 it will be 75 years since the famous red bridge was opened, linking the northern point of the San Francisco peninsula to Marin County across the opening of the San Francisco bay
    Anticipation: On Sunday, May 27, 2012 it will be 75 years since the famous red bridge was opened, linking the northern point of the San Francisco peninsula to Marin County across the opening of the San Francisco bay

    The bridge would be able to withstand winds of 70 mph today although the goal is to eventually increase its tolerance to 100 mph, according to Ewa Bauer, the bridge's current chief engineer.
    The wind is not the only element to take its toll on the span. The damp, foggy air has also kept its painters and engineers busy.
    'You couldn't have put the bridge in a more corrosive atmosphere than in the middle of the Golden Gate with that salt fog coming in,' Mr Mohn said.
    Engineers discovered in the 1970s that the bridge's suspender ropes - the vertical cables that connect the deck to the main cables - had corroded, some so badly that they could be picked apart with a pocket knife.
    The problem in part, Mr Mohn said, was that bridge maintenance had been neglected for many years, particularly during World War II. A design flaw also hastened corrosion.
    All of the cables were replaced in the mid-1970s.
    There was another scare on the bridge during its 50th anniversary in 1987 when an estimated 300,000 pedestrians gathered on the span, which was closed to vehicle traffic.
    The weight of the crowd flattened out the arch of the bridge deck and caused some revelers to suffer motion sickness as the bridge swayed.
    Although the bridge supported its heaviest load in 50 years that day, Mohn would later conclude the weight and movement had not exceeded its design capacity.
    Today, among the engineers' most pressing concerns is the potential effect of a major earthquake.


    Expansive: A seagull flies near past the 1.7-mile bridge on May 24
    Expansive: A seagull flies near past the 1.7-mile bridge on May 24

    The 1989 Loma Prieta earthquake, which occurred during a live broadcast of the World Series, caused two 50-foot sections of the San Francisco-Oakland Bay Bridge to collapse.
    The Golden Gate Bridge was not damaged.
    But the quake still spurred bridge officials to undertake a massive retrofit of the span - a $660 million project that began in 1997 and is still underway.
    Bridge pylons have been reinforced with steel and towers under the bridge's two approaches were replaced, all while keeping the bridge open and its appearance unchanged.
    Retrofitting the suspension span is the project's final phase although experts say its flexibility makes it less vulnerable in an earthquake.
    'If I knew when an earthquake was coming, I'd get to the suspension span of the Bay Bridge or the Golden Gate Bridge,' said Abolhassan Astaneh-Asl, an engineering professor at the University of California, Berkeley who studied the Golden Gate Bridge after Loma Prieta.
    'They are safest places to be.'
    The goal is to withstand an 8.1-magnitude earthquake when the retrofit is completed years from now.
    The bridge, like other infrastructure, has a lifespan.
    But Bauer and Mohn say with proper maintenance, the Golden Gate Bridge will endure.
    The retrofit project alone will buy the span another 150 years, Bauer estimated.
    'I believe the bridge was built to absolute great standards of workmanship,' she said on a recent morning at a vista point overlooking the span.
    'What we are doing right now is repairing...and you can truly do it indefinitely.'