Featured on National Geographic. "A lone freediver escapes to another world underwater where his impossible dreams become reality." "The Superman" is a labour of love project for directors Jack Pirie and Alex Hylands-White, made in collaboration with Freediver Francisco Del Rosario and Bamford Watch Department.
The short film follows Del Rosario, who lives on the remote island of El Hierro in the Canary Islands.
Thomas Karl and colleagues were harassed by Republicans for publishing inconvenient science. A new study proves them right.
A new study has shown that a 2015 NOAA paper finding that the Earth is warming more rapidly than previously thought was correct.
Once again, science is shown to work.
The laborious process in which
scientists check and recheck their work and subject their ideas to peer
review has led to another success.
An independent test of global warming
data has confirmed a groundbreaking 2015 study that showed warming was
faster than prior estimates.
Because of its inconvenient findings, the study’s lead author Thomas Karl was subjected to harassment by Lamar Smith (R-TX),
chair of the House Science Committee, in an effort to impugn his
credibility.
But now Karl and his co-authors have been vindicated.
Let’s
take a step back and discuss the science.
Measuring the temperature of
the Earth is hard.
There are many locations to measure and many choices
to make.
Should we measure the temperature of the ground? Of the ocean
waters? How deep in the water? If we measure air temperatures, what
height should the measurements be taken? How many locations should we
make measurements at? What happens if the instruments change over time
or if the location changes? What happens if a city grows near a
measurement location and the so-called urban heat-island effect grows?
How do we estimate the temperatures in areas where no measurements
exist?
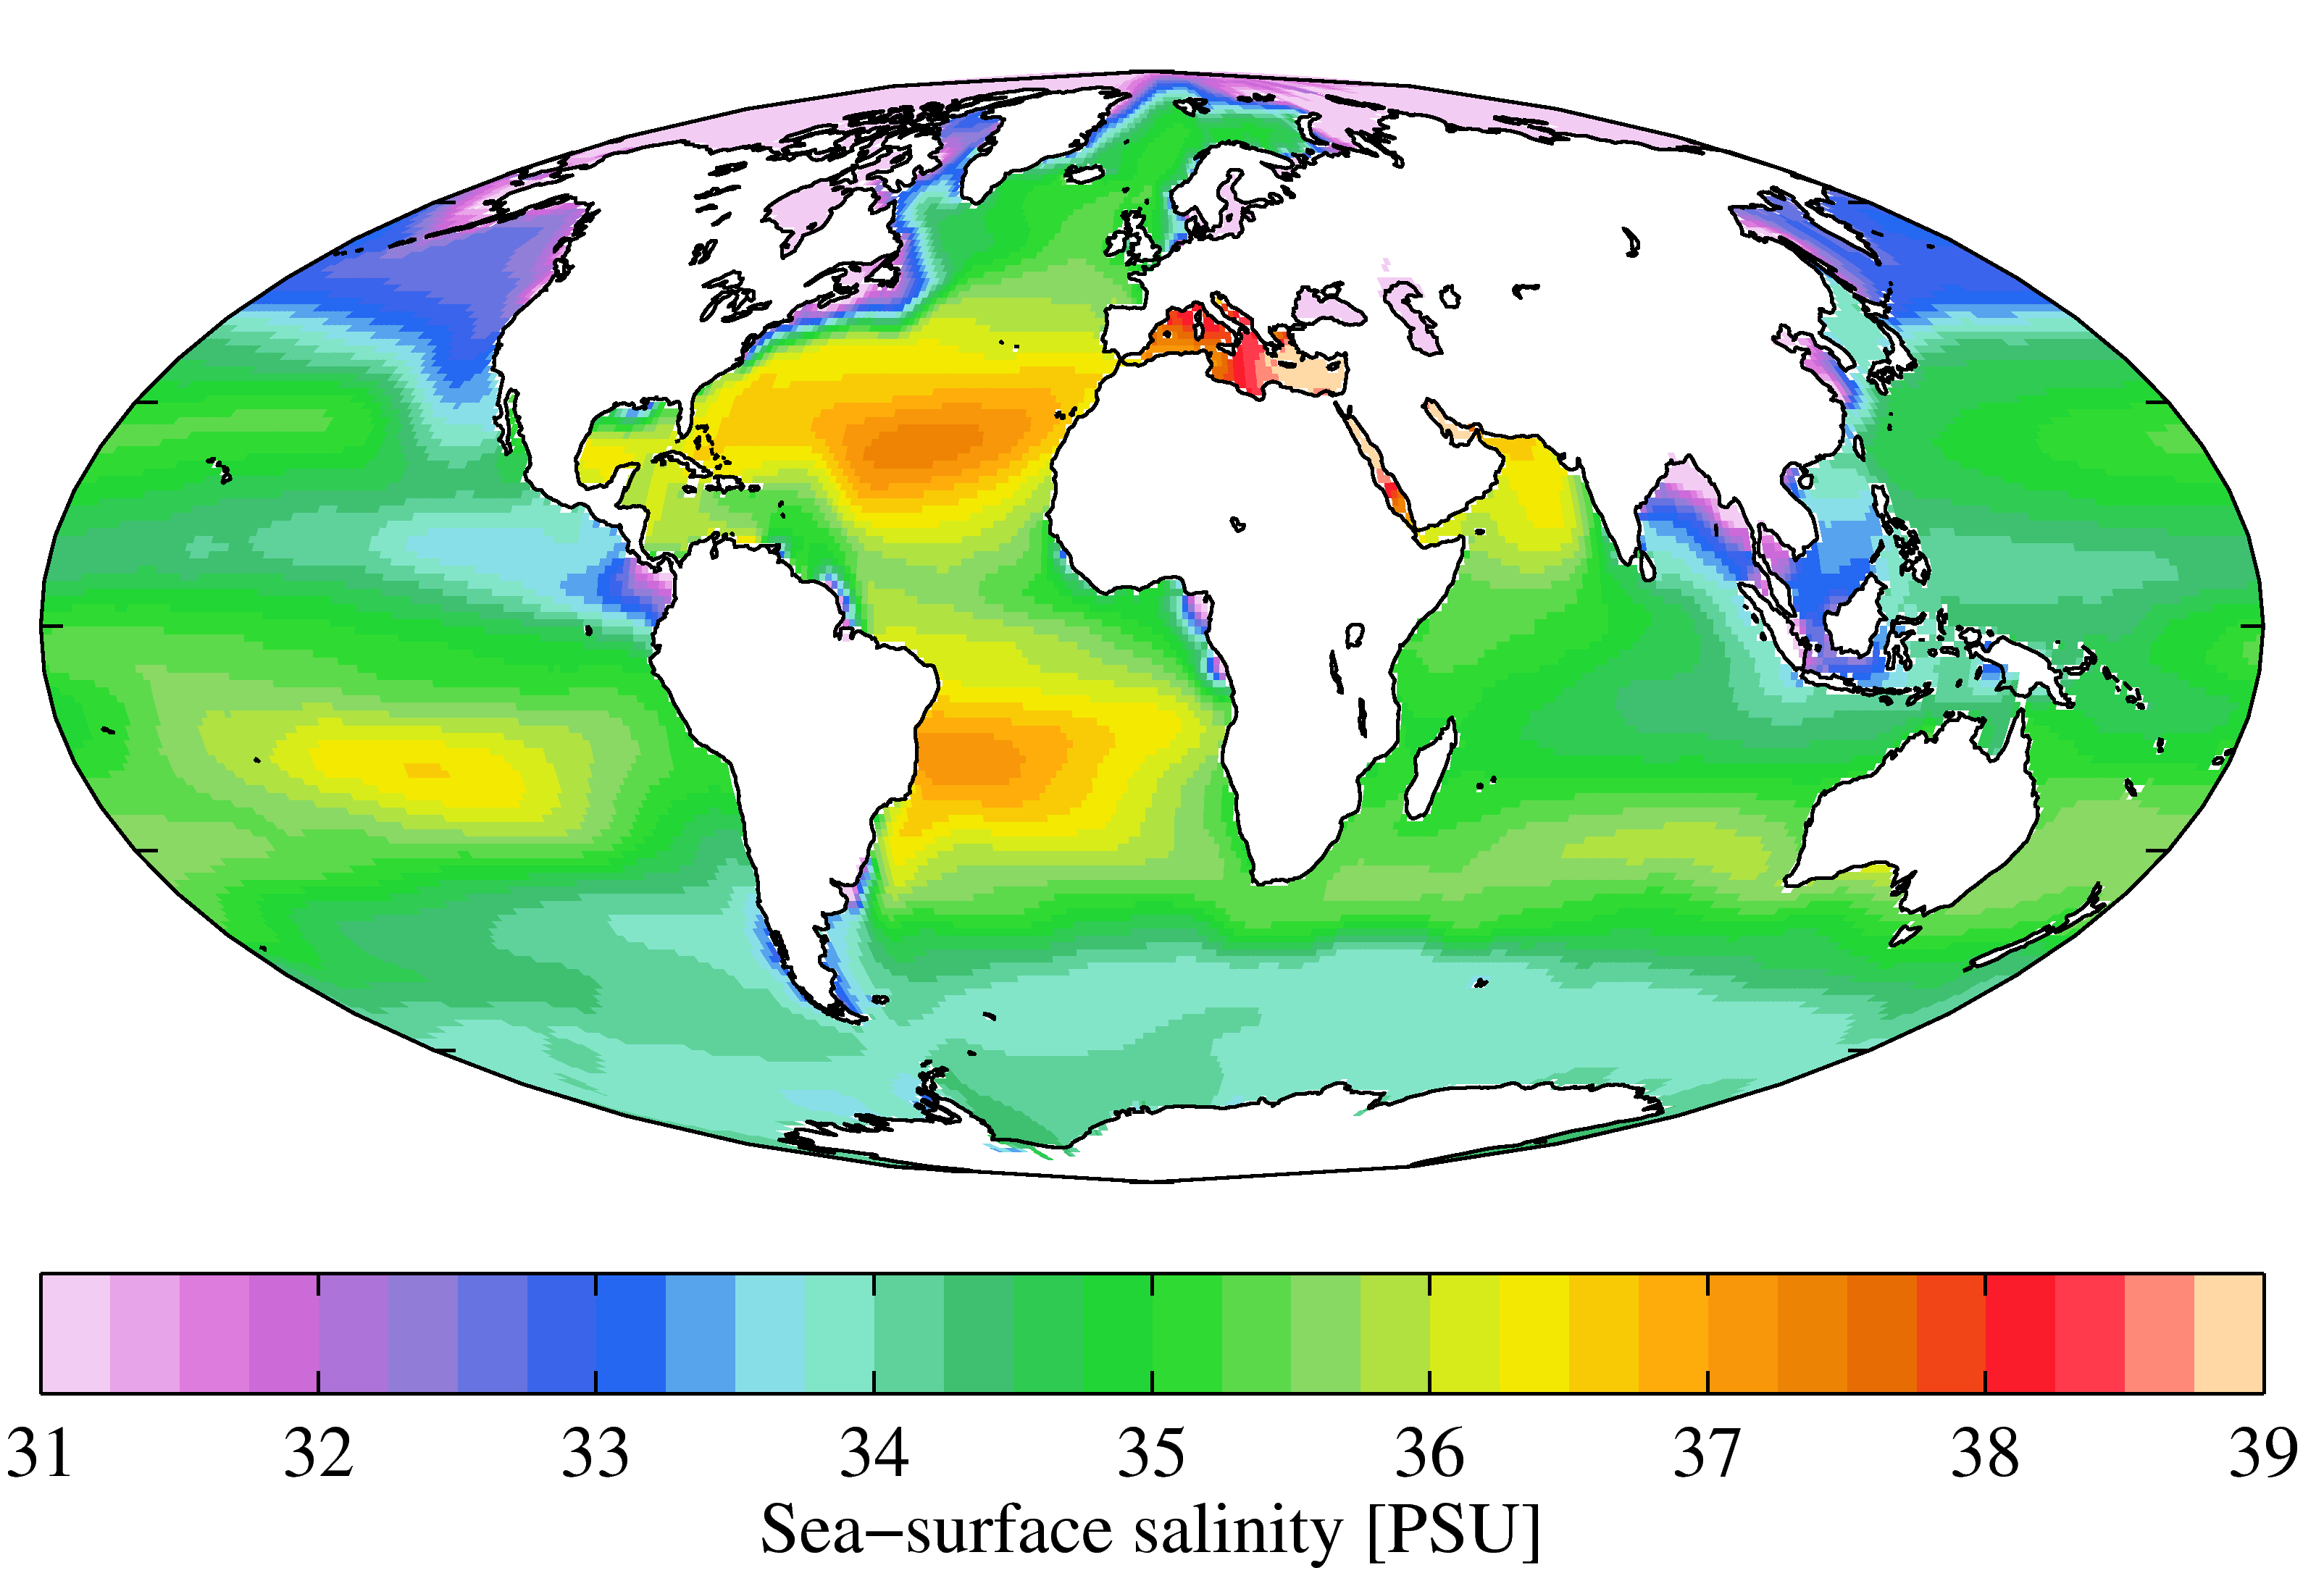
Climate Change: Global Temperature Data
These and many other questions make measuring global warming
challenge.
Different groups of scientists make different decisions so
that depending on the institution, they will get a slightly different
temperature result.
But this diversity is also a good thing.
It turns out that it doesn’t
matter whose results you use – NASA, NOAA, The Hadley Centre in the UK,
the Japanese Meteorological Agency, or the Berkeley Earth group – they
all report a warming world.
However, the rates are slightly different.
So, one persistent question is, which group is most accurate? Whose
methods are best?
The new study looks into just this question.
The group focused on
perhaps the biggest differences among the groups – how they handle ocean
temperatures.
Specifically, global temperature values typically use a
combination of near-surface air temperatures in land regions and sea
surface temperatures in ocean regions.
Since oceans cover approximately
70% of our planet, the way ocean temperatures are dealt with can
separate the warming rates between these groups.
Ocean temperatures can be measured by ship-based temperature sensors,
by special floating measuring instruments, or by satellites.
Prior to
the advent of satellites and floating sensors, ships were the main
temperature sensing platforms.
Ship sensors, which measure engine intake
water, are known to be slightly warmer than the actual water.
So using
them introduces a warm bias in the measurements.
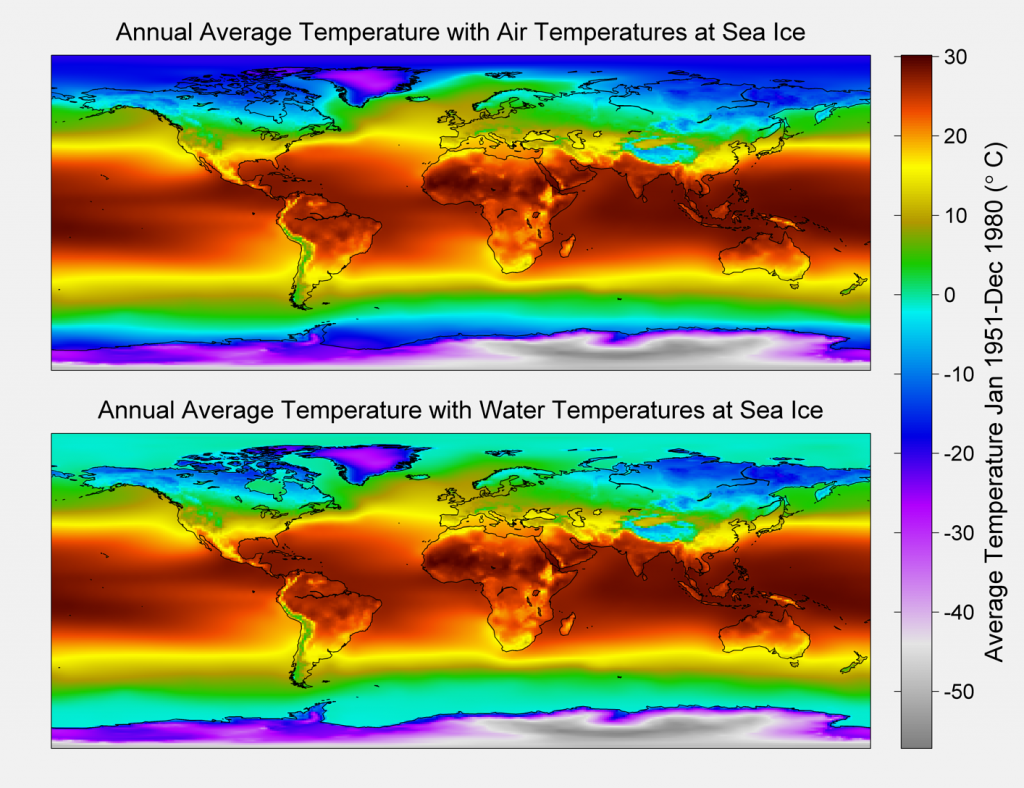
Annual Average Global Temperatures.
Both panels are calculated using a 1951-80 periodand represent the average Global Temperature index in degrees C.
At the poles where ice cover varies over the record we provide two cases.
For the baseline case the air temperature over iceis used for the average and in the alternative case in the bottom panel Sea Temperature under the ice cover is used. -1.8 C is used for this value in all cases
Also, as ships have gotten larger, the depth of the engine intakes
have increased – meaning the tested water was further from the actual
ocean surface.
Since the temperature results from buoys differs from
ship measurements, the various scientific groups have tended to try to
perform corrections between the different sensors.
The way the
correction is done affects the reported warming rate.
The authors recognized that one of the biggest questions is how to
stitch together different temperature results from different sensors.
Therefore, they broke the temperature data up into groups according to
the measurement device (buoys, satellites, ARGO floats, ships, etc.) and
they evaluated warming rates separately for each group.
The authors
also used advanced statistics to handle areas where no data were
recorded.
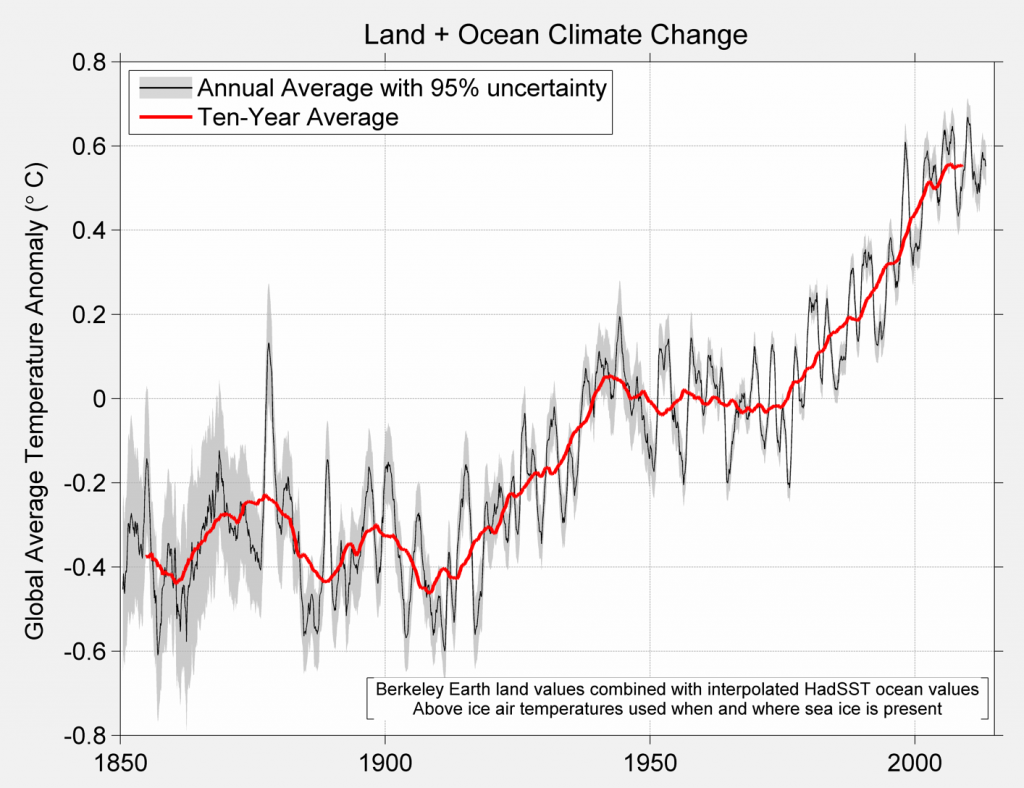
Berkeley Earth Global Temperature index, 1850 to present
After applying their tests, the authors found that the results
promoted by Karl at NOAA are the best, and other groups, in particular
the Hadley Centre in the UK and the Japanese agency, are too cold.
So what does this all mean? A few things.
First, this study is a nice
reminder that the proper way for science to work is for publications to
be scrutinized and checked by others.
This process leads the entire
scientific community to a deeper understanding of the science.
Second, this validates the scientists who were originally attacked by
political non-scientists and in some cases by contrarian scientists.
For instance, Judith Curry, a well-known critic of mainstream climate
science was quoted as saying:
The new NOAA dataset disagrees with a UK dataset, which is generally regarded as the gold standard for global sea surface temperature datasets … The new dataset also disagrees with ARGO buoys and satellite analyses ...
Color me unconvinced.
I actually study ocean temperatures so I knew this statement by
Judith Curry was complete nonsense.
It is nice to see a team actually
take the time to prove it.
Perhaps she and others will finally admit
they were wrong.
This paper is another reminder why it is so important to invest in
the temperature measurements that are needed to create long-term climate
records.
We really need uninterrupted measurements that span many
years/decades if we want to truly understand the Earth’s changing
climate.
Even though the costs of making these measurements are very
small compared to what we spend on other less important activities, I am
concerned that the new US administration will decide to pull the plug
on these projects.
If that happens, we will be flying blind.
Finally, and for those who read my posts regularly, I am sounding
like a broken record.
Global warming is happening, it never stopped, it
never paused, and the models have gotten it right.
It reminds me of a debate between creationists and scientists.
One
scientist whose name I cannot remember stated, “we have the fossil
record, we win.” Well, a similar quote works here.
“We have the data, we
win.” Now let’s move on to solving the problem.
The oceans are mostly composed of warm salty water near the surface over cold, less salty water in the ocean depths. These two regions don't mix except in certain special areas.
The ocean currents, the movement of the ocean in the surface layer, are driven primarily by the wind. In certain areas near the polar oceans, the colder surface water also gets saltier due to evaporation or sea ice formation.
In these regions, the surface water becomes dense enough to sink to the ocean depths.
This pumping of surface water into the deep ocean forces the deep water to move horizontally until it can find an area on the world where it can rise back to the surface and close the current loop.
This usually occurs in the equatorial ocean, mostly in the Pacific and Indian Oceans.
This very large, slow current is called the thermohaline circulation because it is caused by temperature and salinity (haline) variations. source : NASA
Intense future climate change could have a far different impact on
the world than current models predict, suggests a thought-provoking new study
just out in the journal Science Advances.
If atmospheric carbon dioxide
concentrations were to double in the future, it finds, a major ocean
current — one that helps regulate climate and weather patterns all over
the world — could collapse.
And that could paint a very different
picture of the future than what we’ve assumed so far.
The Atlantic meridional overturning circulation, or AMOC, is often described asa
large oceanic conveyor belt.
It’s a system of water currents that
transports warm water northward from the Atlantic toward the Arctic,
contributing to the mild climate conditions found in places like Western
Europe.
In the Northern Atlantic, the northward flowing surface water
eventually cools and sinks down toward the bottom of the ocean, and
another current brings that cooler water back down south again.
A slowdown or even collapse of the Gulf Stream System as a result of global warming has long been a concern of climate scientists and has fuelled the imagination of Hollywood.
Regular direct observations of this giant ocean current system do not go back far enough to tell whether there is any long-term trend.
However, in recent years indirect evidence is mounting for a remarkable slowdown over the 20th Century.
The
whole process is part of a much larger system of overturning currents
that circulates all over the world, from pole to pole.
But some
scientists have begun to worry that the AMOC isn’t accurately
represented in current climate models.
They say that many models portray
the current as being more stable than real-life observations suggest it
actually is.
Recent studies have suggested that the AMOC is weakening,
although there’s some scientific debate about how much of this has been caused by human activities and how much by natural variations.
Nevertheless,
the authors of the new study point out, many climate models assume a
fairly stable AMOC — and that could be affecting the predictions they
make for how the ocean will change under future climate change.
And
because overturning circulation patterns have such a significant effect
on climate and weather all over the world, this could have big
implications for all kinds of other climate-related projections as well.
“This is a very common and well-known issue in climate models,” said the new study’s lead author, Wei Liu,
a postdoctoral associate at Yale University, who conducted the work
while at the University of California at San Diego.
“I wanted to see, if
I use a corrected model, how this will affect the future climate
change.”
Liu and colleagues from the UC-San Diego and the University of
Wisconsin at Madison took a commonly used climate model and corrected
for what they considered to bethe AMOC stability bias.
Then they ran an experiment to see how the correction would affect the
model’s projections under future climate change.
They instantaneously
doubled the atmospheric carbon dioxide concentration from present-day
levels in both the corrected and uncorrected models, and then they let
both models run for hundreds of simulated years.
The differences
were striking.
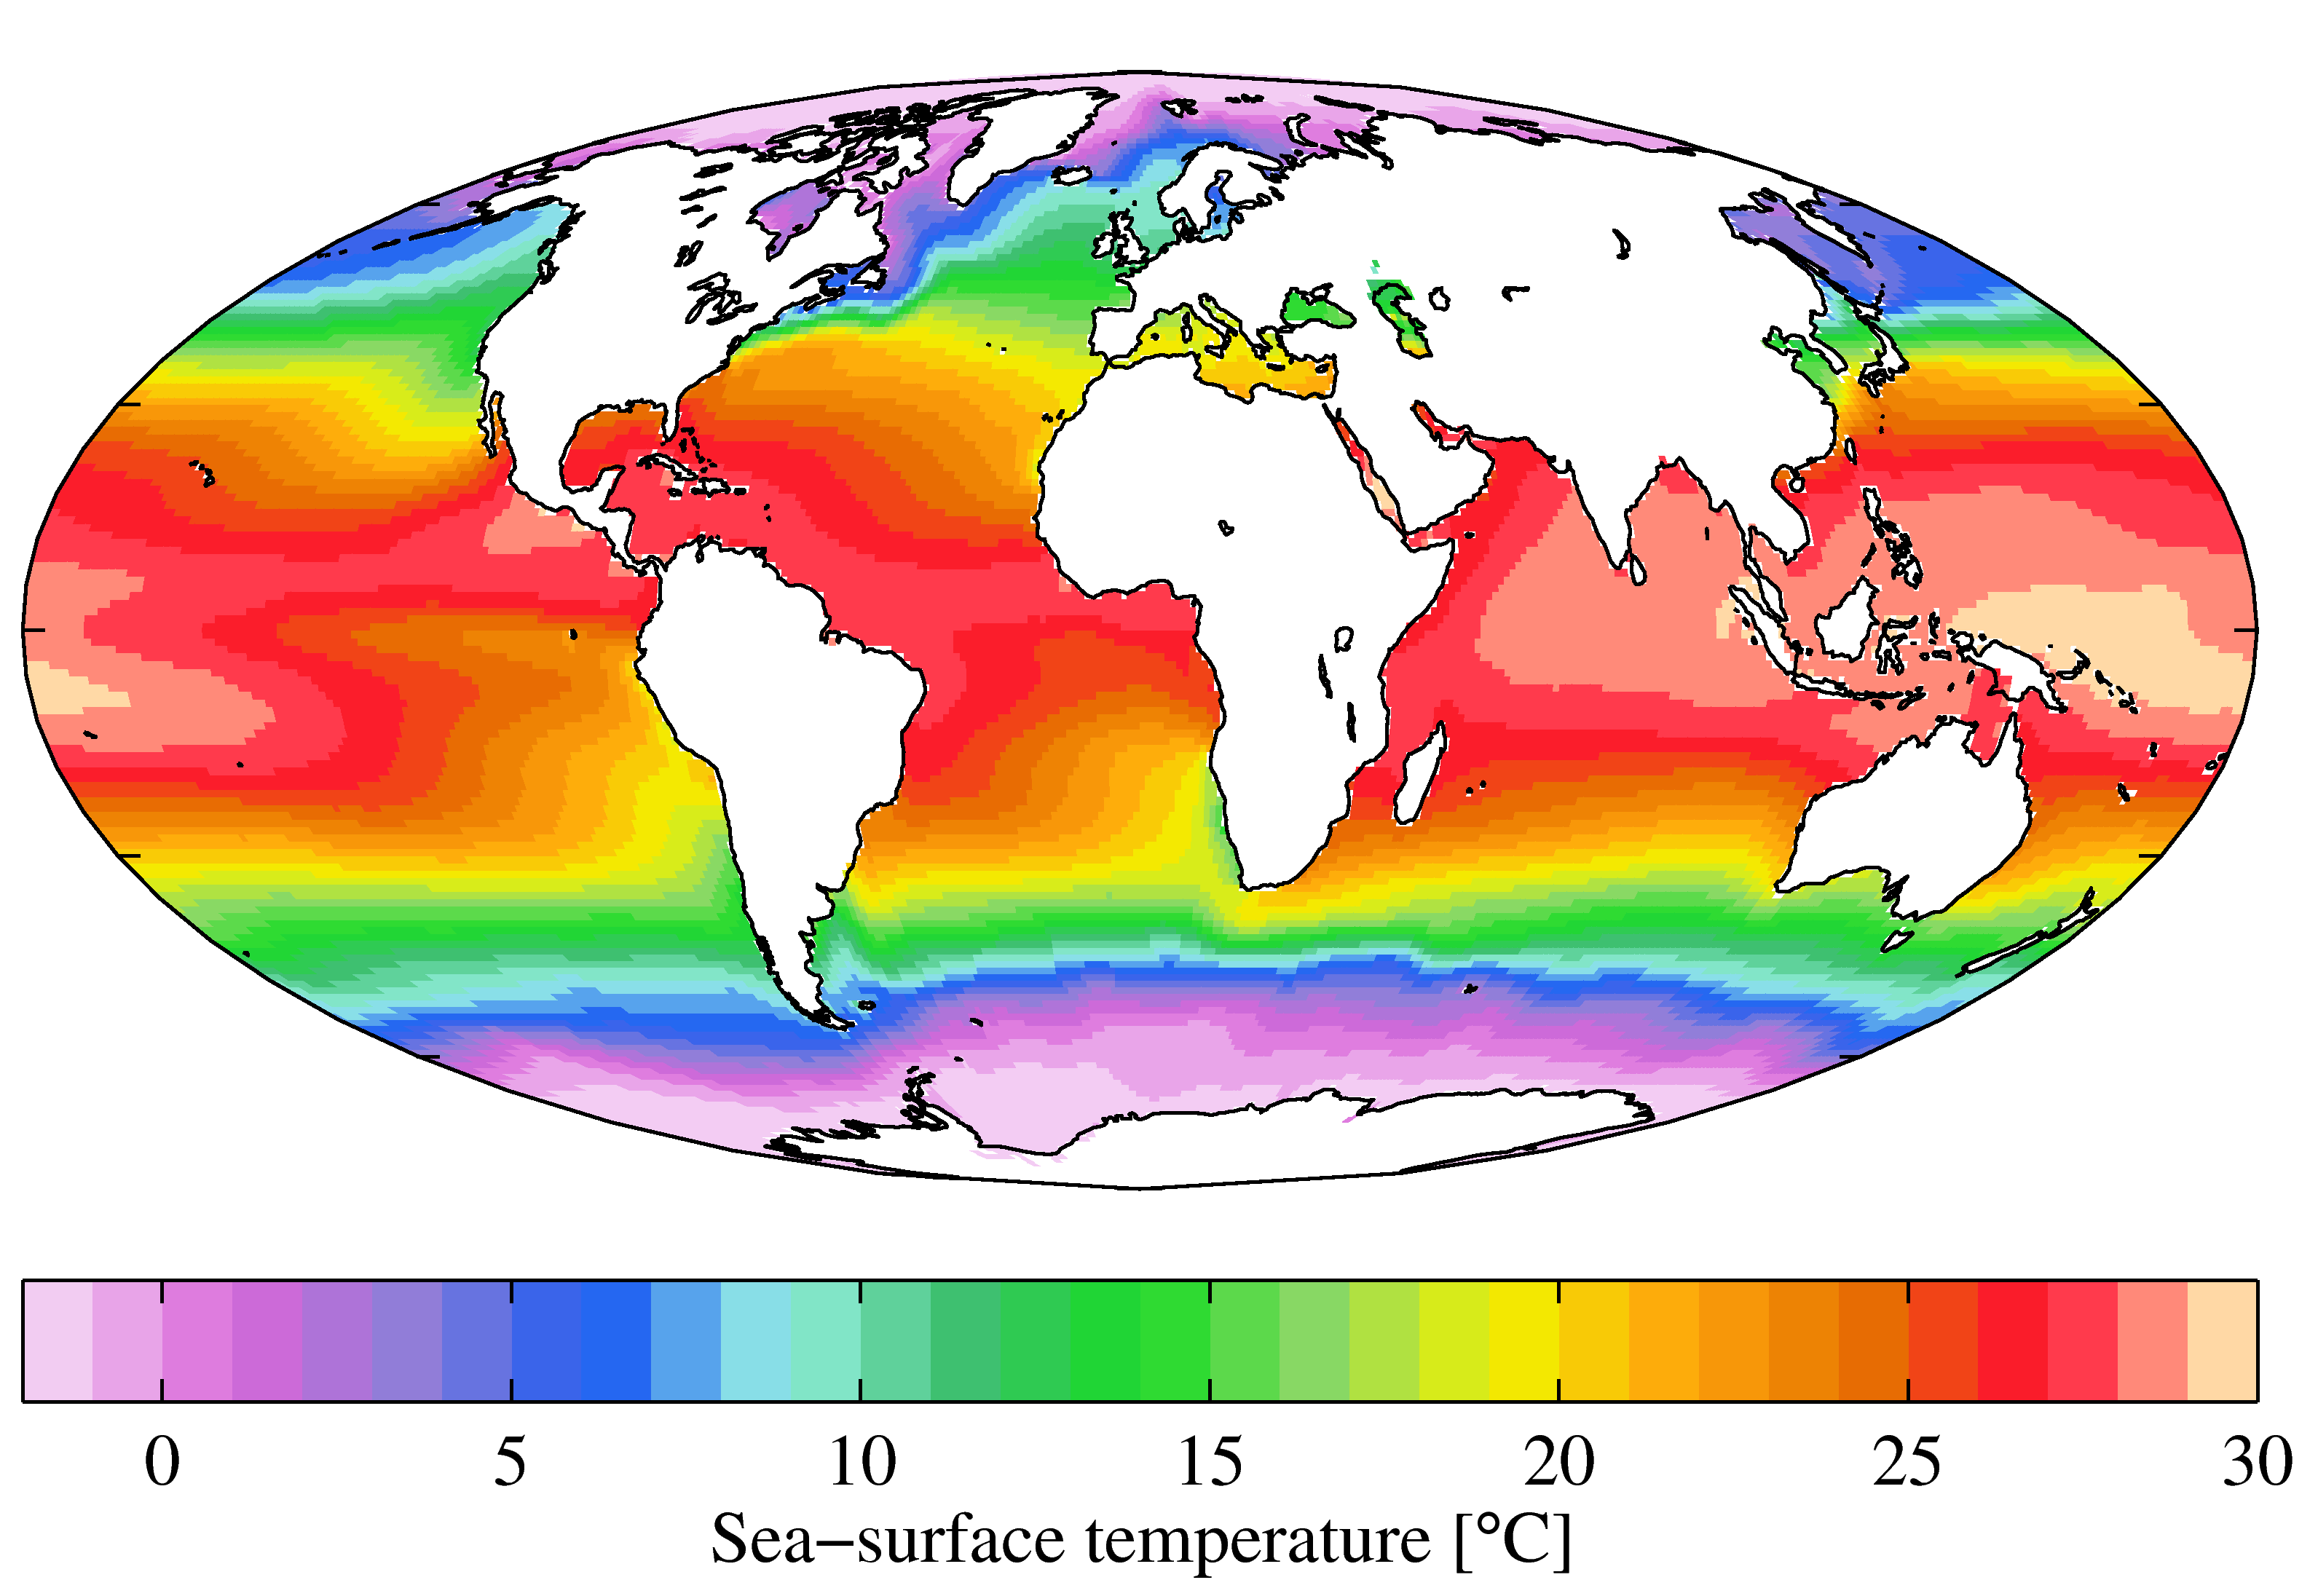
This visualization composites Ocean Surface Flows over Sea Surface Temperature data from the Estimating the Circulation and Climate of the Ocean, Phase II project, depicting Earth's ocean circulation model that involves heat transfer.
In the uncorrected climate model, the AMOC weakens for a
while, but eventually recovers.
In the corrected model, however, the
AMOC continues to weaken and after 300 years, it collapses altogether.
In a commentary
also published today in RealClimate, Stefan Rahmstorf, an oceans
physics expert at the Potsdam Institute for Climate Impact Research,
explained how such a collapse could occur when the AMOC gets too weak.
“Freshwater
continually flows into the northern Atlantic through precipitation,
rivers and ice-melting,” he wrote.
“But supply of salty waters from the
south, through the Gulf Stream System, balances this.
If however the
current slows, there is less salt supply, and the surface ocean gets
less salty.”
Because freshwater is less dense than salty water,
this process can lead to a kind of stratification, in which the lighter
freshwater gets stuck on the surface of the ocean and can’t sink to the
bottom when it reaches the cooler north.
When this happens, the
overturning process that drives the current back down south again can’t
occur.
“There is a critical point when this becomes an
unstoppable vicious circle,” Rahmstorf wrote.
“This is one of the
classic tipping points in the climate system.”
The resulting
climate consequences, compared to the uncorrected model, are also
dramatic.
Without the usual transport of warm water into the north, the
corrected model predicts a marked cooling over the northern Atlantic,
including in the United Kingdom, Iceland and northwestern Europe, as
well as in the Arctic, where sea ice begins to expand.
Because the AMOC is part of a larger global conveyor system, which
ferries warm and cold currents between the equator and both poles, the
model predicts disruptions in other parts of the world as well.
Without
cold water moving back down south again, the corrected model indicates a
stronger warming pattern south of the equator than what’s predicted by
the uncorrected model, causing a polarization in precipitation patterns
over the Americas — more rain for places like northeastern Brazil and
less rain for Central America.
The model also predicts a greater
reduction in sea ice for the Antarctic.
This visualization shows Ocean Surface Current Analysis Real-time (OSCAR) ocean currents colored by current velocities.
OSCAR data (produced by Earth & Space Research and distributed through NOAA and PO.DAAC) is derived from observed satellite altimetry and wind vector data. OSCAR data is shown from January 1, 2008 through July 27, 2012.
Blues are slow currents, greens currents are about 0.5 meters per second, and red currents are about 1 meter per second.
All this doesn’t
necessarily mean that everything we thought we knew about the future
climate is wrong.
For one thing, most modern climate projections focus
on the next few decades or so, noted Thomas Haine,
an expert on ocean circulation at Johns Hopkins University.
And within
50 years or so, both the uncorrected and corrected models in the new
study produce similar results.
It is only after that, under extreme
warming, that the current shifts.
Liu also cautioned that certain
aspects of the experiment can’t exactly be considered realistic — for
instance, instantaneously doubling the atmospheric carbon dioxide
concentration.
Current climate efforts are aimed at keeping us from ever
getting to such a point — but even if we did, the process would happen
gradually, not overnight.
So the model’s outcome might have been
different if the researchers had adopted a more realistic scenario.
Haine
also suggested that the correction in the new study may have actually
been a bit too strong, compared to actual observations — in other words,
the modeled AMOC is “probably more unstable than the real system,” he
said.
Rahmstorf also pointed out this issue in his commentary —
but he added that the climate model used also did not account for an
influx of meltwater from Greenland under future climate change, an event
that recent research suggests could substantially speed the AMOC’s
weakening.
This visualization shows ocean current flows in the Mediterranean Sea and Eastern Atlantic from 16 Feb 2005 through 16 January 2006.
For each second that passes in the visualization, about 2.75 days pass in the simulation.
The colors of the flows represent their depths.
The white flows are near the surface while deeper flows are more blue.
“With unmitigated emissions . . .the Gulf Stream System weakens on
average by 37 percent by the year 2300 without Greenland melt,” he
notes.
“With Greenland meltwater this doubles to 74 percent.
And a few
months ago, a study with a high-resolution ocean model appeared,
suggesting that the meltwater from Greenland is likely to weaken the
AMOC considerably within a few decades.”
The fact that current
models don’t take this melting into account is further support for the
idea that scientists have been underestimating the risk of a future AMOC
collapse, he suggested.
According to Liu, the new study serves to make a point about the
dramatic effects that can occur when corrections are made in climate
models, as well as the AMOC’s major role in the global climate.
By
tweaking a climate model to make it more consistent with real-life
observations, very different outcomes may be observed, Liu noted.
“I
would say that it is reasonably well-accepted that a current generation
of climate models [is] missing the essential physics in representing
the AMOC,” said Haine.
And he added that the new study “points to the
need to fix these biases in the climate models.”
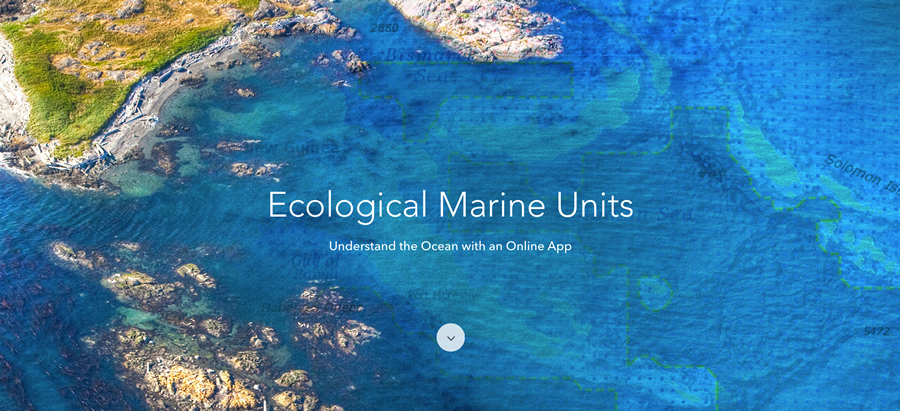
Oceanographers are carving up the world’s seas like the last of the holiday turkey. A new 3D map sorts global water masses — from deep, frigid circumpolar waters to the oxygen-starved Black Sea — into 37 categories.
Clicking on the map will display information about ecological marine units based on a clustering analysis that was preformed against NOAA’s World Ocean Atlas Data.
The interactive map allows you to zoom and pan and interact with the data by clicking on the map.
Clicking the points on the map enables you to explore the depth (vertical) profile and associated oceanographic information for the selected location. Please explore this fascinating ocean dataset and discover the (statistically) different clusters and what makes each one of them unique.
The map groups together marine regions of similar temperature, salinity, oxygen and nutrient levels. It has been available for only a few months, and researchers are still working through how they might use it.
But its international team of developers hopes that the map will help conservationists, government officials and others to better understand the biogeography of the oceans and make decisions about which areas to preserve.
It could also serve as a data-rich baseline for analysing future ocean changes.
EMUs rendered at the bottom of the water column.
Many existing systems also attempt to classify variations in the ocean, such as lists of large marine ecosystems or the Longhurst biogeographical provinces that are defined by the rate at which ocean life consumes carbon.
But these are often limited to surface or coastal ecosystems.
The latest effort, known as the ecological marine units (EMUs), is the most detailed attempt yet to cover the global ocean in three dimensions.
“What’s often missing is all that’s between the surface of the ocean and the ocean bottom,” says Dawn Wright, chief scientist of Esri, a geographic information-systems company in Redlands, California, that helped to develop the 3D map.
“That’s what our project will hopefully bring to the table.”
Ecological Marine Unit Explorer
Esri launched a web portal for the EMU data in September, and has been presenting the concept at conferences since then.
Wright described it on 16 December in San Francisco, California, at a meeting of the American Geophysical Union.
Ecological Marine Units (EMUs) are Esri's gift to a world
whose final unexplored terrain lies beneath its seas.
EMUs can help to reveal why marine animals live where they do. In the eastern tropical Pacific Ocean the mapping shows a complex interplay between oxygen-rich and oxygen-poor waters.
The boundary of the low-oxygen zone shifts towards the surface in some spots and dips deeper in others.
That variation affects the locations of economically important tuna fisheries, says Patrick Halpin, a marine ecologist at Duke University in Durham, North Carolina.
“It’s an interesting thing to look at in three dimensions, fairly unique and gratifying.”
Such data could guide the United Nations’ effort to designate a series of ecologically or biologically significant marine areas to focus future conservation efforts, Halpin notes.
Looking at the distribution of EMUs could help officials to pinpoint the boundaries of those areas, or to make sure they are designating enough waters to capture all the biogeographic diversity.
Dr Kathryn Sullivan introducing the Ecological Marine Units
IUCN Conservation Congress (Sept 2016)
And the South African National Biodiversity Institute is interested in using EMUs to update data on open-ocean and deep-sea habitats for the country’s next national biodiversity assessment, due in 2019, says Heather Terrapon, a spatial analysis coordinator at the institute in Cape Town.
Nations that do not have the money to gather their own data sets could use the free EMU data and visualizations to manage their marine resources, says Peter Harris, a marine geologist at the environmental information-management centre GRID-Arendal in Arendal, Norway.
The creation of the EMUs is the second step in a project that started with similar mapping on land. The intergovernmental Group on Earth Observations asked Roger Sayre, an ecologist at the US Geological Survey in Reston, Virginia, to lead a team to categorize terrestrial ecosystems.
The researchers, including some at Esri, combined information on geology and vegetation to generate nearly 4,000 ‘ecological land units’.
One example might be warm, wet plains, on metamorphic rock, with mostly deciduous forest.
Next, the team moved their focus from land to the oceans.
“It’s like total world domination in ecosystem mapping,” says Sayre, who heads the EMU project with Wright
They began with 52 million data points in the World Ocean Atlas maintained by the US National Oceanic and Atmospheric Administration.
These include information on chemical and physical parameters gathered every 27 kilometres to create a 3D grid.
The team added other data such as the shape of the sea floor and used statistical techniques to group the results into categories.
The resulting EMUs include the deep, very cold, low-oxygen waters that encompass roughly one-quarter of the world’s oceans.
Others are much smaller, such as the upper waters of the Red Sea, or the dilute estuaries of several Northern Hemisphere rivers.
For now, the EMU maps rely on data averaged over five decades.
Looking at conditions over shorter periods of time, such as seasons, would provide more helpful detail, says Frank Muller-Karger, a biological oceanographer at the University of South Florida in St Petersburg who has been comparing EMUs with weekly maps of coastal changes made using satellite imagery.
And to monitor change over decades, the EMU team would need to recalculate its maps every five years or more.
The EMU developers say that future iterations of the system could tackle such issues.
For now, they are hoping to expand on the land and marine units by creating new categories for coastal and freshwater ecosystems.
Rarely seen images of the Titanic before it left Southampton have
furthered researchers’ theory that a fire may have been the root cause
of the 1912 disaster
The sinking of the RMS Titanic
may have been caused by an enormous fire on board, not by hitting an
iceberg in the North Atlantic, experts have claimed, as new evidence has
been published to support the theory.
More than 1,500 passengers lost their lives when the Titanic sank on route to New York from Southampton in April 1912.
While the cause of the disaster has long been attributed to the
iceberg, fresh evidence has surfaced of a fire in the ship’s hull, which
researchers say burned unnoticed for almost three weeks leading up to
the collision.
While experts have previously acknowledged the theory of a fire on
board, new analysis of rarely seen photographs has prompted researchers
to blame the fire as the primary cause of the ship’s demise.
Journalist Senan Molony, who has spent more than 30 years researching the sinking of the Titanic, studied photographs taken by the ship’s chief electrical engineers before it left Belfast shipyard.
Mr Maloney said he was able to identify 30-foot-long black
marks along the front right-hand side of the hull, just behind where the
ship’s lining was pierced by the iceberg.
He said: “We are looking at the exact area where the iceberg stuck,
and we appear to have a weakness or damage to the hull in that specific
place, before she even left Belfast”.
Experts subsequently confirmed the marks were likely to have been
caused by a fire started in a three-storey high fuel store behind one of
the ship’s boiler rooms.
A team of 12 men attempted to put out the flames, but it was too
large to control, reaching temperatures of up to 1000 degrees Celsius.
Subsequently, when the Titanic struck ice, the steel hull was weak enough for the ship’s lining to be torn open.
Officers on board were reportedly under strict instruction from J Bruce Ismay, president of the company that built the Titanic, not to mention the fire to any of the ship’s 2,500 passengers.
Presenting his research in a Channel 4 documentary, Titanic: The New Evidence,
broadcast on New Year’s Day, Mr Maloney also claims the ship was
reversed into its berth in Southampton to prevent passengers from seeing
damage made to the side of the ship by the ongoing fire.
Mr Molony said: “The official Titanic inquiry branded [the sinking] as an act of God. This isn’t a simple story of colliding with an iceberg and sinking.
“It’s a perfect storm of extraordinary factors coming together: fire, ice and criminal negligence.
“Nobody has investigated these marks before. It totally changes the
narrative. We have metallurgy experts telling us that when you get that
level of temperature against steel it makes it brittle, and reduces its
strength by up to 75 per cent.
“The fire was known about, but it was played down. She should never have been put to sea.”
History Channel - Titanic Real Story - Discovery History Documentary 2017
In 2008, Ray Boston, an expert with more than 20 years of research into the Titanic’s journey, said he believed the coal fire began during speed trials as much as 10 days prior to the ship leaving Southampton.
He said the fire had potential to cause “serious explosions” below decks before it would reach New York.
An inquiry into the disaster, presented to Parliament in 1912,
described the ship as travelling at “high speed” through dangerous icy
waters, giving the crew little opportunity to avoid the fatal collision.
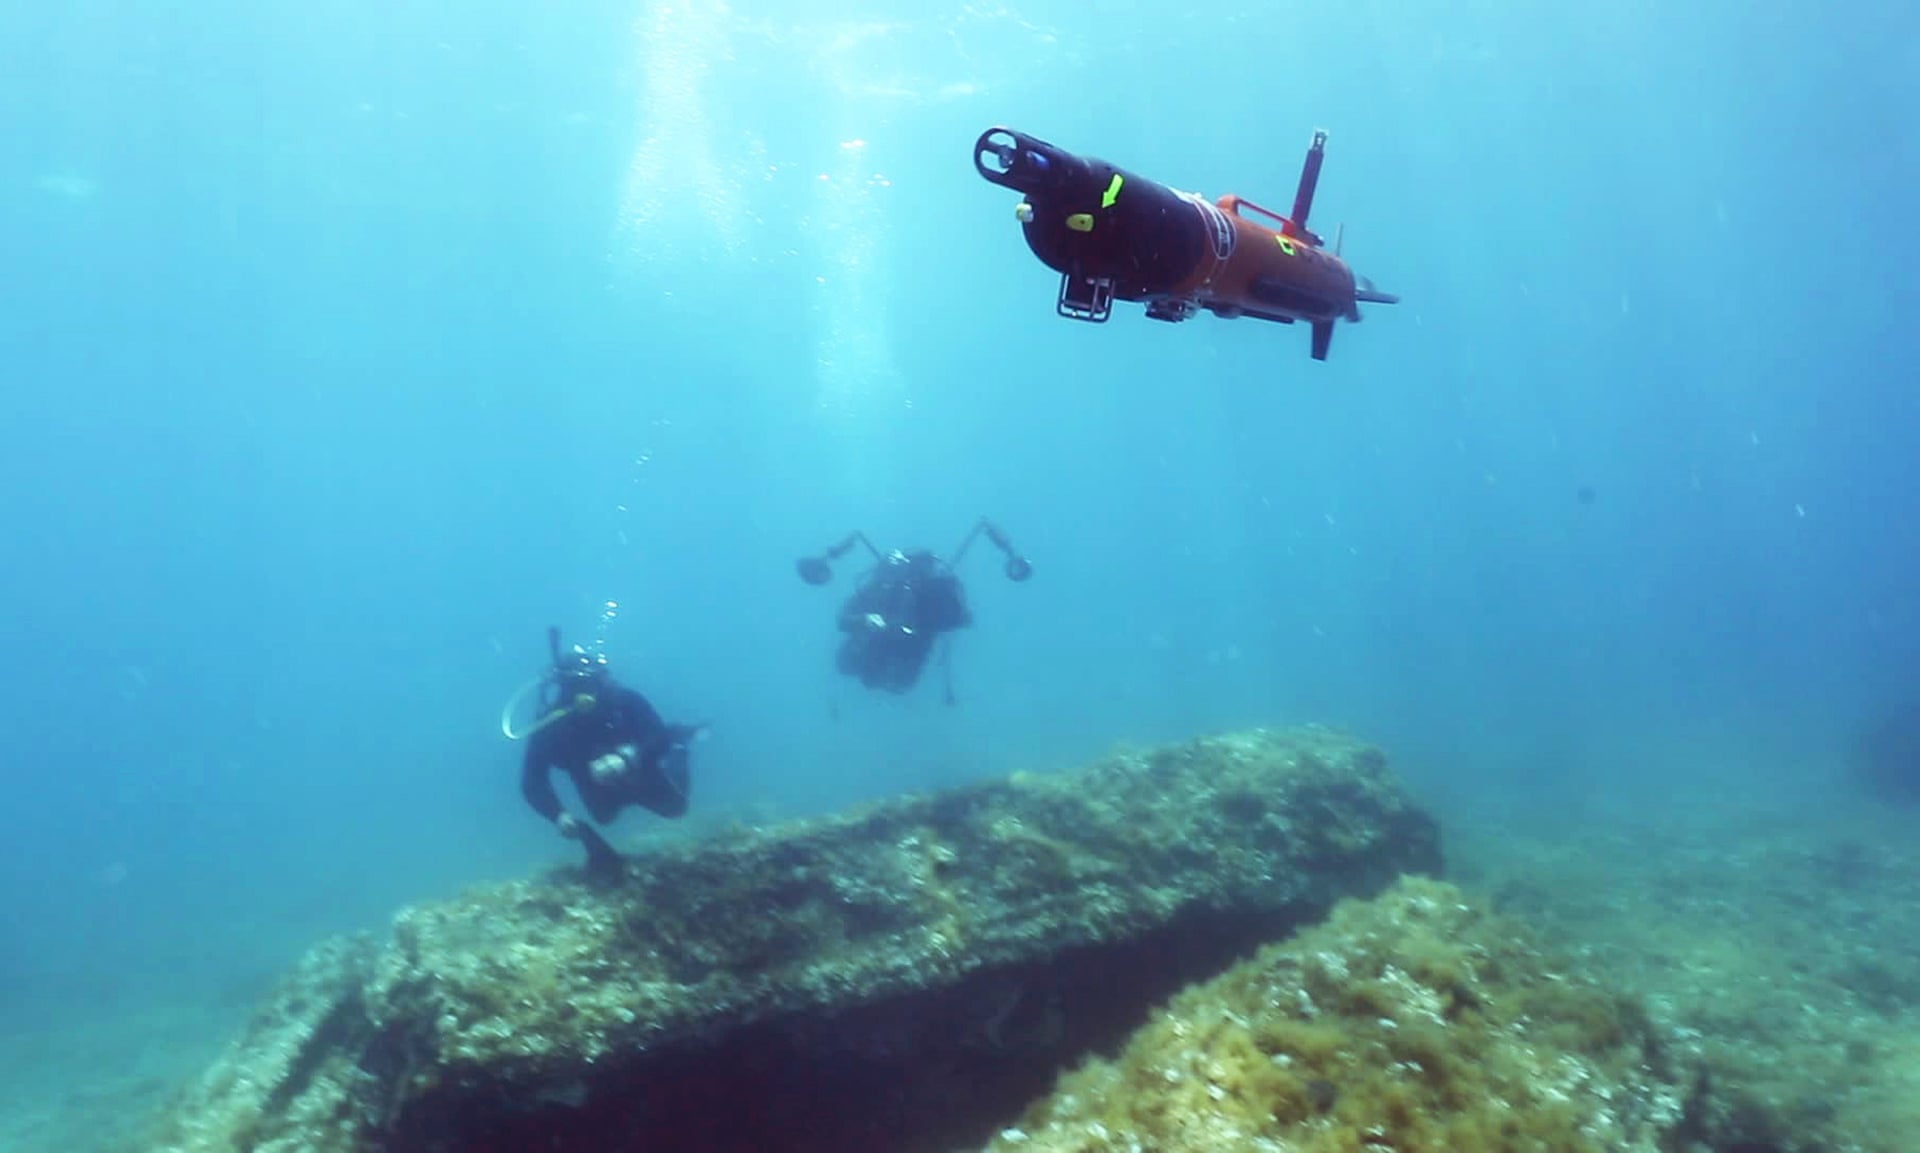
Robotic submarines and ‘internet of underwater things’ to transform hunt for sunken cities and ancient shipwrecks
No one knows what happened at Atlit-Yam.
The ancient village appeared
to be thriving until 7000BC.
The locals kept cattle, caught fish and
stored grain.
They had wells for fresh water, stone houses with paved
courtyards.
Community life played out around an impressive monument:
seven half-tonne stones that stood in a semicircular embrace around a
spring where people came to drink.
Then one day, life ended.
Not far off the coast of the village of Atlit in the Mediterranean Sea, near Haifa, lies the submerged ruins of the ancient Neolithic site of Atlit Yam.
The prehistoric settlement, which dates back to the 7th millennium BC, has been so well preserved by the sandy seabed that a mysterious stone circle still stands as it was first erected, and dozens of human skeletons lay undisturbed in their graves.
Atlit Yam is one of the oldest and largest sunken settlements ever found and sheds new light on the daily lives of its ancient inhabitants.
Today, Atlit Yam lies between 8 – 12 metres beneath sea level and covered an area of 40,000 square meters.
The village that once sat on the Mediterranean coast now lies 10
metres beneath the waves off Israel’s shore.
It was inundated when sea
levels rose at the end of the last ice age.
But Atlit-Yam was destroyed
before then, and swiftly, perhaps by a tsunami.
Buried under sand at the
bottom of the sea, it now ranks as the largest and best preserved
prehistoric settlement ever found on the seafloor.
Human skeletons still
lie there in graves, undisturbed.
For marine archaeologists, Atlit-Yam is a trove from the Neolithic
world.
Research on the buildings, tools and the remains of past lives
has revealed how the bustling village once worked.
“It looks as though
it was inhabited until the day it was submerged,” said Benedetto
Allotta, head of industrial engineering at the University of Florence.
But for all the secrets the site has shared, it is only one window into a
lost world.
For a fuller picture, researchers need more sunken
settlements.
The hard part is finding them.
In January, work will start on a new project to transform the search
for sunken cities, ancient shipwrecks and other subsea curiosities.
Led
by Italian researchers, Archeosub will build a new generation of robotic
submarines, or autonomous underwater vehicles (AUVs), for marine
archaeologists.
“You can find plenty of human settlements not far from
the coast,” Allotta said.
“In the Mediterranean there will be a lot more
Atlit-Yams waiting to be explored and studied.”
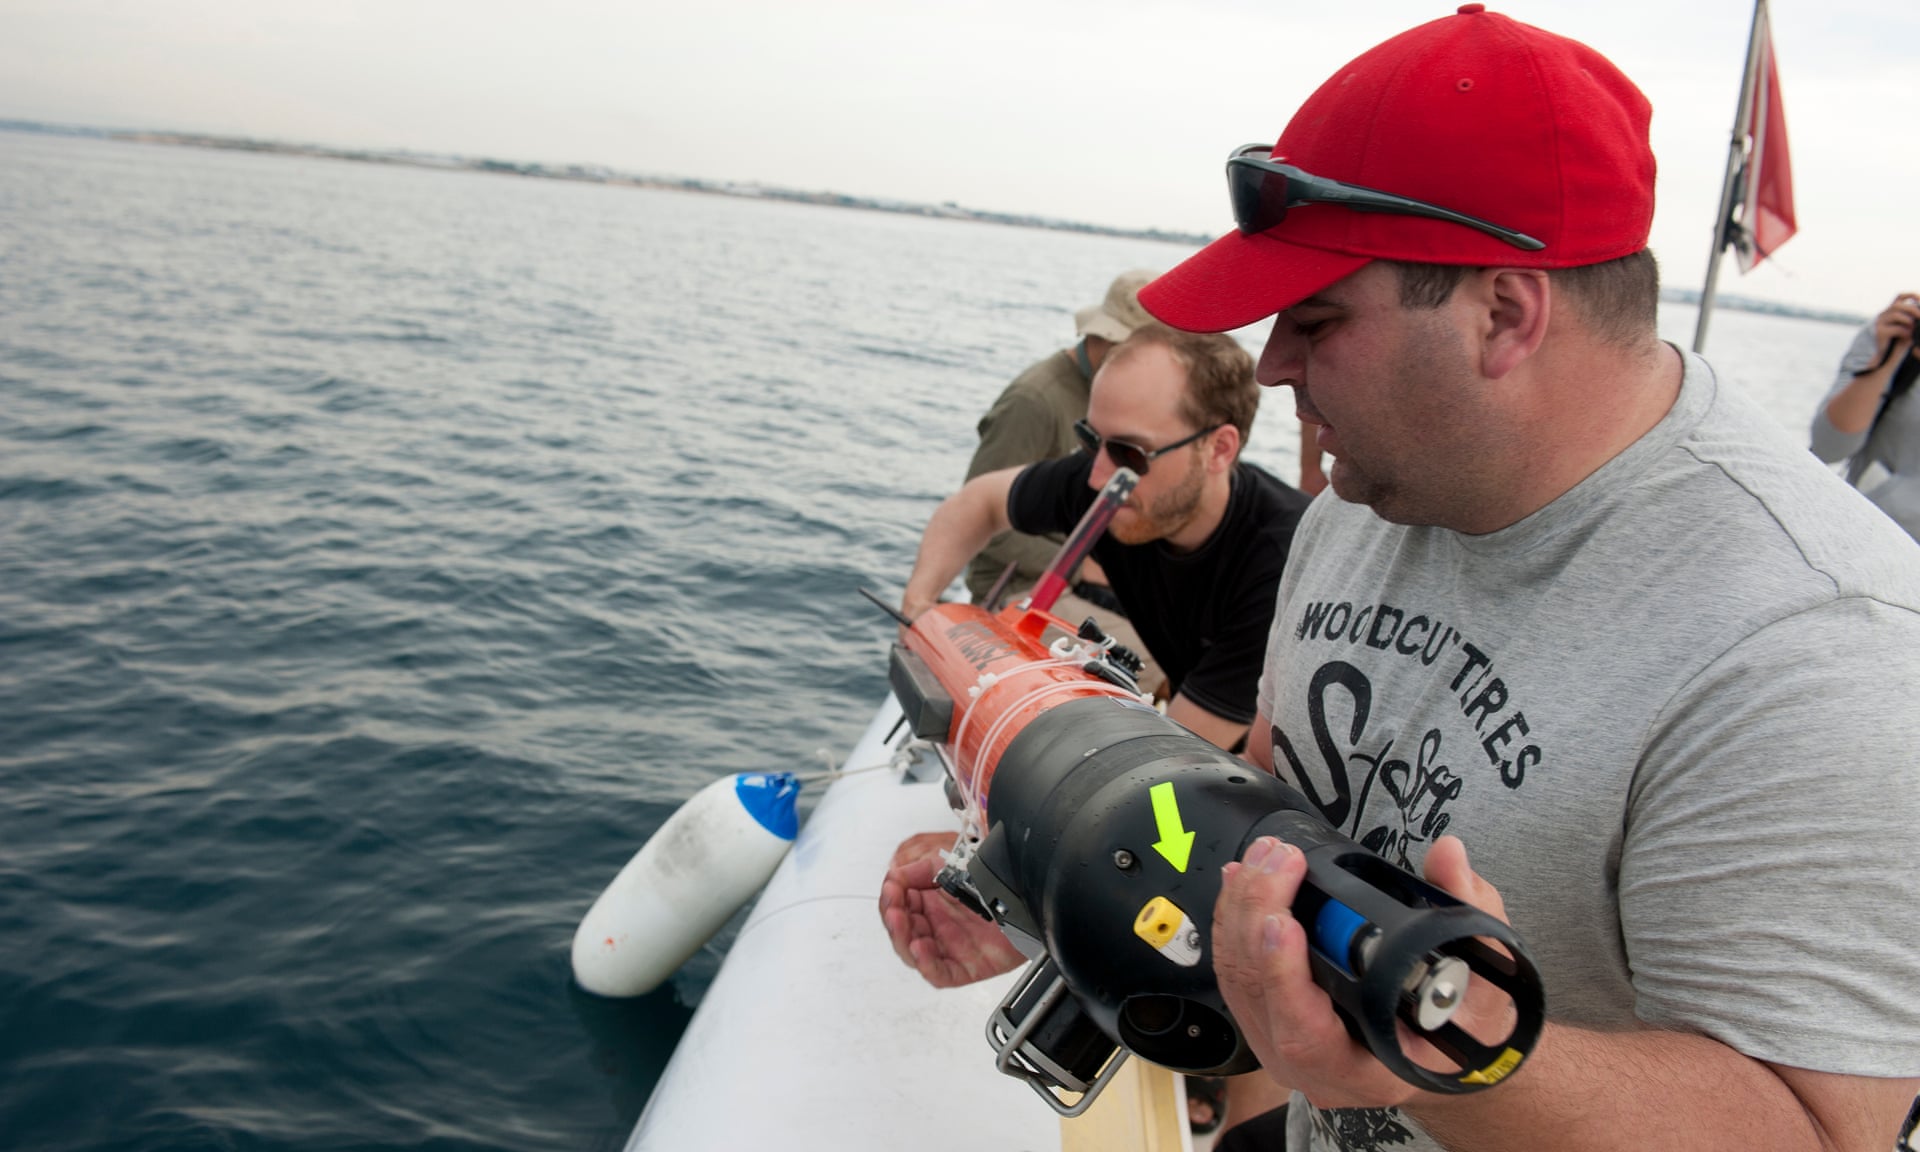
Researchers from University of Porto preparing to ready to launch an AUV.
Photograph: Marco Merola/Courtesy of Sunrise
The goal of Archeosub is to put sophisticated AUVs in the hands of
cash-strapped researchers.
That, in part, means turning the costly,
heavy technology of the military and oil industries into far cheaper and
lighter robots.
They must be affordable for archaeological
organisations and light enough to launch by hand from a small boat, or
even the shore, rather than from a winch on a large research vessel.
Slashing the cost and weight is only the start.
The team behind
Archeosub has begun to make the AUVs smarter too.
When thrown overboard,
the submarines can become part of an “internet of underwater things”
which brings the power of wifi to the deep.
Once hooked up, the AUVs
can talk to each other and, for example, work out the most efficient way
to survey a site, or find particular objects on the seabed.
Field tests show the approach can work.
When cargo ships near Porto
in northern Portugal lose containers overboard, AUVs can be deployed to
find the missing goods.
And in a trial last year, Allotta’s group sent
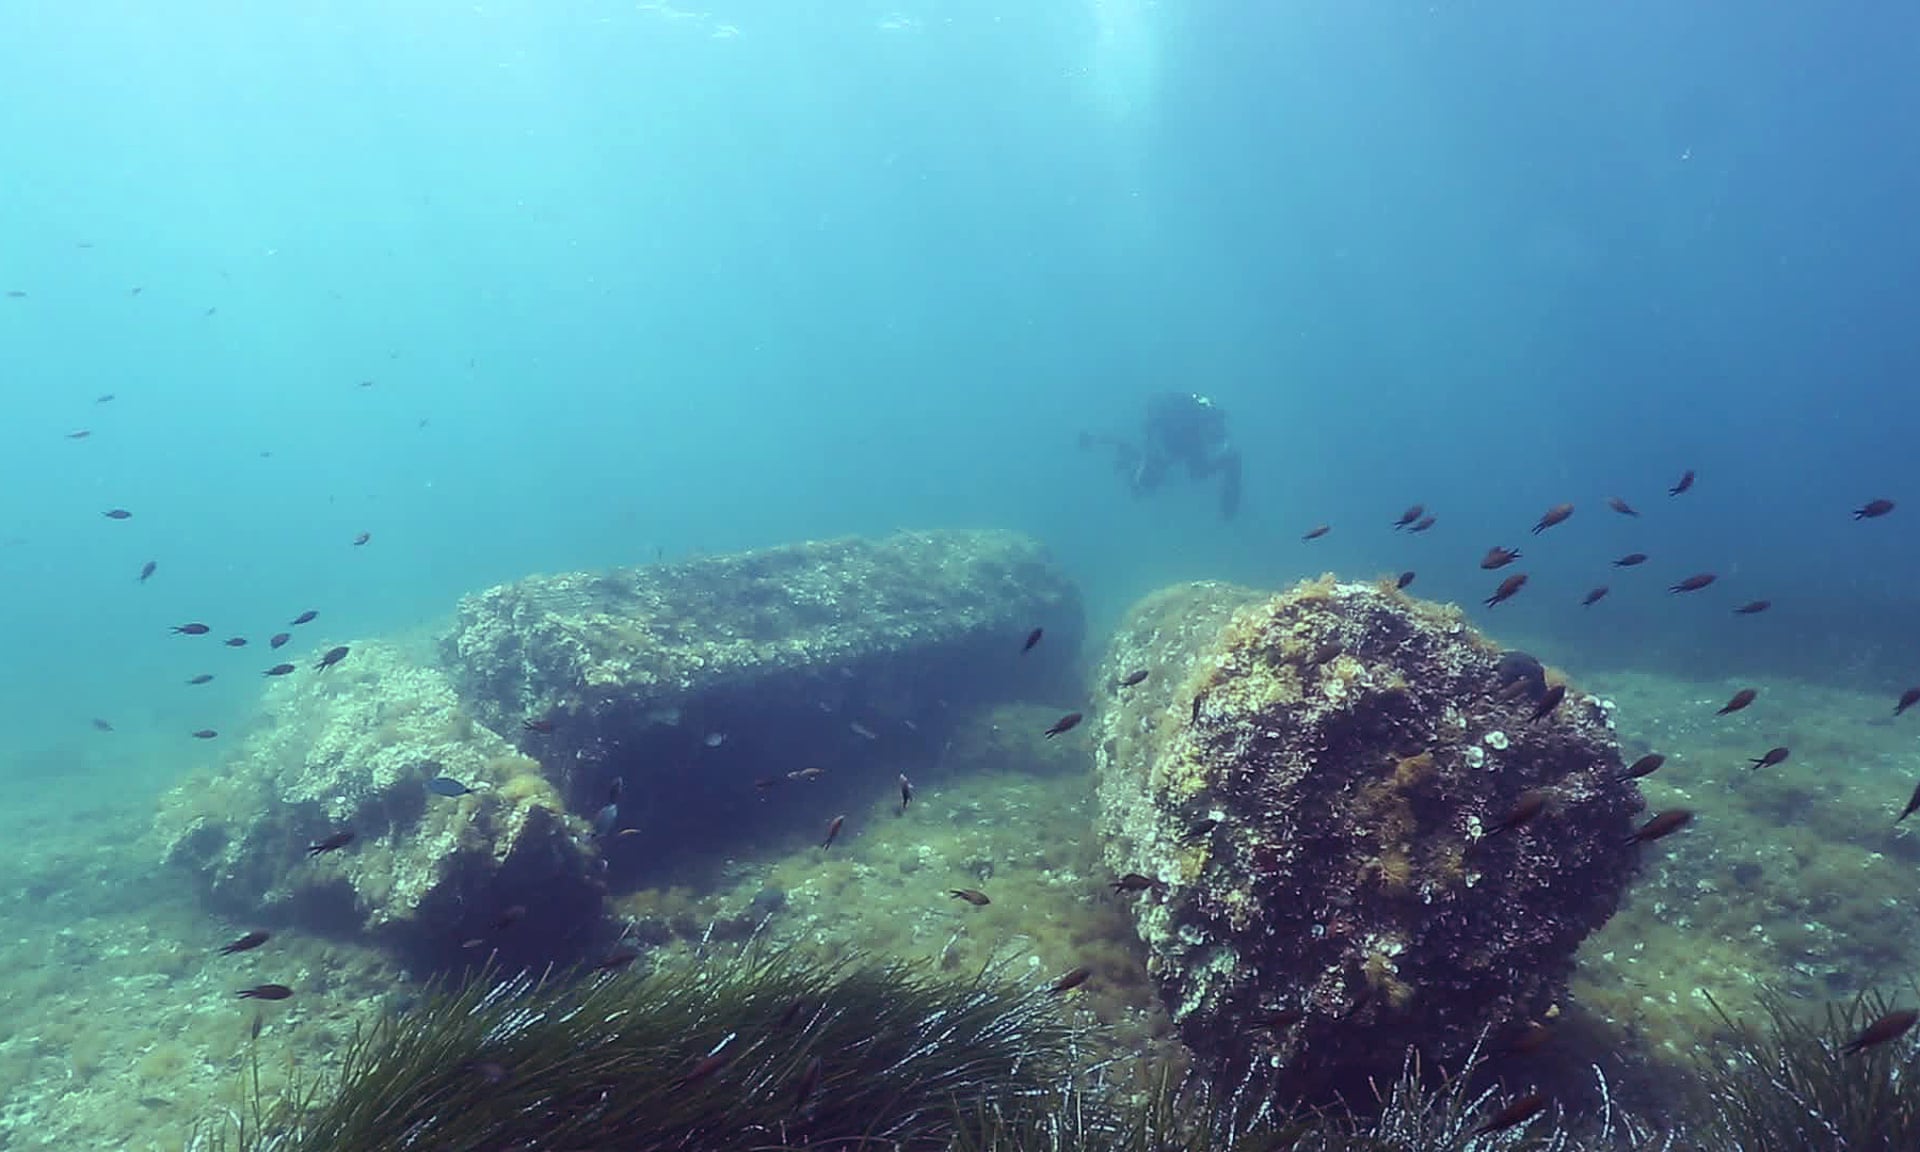
three AUVs to search for wrecks at Marzamemi, off the Sicilian coast.
The site is the final resting place of a Roman ship, known as the
“church wreck”, which sank while ferrying pre-formed parts of marble and
breccia for an early Christian church in the 6th century AD. “We used
the AUVs to pass through and look for new ruins,” Allotta said.
“We
could do a reconstruction of the area, where old Roman ships sank while
bringing marble columns to Italy,” he said.
The underwater archaeological site of Marzamemi, Sicily.
The site is the
final resting place of a Roman ship which sank while ferrying marble
and breccia for an early Christian church in the 6th century AD.
Photograph: Salvo Emma/Courtesy of Sunrise
Creating an internet beneath the waves is no breeze.
Slip under the
surface and the electromagnetic waves used in wifi networks travel only
centimetres.
Instead, a more complex mix of technologies is called for.
Acoustic waves, which are affected by depth, temperature, salinity and
surface wind, are used to communicate over long distances underwater.
At
close range, AUVs can share data over light beams.
But more creative
solutions are also envisaged, where an AUV working on the seabed
offloads data to a second which then surfaces and beams it home by
satellite link.
Work is underway on AUVs that can beam pictures from the
seabed over acoustic waves, and dock with others that charge them up.
Surface buoys that receive GPS signals tell the AUVs where they are.
“If you want to build an internet of underwater things, you cannot
use the technology we have developed for the terrestrial world,” said
Chiara Petrioli, a computer engineer who leads the work under the Sunrise project at Rome University.
“You have to be smarter.”
David Lane, a professor of autonomous engineering at Heriot-Watt
University in Edinburgh, has created a marine version of Dropbox for the
underwater internet of things.
It allows AUVs to share information from
seafloor scans and other data.
So if an AUV on a first pass survey
spies an intriguing object on the seabed, it can share the coordinates
with a nearby AUV that carries better cameras and sonar, and arrange for
a closer inspection once it has left the area.
“The use of these vehicles has huge potential for marine archaeology,”
Lane said.
“There’s a lot of history wrapped up in what’s lying on the
seabed.”
One site where Allotta plans to deploy the new AUVs is the Gulf of
Baratti off the coast of Tuscany. In 1974, a remarkable shipwreck was
discovered there in 18 metres of water.
More than a merchant ship, the
2000-year-old vessel was a travelling medical emporium.
More than 100
wooden vials were found on board, along with other ancient medical
supplies, including tin containers of tablets that may have been
dissolved and used as eyewash.
Other Roman ships went down in the
waters, shedding cargoes of olive oil and wine held in huge terracotta
pots called dolia.
Often it is only the dolia that remain, the wooden
ships lost, or at least buried, under silt.
Allotta hopes to have the first test results from the Archeosub
project in the summer.
“Right now, we don’t have the right technology to
give to archaeologists,” he said.
“But we are close.”
GeoGarage presents its best wishes for a happy, prosperous and peaceful 2017. We are grateful for having you in 2016, and we look forward to serving you during this New Year.
Thank you for working with us in 2017.
Exciting things are coming up next year. Stay Tuned! :)