Saturday, June 14, 2025

Image of the week : biggest wave ever ridden at Jaws

 
Benjamin Sanchis (Hossegor, France) tows into one of the biggest waves ever challenged by a human but fades a bit too deep at Jaws, Maui, Hawaii on December 22, 2024. 
 
Links :

Friday, June 13, 2025

VDES authentication: safeguarding maritime E-navigation’s future


From MaritimaTechnologyReview by Theo Clark
 
In the ever-evolving world of maritime communications, a new system is making waves, and it’s not just about sending messages faster.
The very-high-frequency data exchange system, or VDES, is set to revolutionize how ships communicate, paving the way for advanced e-navigation applications.
But with great power comes great responsibility, and that’s where data authentication comes into play.
Gareth Wimpenny, lead author of a recent study published in ‘Navigation’ (translated from German), has been delving into the nitty-gritty of VDES authentication, and his findings could have significant implications for the maritime industry.

So, what’s the big deal about data authentication? Well, imagine you’re at the helm of a massive vessel, relying on digital data to navigate treacherous waters.
You need to be darn sure that the data you’re receiving is legit and hasn’t been tampered with.
That’s where VDES comes in, but it’s not without its challenges.
As Wimpenny puts it, “A key problem in e-navigation is that of data authentication: determining that the data originate from a trusted party and have not undergone changes after transmission.”

Wimpenny’s research, affiliated with an unknown institution, tackles this problem head-on, considering the unique constraints of the maritime environment.
He proposes a two-tiered solution that’s as clever as it is practical.
In low-traffic areas where wireless capacity is ample, the default approach would be digital signatures.
But here’s where it gets interesting: for areas under the control of a shore station with low wireless capacity, Wimpenny suggests using the TESLA protocol.
TESLA, or timed efficient stream loss-tolerant authentication, is a low-overhead authentication scheme that’s particularly attractive for future-proof quantum-safe cryptography.
In other words, it’s a nifty way to authenticate data even when bandwidth is tight.

So, what does this mean for the maritime industry?
For starters, it could lead to more secure and efficient communications at sea.
But the opportunities don’t stop there.
As VDES becomes more prevalent, we could see a boom in e-navigation applications, from automated collision avoidance to real-time weather updates.
And with quantum-safe cryptography on the horizon, the maritime industry could be at the forefront of secure communications.

But it’s not just about the tech.
As Wimpenny’s research shows, understanding the unique challenges and constraints of the maritime environment is crucial.
By working closely with maritime professionals and stakeholders, researchers can develop solutions that are not only innovative but also practical and effective.

As the maritime industry continues to embrace digital technologies, the need for robust and secure communications will only grow.
With researchers like Wimpenny leading the charge, the future of maritime communications looks bright.
So, let’s raise a glass to the seafarers, the researchers, and the innovators making waves in the world of maritime communications.
Here’s to smooth sailing and secure communications!
 
Links :

Thursday, June 12, 2025

Shipping lines go cool on Arctic Ocean route

Venta Maersk was the first container ship to take the Northern Sea Route back in 2018
 © Olga Maltseva/AFP via Getty Images

From FT by Robert Wright 
 
Melting ice could make shorter transits between Asia and Europe a reality but there are economic and geopolitical risks 

When the Venta Maersk, a ship owned by Denmark’s AP Møller-Maersk, set sail in 2018 from Vladivostok in the far east of Russia towards St Petersburg in the west, the voyage was reported as a harbinger of things to come.
It was the first container ship to head for Europe from Asia via the Northern Sea Route, through the Arctic Ocean, instead of the Suez Canal.
It was speculated that, as Arctic temperatures rose and sea ice cover fell, the time and cost savings would make such trips routine.

Yet, seven years on, the Venta Maersk remains the only ship from a large international container line to have used the route.
In 2024, ships taking the journey handled only 3mn tonnes of cargo transiting between points outside the Arctic, according to Rosatom, the Russian state company that organises the transits.
The figures are dwarfed by the 1.57bn tonnes of cargo and 26,434 trips through the Suez Canal in 2023, the last year before attacks by Yemen’s Houthis prompted rerouting of voyages.
 
Most Arctic shipping goes through the Northwest and Northeast Passages.
Other routes are not yet suitable for commercial shipping, although they will likely become navigable in the decade ahead.
© GIS
 
The reluctance of most shipping lines to operate in the Arctic has cast doubt over predictions that warming in the sea there would reshape shipping patterns.
 
Daniel Richards, a director at London-based consultancy Maritime Strategies International, points to the risks of using the northern route.
He says container shipping lines tend to be risk-averse, and their customers are similarly reluctant to have their goods enter an ecologically and geopolitically sensitive region.
“That doesn’t feel likely to change in the near term,” he says.
 
However, Terje Jørgensen, director of the port of Kirkenes, near Norway’s border with Russia, is convinced the region can become an important trading route.
He told the BBC in May about his vision to turn the lightly used port into a “Singapore of the North”, transferring containers between ships: “What we’re trying to build here in Kirkenes is a trans-shipment port where three continents meet: North America, Europe and Asia.”
 
Terje Jørgensen, director of the port of Kirkenes, near Norway’s border with Russia 
© Naina Helén Jåma/Bloomberg
 
‘What we’re trying to build here in Kirkenes is a trans-shipment port where three continents meet: North America, Europe and Asia’ © Naina Helén Jåma/Bloomberg 
 
Shipping lines’ willingness to use the Northern Sea Route is likely to be determined by geography, economics and geopolitics.
Geography is the main point in favour, as the corridor is a far shorter means of reaching parts of Europe from Asia than alternatives.
From the Japanese port of Yokohama to the Russian Arctic port of Murmansk is a journey of 12,840 nautical miles via the conventional Suez Canal route and 5,770 nautical miles via the Northern Sea Route.

The passage has also become more navigable because of climate change.
Parts of the Arctic are frequently free of sea ice in summer, although many shipping lines prefer to use “ice-class” vessels with extra-strong hulls.
Many rely on Russian icebreakers, provided by Rosatom, to clear the way.

Richards notes that the period with the lowest sea-ice coverage — northern hemisphere summer — is when the heaviest flows of goods come from Asia to Europe and North America, ahead of Christmas.
“It might be that someone would run a few sailings per year to coincide with the peak season in the summer, offering slightly faster transit times,” he says.
 
© FT • Sources: NSIDC; FT research 
 
Some container ships are taking the Northern Sea Route in relatively small numbers, says Richards, but they are mostly run by specialist operators with links to Russia and China.
Two small container lines — NewNew Shipping, based in Dalian, China, and Hong Kong-based Safetrans Line, for example, offer services via the route.
For most shipping companies, however, the economic and geopolitical risks of operating via the Arctic outweigh any opportunity.
Basil Karatzas, a New York-based ship finance specialist, says the route is “fairly isolated; it’s not year-round”.
 
Richards says that for container ships, which follow set schedules, unpredictable weather presents “technical challenges”.
It is seldom clear which parts will be ice-free and when — or if an icebreaker is required.
And there are environmental concerns; since 2019, several big shipping lines have signed the Arctic Corporate Shipping Pledge, promising not to use Arctic routes to avoid polluting the area.
The route also bypasses hubs where ships drop off or pick up cargo between ports.
Maersk, for example, uses hubs in Tanjung Pelepas, near Singapore; Salalah, in Oman; and on the Spanish and Moroccan sides of the Gibraltar strait to serve Asia, the Gulf and Africa.
A person familiar with Maersk’s thinking suggests its reliance on the hubs is a reason why it has not returned to the Arctic, adding that, because of sanctions, Maersk no longer does business in Russia.
The route runs almost entirely through Russian waters and using it may require support from Rosatom’s icebreakers.
Karatzas suspects most lines will hold off from using the route for now: “Unless there’s a compelling reason, I think for the time being people will stay away.” 
 
Links :

Wednesday, June 11, 2025

Geography matters, time collides: mapping China’s maritime strategic space under Xi


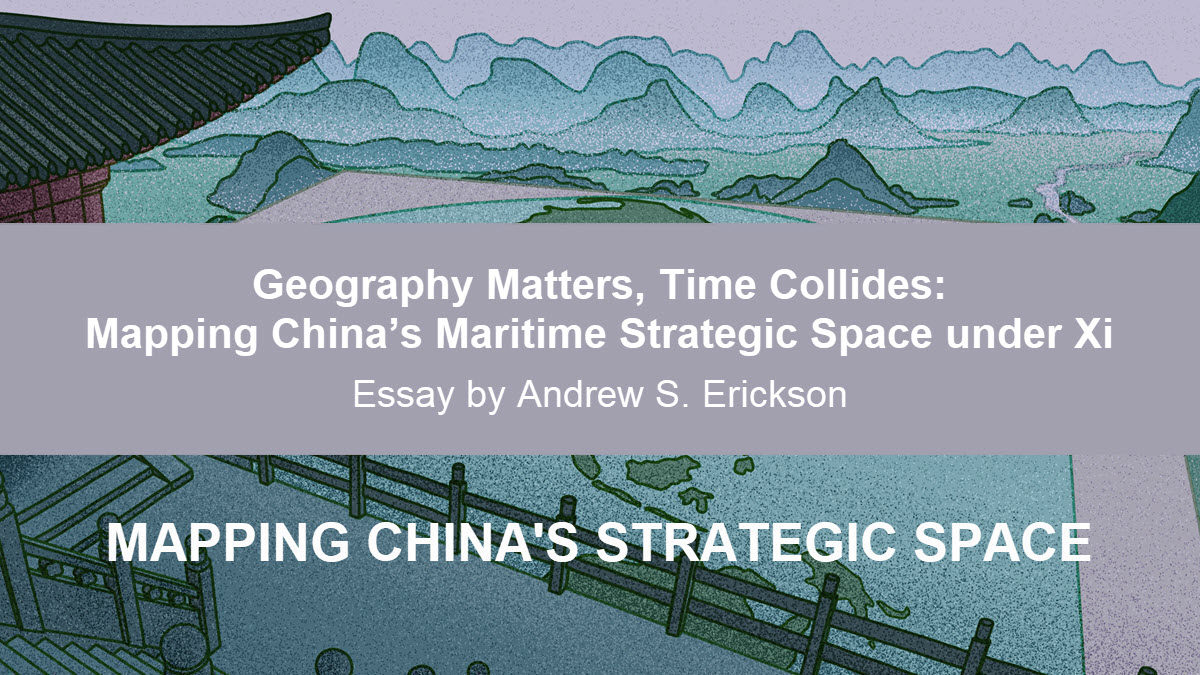
Banner illustration by Nate Christenson ©The National Bureau of Asian Research.


Andrew Erickson considers the “mental map” of China’s leaders—how they regard the physical nature of strategic space—in the context of the maritime expansion being pursued by Xi Jinping and the Chinese Communist Party.
He uses maps as visual references for understanding China’s evolving maritime geography and the constraints on its power in the maritime domain.
This essay is from the Mapping China’s Strategic Space project, which seeks to better understand what constitutes the “strategic space” beyond China’s national borders that Chinese leaders consider vital to their pursuit of national political, economic, and security objectives and to the achievement of China’s rise.


Honored to contribute to Nadège Rolland’s insightful National Bureau of Asian Research Strategic Space series!
Grateful to Andrew Rhodes for permission to use three of his world-class maps! Click here to see his other cartographic creations, as well as his publications.I’ve made a curated compilation of some of his greatest hits here.
What are China’s military maritime priorities?
Easy to say historically and nearby, harder looking forward in time and distance…
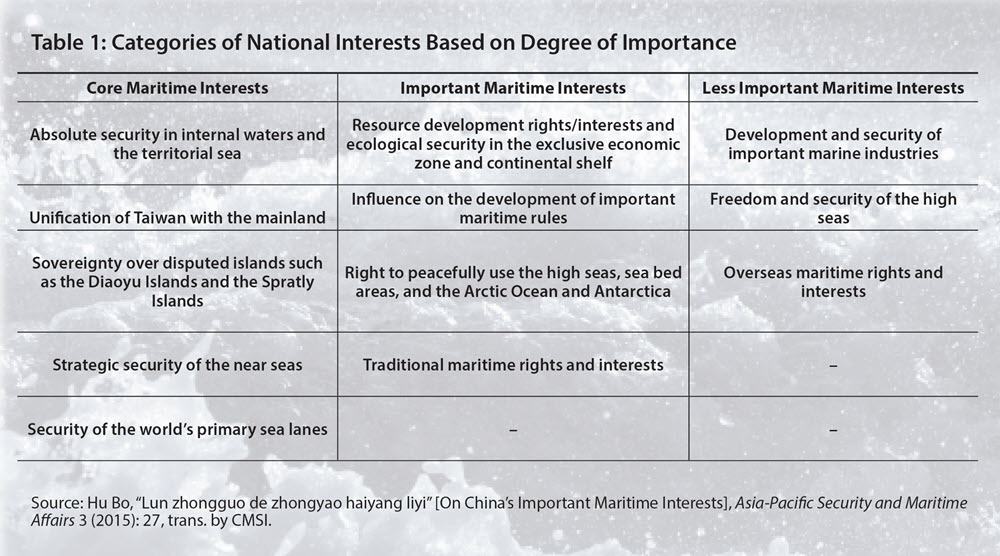
Overall, available PRC writings suggest tentative prioritization: (1) Near Seas and First Island Chain, (2) out to Second Island Chain, (3) Western Pacific out to Third Island Chain bisecting Hawaii and northern Indian Ocean, (4) Atlantic Ocean, Mediterranean Sea and Arctic Ocean, and (5) beyond.Few sources explicitly delineate such layers—but few, if any, disagree.I include a (translated) table by Peking University Professor Hu Bo, which offers ideas in this regard.
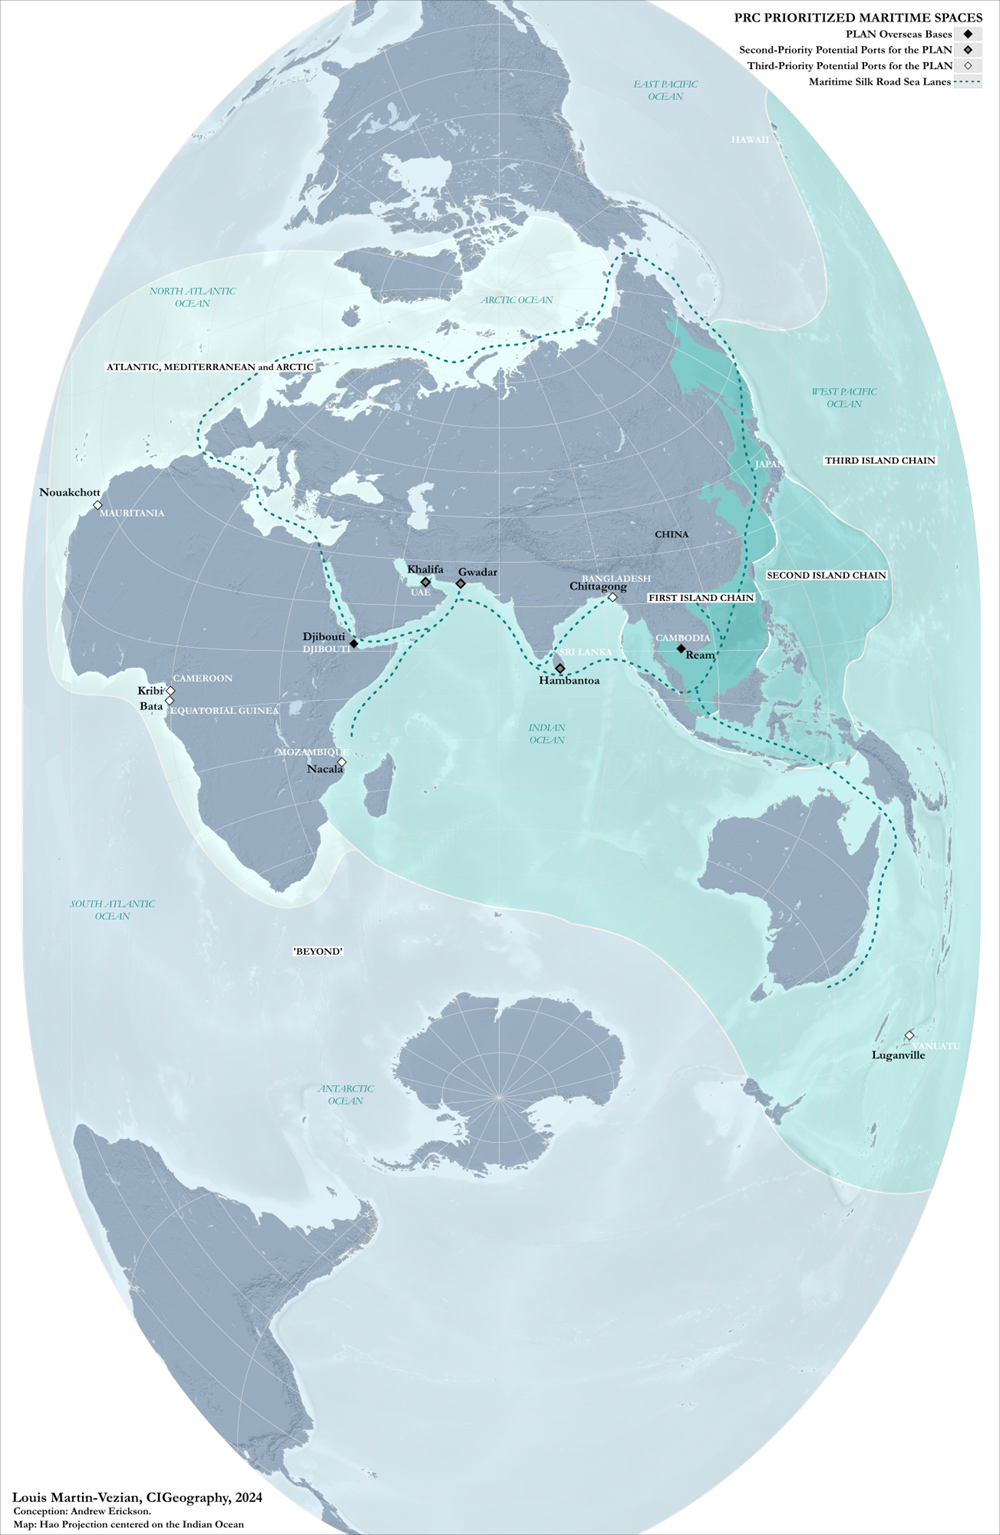
Delighted to work with Louis Martin-Vézian of CIGeography on a new “PRC Prioritized Maritime Spaces Map”! Projects China’s oceanic priorities strategic zones.
Offers best official depiction available of key Maritime Silk Road sea lanes in Xi’s Belt and Road Initiative.
Plots PLA Navy’s current bases as well as potential future first- and second-priority ports that might offer special access/support.

 
With an increasingly powerful People’s Republic of China (PRC) under paramount leader Xi Jinping engaging in meteoric military-maritime buildup and pressing disputed sovereignty claims with increasing assertiveness, it is more important than ever to consider Beijing’s “mental map”: how its leaders regard the physical nature of strategic space.
As Andrew Rhodes argues cogently, “Being able to ‘think in space’ is a crucial tool for decision-makers, but one that is often deemphasized.”1 
This applies to understanding both how PRC leaders envision China’s strategic space and how it is evolving in practice.

Beijing pursues a disciplined hierarchy of national security priorities in a pattern that Peter Dutton terms “concentrism”: “The strongest power is reserved for managing and securing its periphery, the next ring is a zone of disruption of potential attacking powers, and the third is to venture beyond the first two largely at the sufferance of stronger regional powers.”
He refers to these three spheres, respectively, as “zones of control, influence, and reach.”2 
The resulting “ripples of capability” in China’s military forces, extending in progressively descending circles of intensity outward from PRC shores, remain best viewed overall “through the lens of distance.”3

Per the mental map of Xi and the Chinese Communist Party (CCP), under the Belt and Road Initiative (BRI) the PRC has achieved relatively smooth expansion of influence overland through Central Asia to Europe and the Middle East.
It is still working on a more contested project of maritime expansion but has made considerable progress there as well.Beijing’s ambitions also extend to frontier domains.
Regarding the projection of sea power, China faces difficult opponents and geography.
It is nevertheless becoming an increasingly formidable opponent to neighbors over sovereignty disputes, none more so than Taiwan.
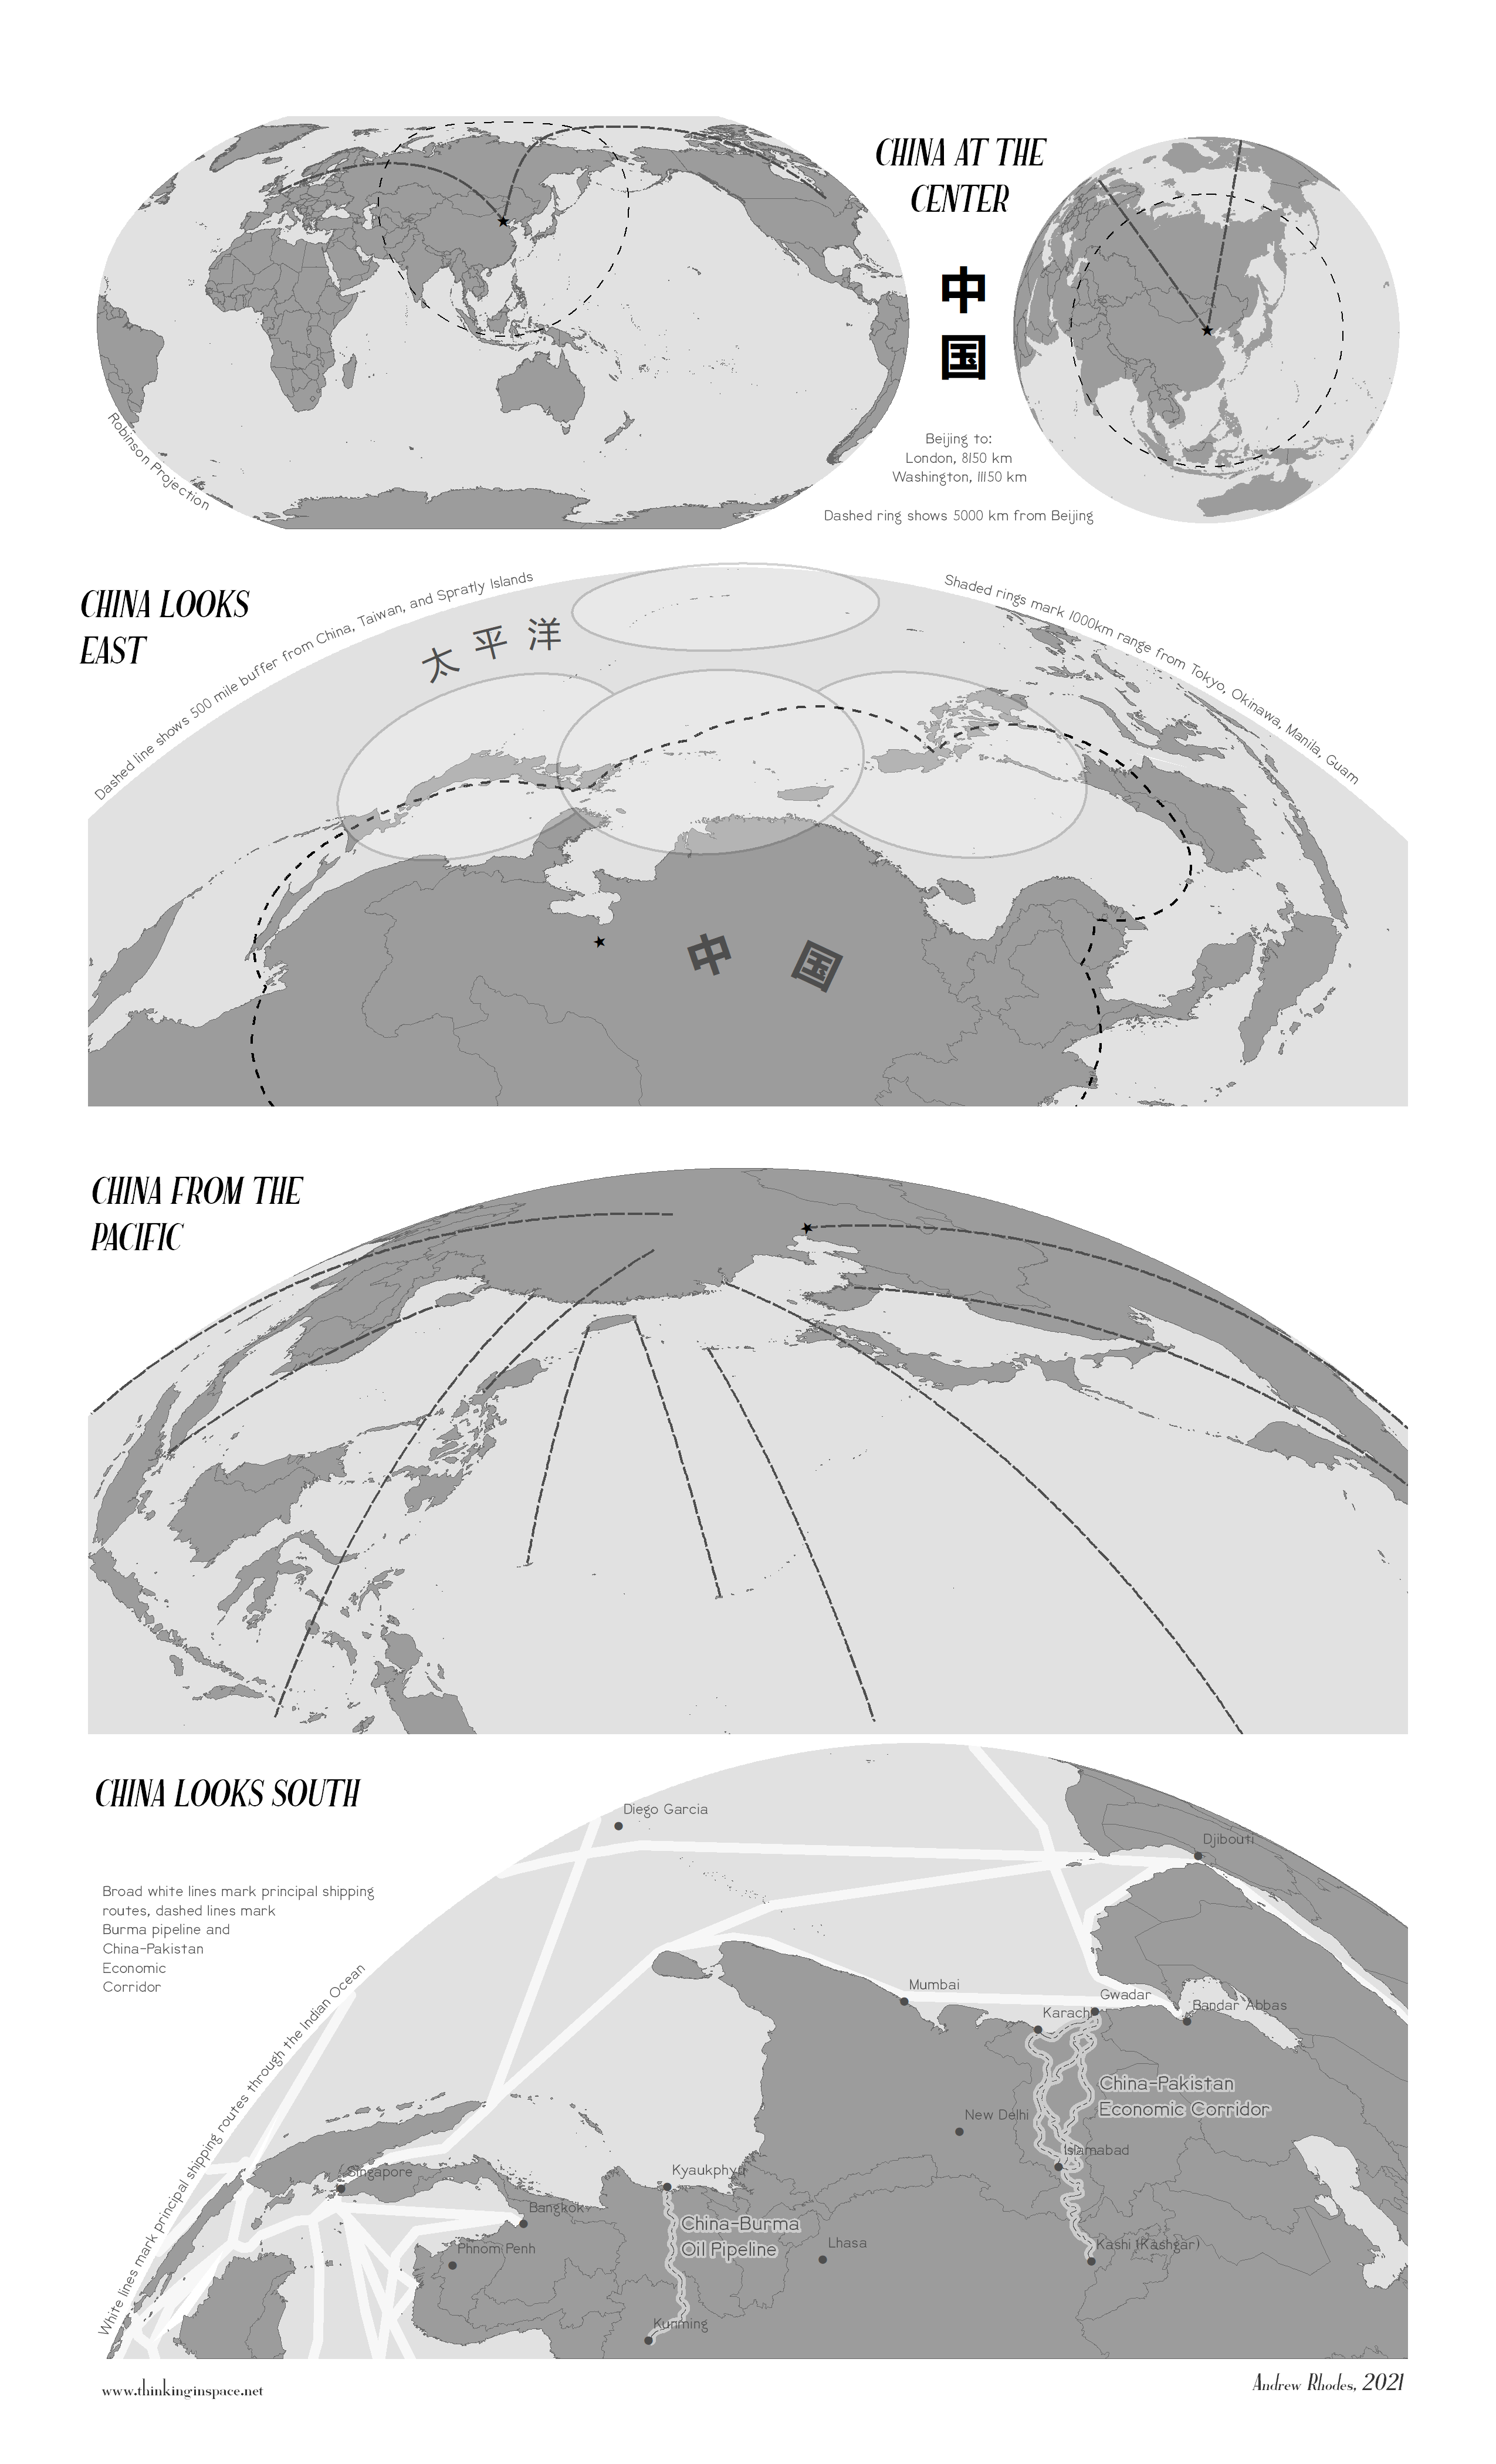
The map below by Rhodes offers perspectives on Beijing’s geostrategic location.… … …


Map 1: China’s Geographic Position
 

History and Geography


The PRC’s consistent, incremental security priorities draw on historical and spatial fundamentals.4 
The CCP has followed the precedent of dynastic China in expanding along relatively predictable geophysical lines, but it has done so with unprecedented focus and determination, which has thus far yielded steady, substantive progress.
Party-army capture of the Chinese state in 1949 set the stage for achieving the next layer of security: party-state administration of core historic heartland.
Next came control of ethno-religious minority borderlands, with Tibet being invaded in 1950 and subjugated the following year.
China then spent much of the Cold War defending the integrity of its self-defined land borders.
In 1962, it defeated India in a border conflict.
In 1969, PRC forces preemptively attacked Soviet counterparts on the Ussuri River’s contested Zhenbao Island to deter broader incursions by thousands of Soviet troops deployed along China’s disputed northern border.
In 1979, China waged a bloody border war to punish Vietnam for invading Cambodia and deposing the Khmer Rouge.
This conflict was followed by years of episodic skirmishes.

Meanwhile, China’s seaboard faced important flashpoints unresolved by civil war.
In 1950, the People’s Liberation Army (PLA) captured Hainan Island and subsequently secured the mainland coastline and airspace by limiting and ultimately halting Kuomintang coastal raids, harassment, and subsequently U.S.-sponsored U-2 overflights.5

However, it failed to wrest the heavily fortified offshore islands of Kinmen and Matsu from Kuomintang control, shelling them intermittently instead.
Following the outbreak of the Korean War in 1950, Mao Zedong indefinitely postponed an invasion of Taiwan slated for 1950–51.
Taiwan Strait crises erupted in 1954–55, 1958, and 1995–96.
Today, a Taiwan contingency is the PLA’s lead planning scenario.
China’s military strategies of 1993, 2004, and 2014 focus geographically on Taiwan and its surroundings and emphasize achieving the sophistication necessary to prevail in a contingency potentially involving the U.S. military.

History and geography still matter today.
Although China has now settled its land border disputes with all neighbors save India and Bhutan, its achievements in the maritime domain are mixed.
Leaders under Xi Jinping regard extensive outstanding claims in the “near seas”—the Yellow, East China, and South China Seas—as historical injustices that must ultimately be rectified, thereby demonstrating the CCP’s unique ability to reclaim China’s rightful place.
Beijing has the world’s most numerous, extensive disputed island/feature claims, with the largest number of counterparties.
Foremost among these unresolved sovereignty issues is whether Xi can achieve his goal of bringing Taiwan under CCP control within his time in power.

This is a question of tremendous import for the world, the region, and the PRC’s future strategic space.
It also highlights the direction of Beijing’s thinking.
PRC defense white papers and the “main strategic direction” of the PLA’s doctrine codify a focus on the southeast maritime direction.
Standard wall maps in the PRC understandably center on China, with key geopolitical rivalry extending across the Pacific and various economic interests and ties snaking westward across Eurasia.
The map below by Rhodes captures the world as it looks from Beijing out to the disputed southeastern seaboard and beyond.


Map 2: China Looks East

Even China’s third sea force (after its navy and coast guard), the Maritime Militia, is an integral part of the country’s armed forces with critical peacetime and wartime roles, including in a potential cross-strait amphibious invasion.
All three sea forces are the world’s largest by number of ships.
This seaward surge reflects the confluence of strategic fundaments, the enduring shaping power of geography, and geohistorical implications.
Powered by the world’s second-largest economy and defense budget, China has gone to sea with scale, sophistication, and sea power components that no continental country previously sustained in modernity.
They are supplied by the world’s largest shipyard infrastructure, yielding the fastest expansion of production capacity and largest military buildup since World War II.

On the civilian side of China’s sprawling waterfront, sea power is supplemented by the world’s largest fishing fleet by number of vessels and fishers, commercial fleet by shipping capacity, merchant marine, and marine economy overall.
China also boasts a large nationally flagged tanker fleet and globe-girdling port infrastructure.
Xi, living out previous generations’ dreams to truly develop the “blue economy,”6 is personally guiding China’s transformation into a comprehensive “great maritime power.”7 
Awe-inspiring high-seas capabilities should dispel any remaining illusions that China is a hidebound continental power paying lip service to maritime affairs.

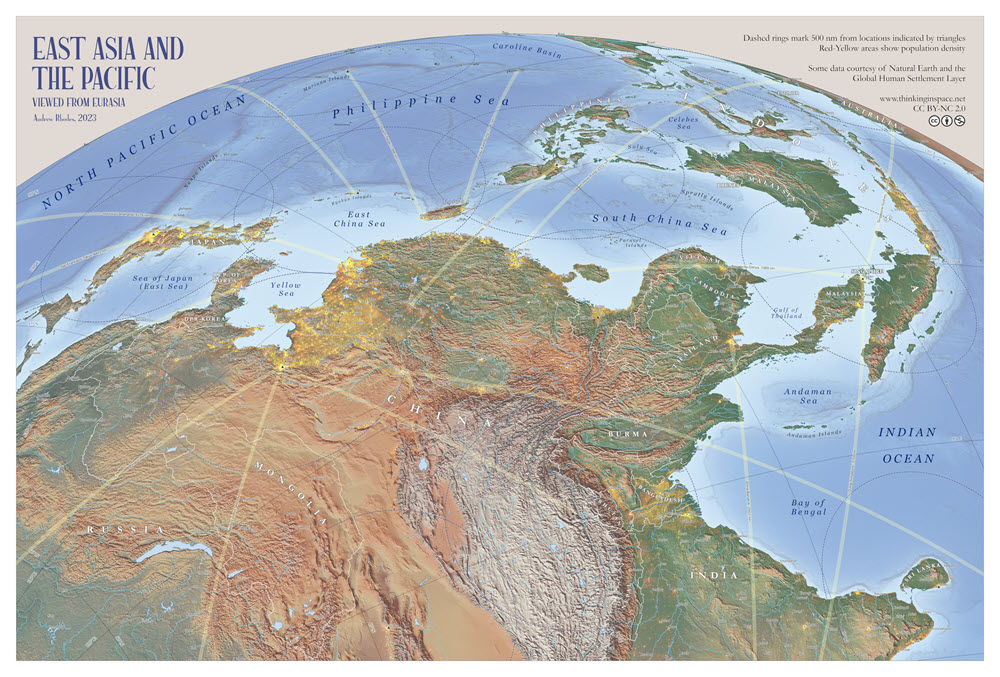
China’s Evolving Maritime Geography


For all this progress, comparing and contrasting PRC military strategies and capabilities as they apply to the “near seas” versus the “far seas,” the airspace above, and the related and supporting capabilities in other domains reveals persistent gradients.
PRC naval strategy and attendant changes in warfare area capabilities have evolved over successive eras, with greater responsibilities in each new phase adding a new layer to the previous core.8 
While the innermost core of “near seas active defense,” established in 1985, retains priority, Xi Jinping added a “far seas protection” strategy in 2015.
Moreover, since around 2019 the PLA Navy has pursued an emerging combination of “near seas defense, far seas protection, [global] oceanic presence, and expansion into the two poles.”9

Already China and its military have achieved a status and confidence unseen in nearly two centuries and unprecedented in sophistication and geographic scope—going, literally and figuratively, where elements of Chinese state power never went before.
This enables production and projection of military power in unprecedented ways.
The extent to which China can deliver force sustainably over increasing distances to further its burgeoning interests is one of the key questions of 21st-century geopolitics—with major consequences for Beijing’s role and footprint in the world and for U.S. and allied interests.

Here, as in so many areas, much depends on topic and framing.
As a consequential leader taking China in a more determined and dangerous (for neighbors, the United States, and other potential opponents) direction with regard to military issues than his post-Mao predecessors did, or a baseline alternative paramount leader likely would, Xi himself matters significantly.
China’s first navalist leader, having in 2018 called for a “world-class navy,”10 he is a personalist strongman pursuing a personality cult and historical legacy in the same league as that which Mao attained before the Cultural Revolution.
All these factors drive China harder and faster in military maritime development than they would have without Xi.11

Geographic constraints still matter, but somewhat less, and differently.
They are not static and unchallenged: how they manifest, and to what extent, evolves constantly.
One significant source of change is geoengineering.
Long ago, constructing the Great Wall and Grand Canal fundamentally reshaped Chinese strategic space, with maritime implications.12 
Under Xi, China in 2014 began engineering an extraordinary externalization of its coastal defense posture through extreme augmentation and fortification of features it occupies in the South China Sea.
Similarly impactful is the country’s growing presence in a vast network of PRC-developed and -funded ports, including some offering naval access.
China’s establishment of its first overseas military facility in Djibouti has been followed quietly in Ream, Cambodia, with a portfolio of other locations under consideration.

Since the Cold War, the Pacific Islands have evolved for China as barriers, springboards, benchmarks, and now vectors of influence and disruption of U.S. power projection.
Acute Pacific land scarcity makes these “chains” of islands encircling the Eurasian landmass strategically pivotal for great powers contending for mastery over the region.
While imperial Japan and Germany had strategic conceptions in this regard, it was Douglas MacArthur who formally linked the “chain of islands” to U.S. constraint of Communist hostility.13 
A decade ago, Du Wenlong, a senior researcher at the PLA Academy of Military Science, declared the PRC’s success in escaping such strategic confinement: “The Chinese navy has the capability to cut the first island chain into several pieces.
Now the chain is fragmented.”
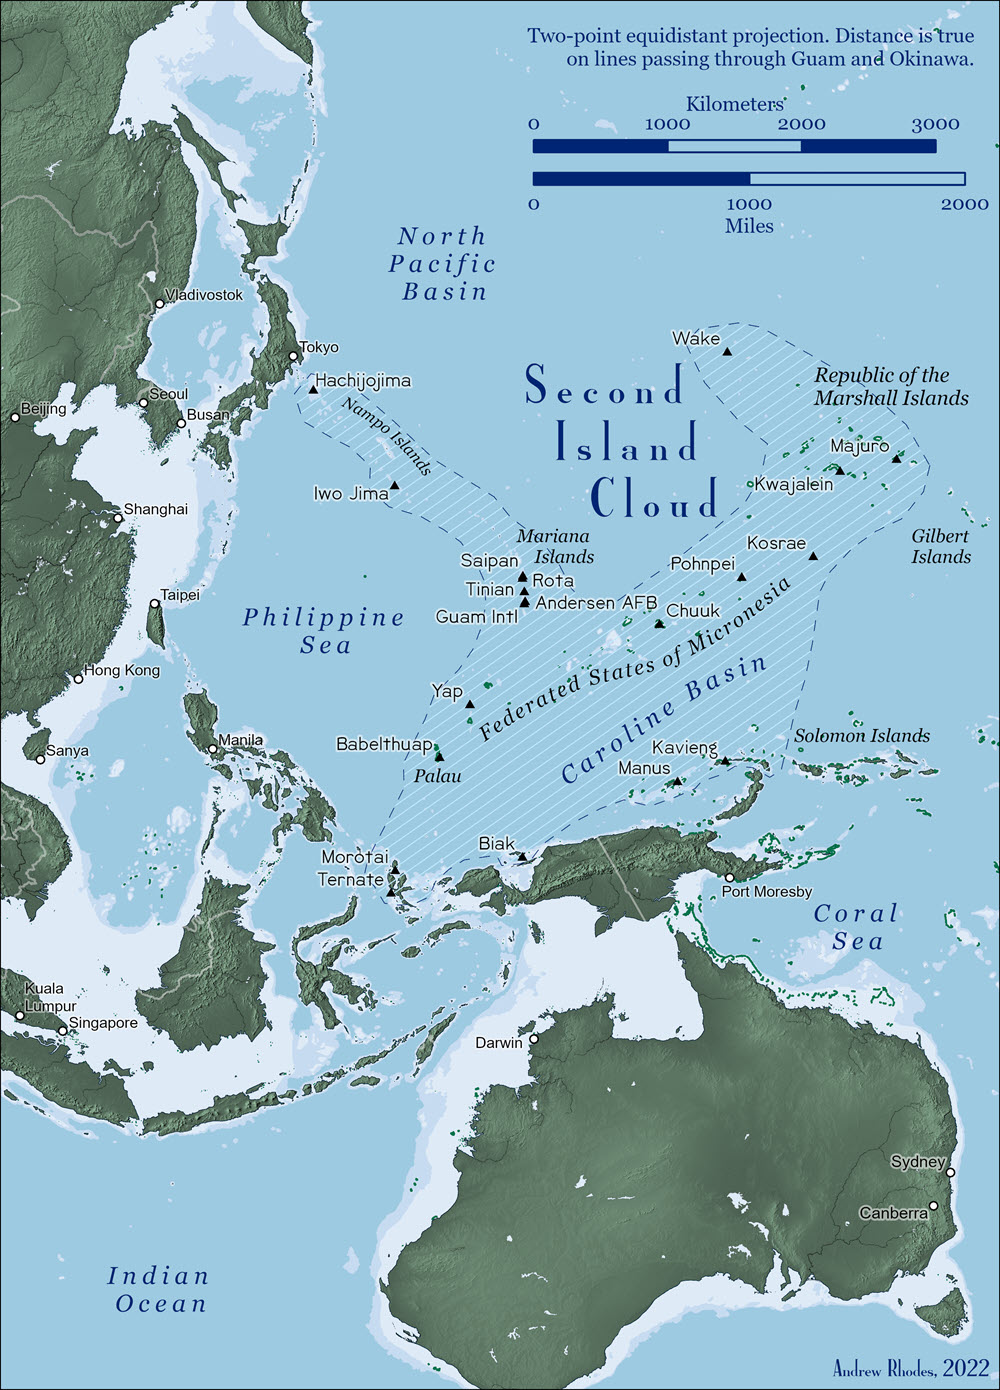
14

In 1921, Marine Corps Lieutenant Colonel “Pete” Ellis observed that the area east of what PRC strategists subsequently termed the second island chain, traversing Guam and the Marshall, Caroline, and Palau Islands, formed “a ‘cloud’ of islands stretching east and west.”15 
Just as PRC strategists discovered and repurposed island chains as China became able to project power out to, and then through, them, PRC strategists may well embrace an even broader “second island cloud” concept as PRC activities vis-à-vis Pacific Island countries increase and diversify.
Rhodes’s map below offers a decided improvement over the truncated island chain maps in the Pentagon’s annual reports on China’s military power and a fitting supplement to the PLA Navy’s more extensive tracing of these strategic features.16 
 

Map 3: The “Second Island Cloud”

Beyond the island chains, the PRC’s geographic weightings defy enduring precision.
A leading 2013 publication contains a section on the need to “expand [China’s] strategic space.”17 
A subsection advocates a subsequent layer of PLA Navy emphases: “expanding to the two oceans” (the Pacific and Indian) as well as adjoining littoral regions, a preponderance of global water space akin to the U.S. Indo-Pacific Command’s vast jurisdiction.18 
It also mentions the Atlantic Ocean, Mediterranean Sea, and Arctic Ocean.19 
This Indo-Pacific construct subsequently faded from official documents but endures in some serious sources.
“The Pacific Ocean issue is the key to whether China’s maritime territorial rights and interests can be secured,” a 2020 article advocating a “two ocean strategy” maintains, “while the Indian Ocean is more about being the transportation artery for the development of China’s economy and production.”20

Hu Bo, a scholar at Peking University, articulates a “hierarchy of national interests” far more systematically than the PRC’s intentionally vague official statements.
As his matrix presented in the table below illustrates, however, overlapping priorities resist clear-cut geographic demarcation.


Overall, available PRC writings suggest a tentative prioritization of maritime spheres: 
(1) near seas and first island chain, 
(2) waters out to the second island chain, 
(3) the western Pacific out to a third island chain bisecting Hawaii and the northern Indian Ocean,
(4) the Atlantic Ocean, Mediterranean Sea, and Arctic Ocean, and
(5) beyond.
Few sources explicitly delineate such layers, but few, if any, disagree.21

Additionally, Beijing may advance dramatically in “new strategic frontiers,” where it enjoys particular room for maneuver as rival powers struggle to invest the requisite resources to compete in less-established areas featuring extreme conditions.
China is already attempting to achieve a more comprehensive, active presence globally, including in geophysically extreme zones of particular importance, such as sea depths and the seabed, outer space, and the Arctic and Antarctic.
Major General Xiao Tianliang emphasizes that “the view of time and space in war has undergone profound changes…the battlespace is expanding rapidly….
Space and cyberspace have become new commanding heights of military competition.”22 
The map below projects Beijing’s maritime priorities geographically.
It illustrates the aforementioned maritime strategic zones and offers the best official depiction available of key Maritime Silk Road sea lanes in Xi’s BRI.23 
It also plots the PLA Navy’s current bases as well as potential future first-priority and second-priority ports that might conceivably offer special access and support.24
 
Map 4: China’s Evolving Maritime Priorities 

Constraints on China’s Power in the Maritime Domain

China is developing capabilities to project power globally and throughout emerging domains.
It does so multifariously, including through enhanced overseas presence and activities in order to secure citizens, assets, and access to material resources while attempting to circumvent or neutralize chokepoints.
Beijing may well make considerably greater strides worldwide and muster forces with robust global influence and reach.
Indeed, Xi’s call for a “world-class navy” by 2049 demands no less.

However, China’s geography and political system impose an unusually severe power-distance (“loss of strength”) gradient.
Radiation out into contested spaces and domains increases reliance on vulnerable land facilities, other fixed support points, and concentrated platforms such as carriers.
China’s homeland supports a dense network of potent counter-intervention capabilities, but the intensity with which it is incentivized and able to project military power attenuates markedly with distance from shore.
Beijing has progressively less reason to project power maximally at longer ranges, particularly under potentially contested conditions.

In the maritime domain, in particular, chokepoints and barriers—many with proximate U.S., allied, and partner military facilities and presence—are another hindrance to China projecting peak power even farther from its shores.
Analysts at the PLA Naval Research Institute acknowledge that, “according to the law of diminishing marginal utility, the strategic power that Chinese sea power can exert in the Indian Ocean is extremely limited.”
Moreover, “the sea routes by which China can enter the Indian Ocean are extremely narrow: China must choose from a very small number of straits such as the Strait of Malacca and the Strait of Sunda, which are very easily blockaded and controlled.”25 
It is not just a matter of distance or power gradients; geography still matters greatly.
Projecting power outward in some directions, or through some straits and potential chokepoints, may be much harder than in others.26

Closer to home, rising domestic expectations and Beijing’s need for popular legitimacy amid economic volatility, an economic slowdown, or other setbacks may motivate both geostrategic retrenchment and increased reliance on nationalism.
Along virtually any strategic trajectory that China might follow, cross-strait security seems far from guaranteed.
This much is clear: at a time when China under Xi Jinping is unprecedently powerful in the maritime domain, Taiwan is increasingly targeted and vulnerable.
 
Links :

Tuesday, June 10, 2025

The plastic legacy at the bottom of the planet


From Pulse by British Antarctic Survey

At the bottom of the world, where few humans have ever set foot, an unwelcome visitor has arrived.
Antarctica – the vast, frozen wilderness of ice and snow – is no longer untouched by humanity’s most persistent pollutant: plastic.


The continent we often imagine as Earth’s last unspoiled frontier now bears the invisible fingerprints of our throwaway culture.
Researchers have documented microscopic fragments of plastics, not just in Antarctica’s snow and surrounding waters, but deep in the Southern Ocean and within the bodies of the marine life that calls these frigid waters home.

"Part of the challenge is that plastic is not just one type of pollutant," explains Emily Rowlands, a marine ecologist at British Antarctic Survey.
"It's a whole suite of different polymers that have different impacts on animals when they're ingested, and they can all interact differently in the environment."

Emily should know.
Her research delves into the impacts of plastic pollution, particularly how it interacts with other climate stressors and affects the ocean's ability to sequester carbon in the deep sea – a critical process in our planet's climate regulation.
As she and her colleagues continue measuring humanity's plastic footprint in this remote sanctuary, a question emerges: can understanding where plastic is help us reduce its devastating effects before it's too late?

 
Dr Emily Rowlands out on sea ice near the RRS Sir David Attenborough for sampling work.
 
An invisible invasion

Picture a grain of sand.
Now imagine something 2,000 times smaller – invisible to the naked eye.
That's a nanoplastic particle, the smallest form of plastic pollution.
Its slightly larger cousin, microplastic (less than 5mm in diameter), can result from larger plastic items breaking down or be intentionally produced, like the microbeads once common in cosmetic products.

While previous studies had found microplastics in the Southern Ocean – typically at lower concentrations than other seas – a discovery in early 2025 shocked even expert research teams.

As part of the CUPIDO project led by Dr Clara Manno, Emily and other BAS scientists reported finding microplastics in snow near some of Antarctica's most remote field camps: Union Glacier, Schanz Glacier and even at the South Pole itself.
Their methodology was painstaking.
Snow samples were carefully collected, melted and filtered through fine paper.
The particles captured were then analysed using high-resolution infrared techniques capable of identifying plastics as small as a red blood cell (11 micrometres).

What they found was troubling: three common plastic types – polyamide used in textiles, polyethylene terephthalate found in bottles and packaging, polyethylene known for durability – along with synthetic rubber.
All were present at much higher levels than anticipated, the highest concentrations that these plastics had been documented in such remote locations.

Interestingly, at a control site distant from research facilities, polyamide was absent, suggesting some contamination comes from researchers themselves – perhaps from clothing fibres, ropes or marker flags.
"More needs to be done to understand the sources of plastic pollution on this beautiful continent," Emily says.
"Finding a human plastic legacy in the snow in the most remote region of our planet underlines the need for nations to collaborate to enforce global plastic mitigation strategies."


From krill to whales: plastic in the food chain

Most people remember the haunting images from BBC's Blue Planet II – a turtle trapped in plastic, a stillborn whale – that catapulted plastic pollution into public consciousness in 2018.
Since then, research publications on ocean plastic debris have increased more than fivefold according to UNESCO.

But the plastic problem extends far beyond these iconic species to the microscopic foundation of Antarctica's marine ecosystem.
In 2023, BAS scientists discovered microplastics in the two most abundant Antarctic zooplankton: krill and salps.
These tiny creatures – krill (which resemble tiny shrimps) and salps (transparent, barrel-shaped invertebrates) – mistake microplastics for food while grazing on phytoplankton of similar size.

This sends ripples through the entire Antarctic food web.
Krill are the primary food source for whales, penguins and seals, while salps are consumed by certain fish and marine birds.
As plastic enters these organisms at the bottom of a short food chain, it likely transfers up the food chain to the region's iconic wildlife.

Laura Wilkie Johnston, a marine biologist and PhD student who led the study, recalls the moment her team confirmed their suspicions after after examining the digestive tracts of krill and salps collected off the coasts of South Georgia and Coronation Island.

Euphausia superba, better known as krill (Credit: Pete Bucktrout | British Antarctic Survey)

"Our discovery raises significant ecological concerns," she says.
"These species play an integral role in the Southern Ocean ecosystem and we don't understand the impact microplastics have on them or the overall environment.
"We long believed that because of their remoteness, the Poles were less at risk from plastic pollution compared with elsewhere on our planet, so it is really quite shocking to have found evidence of it in such abundant life in Antarctic waters."

The climate connection

The story of plastic in Antarctica isn't limited to its effect on wildlife.
There's an unexpected climate twist that few outside scientific circles have considered.

Krill might be tiny individually, but collectively they equal approximately the same biomass as humans on Earth.
These little creatures serve as mighty carbon processors.
When they eat, digest and excrete phytoplankton in massive quantities, they help lock away atmospheric CO₂ in the Southern Ocean's depths.
This natural carbon sequestration service is now under threat.
The CUPIDO project team discovered that nanoplastics may alter the density of krill “faecal pellets”, reducing their ability to carry carbon to the ocean floor.
In effect, plastic isn't just harming the animals – it's compromising one of nature's mechanisms for fighting climate change.

In laboratory conditions, the BAS plastic team has observed how different ocean stressors compound each other.
When comparing krill embryo development under different scenarios: clean water, water with plastic pollution, water with increased acidity, and water with both pollutants.
Perhaps unsurprisingly, those exposed to both stressors fared worst.
The embryos in clean water, predictably, showed the healthiest development.


Mapping the invisible threat

In a region already facing rapid climate change, understanding how plastic pollution interacts with other environmental stressors has become a matter of urgency.

Aidan Hunter, an ecological modeller at BAS, has pioneered a new approach to this complex problem.
As part of the CUPIDO project, he's created the first comprehensive map of microplastic threats in the Southern Ocean, identifying ecological hotspots where monitoring and mitigation efforts should be concentrated.

His innovative modelling technique overlays multiple datasets – krill distribution, phytoplankton presence, sea surface temperature and pH, shipping routes, research station activities, and existing microplastic measurements – to reveal where krill and plankton are most likely to encounter local plastic emissions, and where these emissions might worsen other environmental changes.
"We wanted to provide information to policymakers and environmental managers so they can prioritise and formalise efforts to monitor and mitigate plastic pollution," Aidan explains.
"The remoteness of this region makes monitoring a challenge, so by identifying where plastics are most likely to interact with the animals at the bottom of the food chain, we can maximise the value of sampling and research."

This ground-breaking mapping effort, accompanied by an interactive online application, allows researchers to continue tracking impacts as microplastic pollution intensifies alongside other environmental stressors.


A not-so-pristine paradise

With no proven techniques for removing plastics from the environment at scale, and global plastic production continuing to rise, Antarctica's plastic problem presents a sobering reality check about humanity's reach.

The scientists who spend their careers studying this remote continent find themselves in the bittersweet position of documenting its contamination, while working to understand and perhaps mitigate the damage.
Their research offers our best hope for protecting what remains of this once-pristine wilderness.

Monday, June 9, 2025

Going with the flow: visualizing ocean currents with ECCO

This data visualization showing ocean currents around the world uses data from NASA’s ECCO model, or Estimating the Circulation and Climate of the Ocean.
The model pulls data from spacecraft, buoys, and other measurements. 
Credits: Kathleen Gaeta Greer/ NASA’s Scientific Visualization Studio
Composed by James Riordon / NASA’s Earth Science News Team

From NASA by Nadya Vinogradova Shiffer, Dimitris Menemenlis, Ian Fenty, and Atousa Saberi. 


Historically, the ocean has been difficult to model.
Scientists struggled in years past to simulate ocean currents or accurately predict fluctuations in temperature, salinity, and other properties.
As a result, models of ocean dynamics rapidly diverged from reality, which meant they could only provide useful information for brief periods.

In 1999, a project called Estimating the Circulation and Climate of the Ocean (ECCO) changed all that.
By applying the laws of physics to data from multiple satellites and thousands of floating sensors, NASA scientists and their collaborators built ECCO to be a realistic, detailed, and continuous ocean model that spans decades.
ECCO enabled thousands of scientific discoveries, and was featured during the announcement of the Nobel Prize for Physics in 2021.

NASA ECCO is a powerful integrator of decades of ocean data, narrating the story of Earth’s changing ocean as it drives our weather, and sustains marine life.

The ECCO project includes hundreds of millions of real-world measurements of temperature, salinity, sea ice concentration, pressure, water height, and flow in the world’s oceans.
Researchers rely on the model output to study ocean dynamics and to keep tabs on conditions that are crucial for ecosystems and weather patterns.
The modeling effort is supported by NASA’s Earth science programs and by the international ECCO consortium, which includes researchers from NASA’s Jet Propulsion Laboratory in Southern California and eight research institutions and universities.

The project provides models that are the best possible reconstruction of the past 30 years of the global ocean.
It allows us to understand the ocean’s physical processes at scales that are not normally observable. 
 
view video

ECCO and the Western Boundary Currents

Western boundary currents stand out in white in this visualization built with ECCO data.
Download this visualization from NASA Goddard’s Scientific Visualization Studio.
Credits: Greg Shirah/NASA’s Scientific Visualization Studio

Large-scale wind patterns around the globe drag ocean surface waters with them, creating complex currents, including some that flow toward the western sides of the ocean basins.
The currents hug the eastern coasts of continents as they head north or south from the equator: These are the western boundary currents.
The three most prominent are the Gulf Stream, Agulhas, and Kuroshio. 

The North American Gulf Stream as illustrated with the ECCO model.
video
Credits: Greg Shirah/NASA’s Scientific Visualization Studio


Seafarers have known about the Gulf Stream — the Atlantic Ocean’s western boundary current — for more than 500 years.
By the volume of water it moves, the Gulf Stream is the largest of the western boundary currents, transporting more water than all the planet’s rivers combined.

In 1785, Benjamin Franklin added it to maritime charts showing the current flowing up from the Gulf, along the eastern U.S. coast, and out across the North Atlantic.
Franklin noted that riding the current could improve a ship’s travel time from the Americas to Europe, while avoiding the current could shorten travel times when sailing back.

 
A visualization built of ECCO data reveals a cold, deep countercurrent that flows in the opposite direction of the warm Gulf Stream above it. 
video
Credits: Greg Shirah/NASA’s Scientific Visualization Studio


Franklin’s charts showed a smooth Gulf Stream rather than the twisted, swirling path revealed in ECCO data.
And Franklin couldn’t have imagined the opposing flow of water below the Gulf Stream.
The countercurrent runs at depths of about 2,000 feet (600 meters) in a cold river of water that is roughly the opposite of the warm Gulf Stream at the surface.
The submarine countercurrent is clearly visible when the upper layers in the ECCO model are peeled away in visualizations.

The Gulf Stream is a part of the Atlantic Meridional Overturning Circulation (AMOC), which moderates climate worldwide by transporting warm surface waters north and cool underwater currents south.
The Gulf Stream, in particular, stabilizes temperatures of the southeastern United States, keeping the region warmer in winter and cooler in summer than it would be without the current.
After the Gulf Stream crosses the Atlantic, it tempers the climates of England and the European coast as well. 

The Agulhas current originates along the equator in the Indian Ocean, travels down the western coast of Africa, and spawns swirling Agulhas rings that travel across the Atlantic toward South America. 
video
Credits: Greg Shirah/NASA’s Scientific Visualization Studio


The Agulhas Current flows south along the western side of the Indian Ocean.
When it reaches the southern tip of Africa, it sheds swirling vortices of water called Agulhas Rings.
Sometimes persisting for years, the rings glide across the Atlantic toward South America, transporting small fish, larvae, and other microorganisms from the Indian Ocean.

Researchers using the ECCO model can study Agulhas Current flow as it sends warm, salty water from the tropics in the Indian Ocean toward the tip of South Africa.
The model helps tease out the complicated dynamics that create the Agulhas rings and large loop of current called a supergyre that surrounds the Antarctic.
The Southern Hemisphere supergyre links the southern portions of other, smaller current loops (gyres) that circulate in the southern Atlantic, Pacific, and Indian oceans.
Together with gyres in the northern Atlantic and Pacific, the southern gyres and Southern Hemisphere supergyre influence climats while transporting carbon around the globe.
 
The Kuroshio Current flows on the western side of the Pacific Ocean, past the east coast of Japan, east across the Pacific, and north toward the Arctic.
Along the way, it provides warm water to drive seasonal storms, while also creating ocean upwellings that carry nutrients that sustain fisheries off the coasts of Taiwan and northern Japan. 
video
Credits: Greg Shirah/NASA’s Scientific Visualization Studio


In addition to affecting global weather patterns and temperatures, western boundary currents can drive vertical flows in the oceans known as upwellings.
The flows bring nutrients up from the depths to the surface, where they act as fertilizer for phytoplankton, algae, and aquatic plants.

The Kuroshio Current that runs on the west side of the Pacific Ocean and along the east side of Japan has recently been associated with upwellings that enrich coastal fishing waters.
The specific mechanisms that cause the vertical flows are not entirely clear.
Ocean scientists are now turning to ECCO to tease out the connection between nutrient transport and currents like the Kuroshio that might be revealed in studies of the water temperature, density, pressure, and other factors included in the ECCO model.
 
Tracking Ocean Temperatures and Salinity

When viewed through the lens of ECCO’s temperature data, western boundary currents carry warm water away from the tropics and toward the poles.
In the case of the Gulf Stream, as the current moves to far northern latitudes, some of the saltwater freezes into salt-free sea ice.
The saltier water left behind sinks and then flows south all the way toward the Antarctic before rising and warming in other ocean basins.

 Colors indicate temperature in this visualization of ECCO data.
Warm water near the equator is bright yellow.
Water cools when it flows toward the poles, indicated by the transition to orange and red shades farther from the equator. 
video
Credits: Greg Shirah/NASA’s Scientific Visualization Studio


Currents also move nutrients and salt throughout Earth’s ocean basins.
Swirling vortexes of the Agulhas rings stand out in ECCO temperature and salinity maps as they move warm, salty water from the Indian Ocean into the Atlantic.

The Mediterranean Sea has a dark red hue that indicates its high salt content.
Other than the flow through the narrow Strait of Gibraltar, the Mediterranean is cut off from the rest of the world’s oceans.
Because of this restricted flow, salinity increases in the Mediterranean as its waters warm and evaporate, making it one of the saltiest parts of the global ocean.
Credits: Greg Shirah/NASA’s Scientific Visualization Studio 

Experimenting with ECCO

ECCO offers researchers a way to run virtual experiments that would be impractical or too costly to perform in real oceans.
Some of the most important applications of the ECCO model are in ocean ecology, biology, and chemistry.
Because the model shows where the water comes from and where it goes, researchers can see how currents transport heat, minerals, nutrients, and organisms around the planet.

In prior decades, for example, ocean scientists relied on extensive temperature and salinity measurements by floating sensors to deduce that the Gulf Stream is primarily made of water flowing past the Gulf rather than through it.
The studies were time-consuming and expensive.
With the ECCO model, data visualizers at NASA’s Goddard Space Flight Center in Greenbelt, Maryland, virtually replicated the research in a simulation that was far quicker and cheaper.

A simulation built with data from the ECCO model shows that very little of the water in the gulf contributes to the water flowing in the Gulf Stream.
video
Credits: Atousa Saberi/NASA’s Scientific Visualization Studio


The example illustrated here relies on ECCO to track the flow of water by virtually filling the Gulf with 115,000 particles and letting them move for a year in the model.
The demonstration showed that less than 1% of the particles escape the Gulf to join the Gulf Stream.

Running such particle-tracking experiments within the ocean circulation models helps scientists understand how and where environmental contaminants, such as oil spills, can spread.
 
Take an ECCO Deep Dive

Today, researchers turn to ECCO for a broad array of studies.
They can choose ECCO modeling products that focus on one feature – such as global flows or the biology and chemistry of the ocean – or they can narrow the view to the poles or specific ocean regions.
Every year, more than a hundred scientific papers include data and analyses from the ECCO model that delve into our oceans’ properties and dynamics.

Links :

Sunday, June 8, 2025

Smallest area to lay claim to nation status : Sealand principality


From Guinness World records
  • SEALAND
  • 1,300 SQUARE METRE(S)
  • UNITED KINGDOM (SEALAND)
  • 1966
During the Second World War, the British government built a fort (Roughs Tower) on the High Seas 11 km (7 miles) off the east coast of the United Kingdom, which was a base for radar, heavy armament and about 200 service personnel, to guard and protect the approaches to the Thames Estuary. 

Essentially it is a landing platform measuring 1,300 m² (13,990 ft), connected to the sea-bed by concrete pillars.
 
Localization with the GeoGarage platform (UKHO nautical raster chart)

Following the war, the island remained derelict until 1966, when a British family took possession and declared the Principality (or Duchy) of Sealand and spent many years struggling to have their claim recognised, arguing that most major European states and international lawyers have declared that Sealand fulfilled all the legal requirements for a state, and that the sovereignty of Sealand was absolute and unquestionable.

The occupiers produced their own constitution, flag, national anthem, currency – the Sealand dollar - and passports (by 1975, 106 persons possessed 'citizenship of Sealand').

It was put up for sale in 2007 and this has now raised again the question of the legal status of the Principality.

It has declared itself a tax free zone and there are no gaming restrictions of customs duties.
 
Links :