Philippines government to take 1734 document to UN tribunal to support its demand that China leaves the Scarborough Shoal
A 281-year-old map from the collection of an English duke is to be put forward by the government of the Philippines to support its claim to islands in the South China Sea that are presently being fortified by China.
The Philippines government has said it will submit the map, drawn up in Manila in 1734 by Pedro Murillo Velarde, a Jesuit priest, to the United Nations Tribunal on the Law of the Sea in The Hague as soon as this week, according to the Vera Files website.
The map shows islands that are now known as Scarborough Shoals, marked as Panacot, as part of Philippines territory.
They are shown around 120 miles off the west coast of the main Philippine island of Luzon.
The map shows islands that are now known as Scarborough Shoals, marked as Panacot, as part of Philippines territory.
They are shown around 120 miles off the west coast of the main Philippine island of Luzon.
The map shows islands that are now known as Scarborough Shoals, marked as Panacot, as part of Philippines territory (Library of Congress)
The Philippine government is calling on the UN to recognise its claim to sovereignty over the islands and to call on Beijing to withdraw.
The map was sold at Sotheby's auction house in London in November at the request of the Duke of Northumberland.
The duke sold the map, along with around 80 other family heirlooms, after serious flooding affected his properties in April 2012. Media reports suggested that the duke faced a repair bill for £12 million after the waters subsided.
The map was put up for auction on November 4, with the Sotheby's catalogue describing the 44-inch by 47-inch engraved map as being "the first scientific map of the Philippines" of its time.
With light browning along the creases, the map is flanked by a series of 12 engravings depicting people in native costumes, a map of the island that is today known as Guam and smaller maps of cities and harbours in the Pacific.
Sotheby's estimated that the item would sell for between £20,000 and £30,000, but it quickly outstripped those predictions and was eventually sold for £170,500 to a Filipino businessman.
Mel Velarde, president of an information technology company called Now Corporation, said he first became interested in the map because he shared a family name with the priest who had first published it.
He told the Vera Files that his interest increased when he realised that it "proved" the Philippines' claim to the islands.
The bidding quickly reached the £80,000 limit that Mr Velarde had initially set himself.
But after a "vision" of Chinese soldiers occupying the islands, Mr Velarde said it "became a personal crusade" to buy the map because the Philippines' claim needs to be backed up by evidence.
Asked why he had paid so much for the map, Mr Velarde said, "There's a bully in the neighbourhood. He already took over our land."
Mr Velarde has decided to donate the original map to the National Museum but has had a number of copies printed.
He will present one of those copies to Benigno Aquino, the president of the Philippines, on June 12, the anniversary of the nation's independence.
Another copy will be delivered to the UN as Manila seeks arbitration in the territorial dispute.
The Philippines accuses China of seizing the islands in 2012, when ships of the two nations were involved in a stand-off.
When the smaller Philippine force had to withdraw, the Chinese occupied the islands.
In January 2013, the Philippines requested international arbitration in the case and, the following year, submitted a 4,000-page dossier to support its claim of sovereignty.
Beijing has ignored requests to take part in arbitration procedures.
Links :
CBSNews : A wealth of stories from the Murillo-Velarde map
World exclusive - filmed for the first time at Plymouth Marine
Laboratory, we dyed microscopic pieces of plastic with fluorescent dye
so you can see them being ingested by the plankton - scary stuff.
The effect of plastic microbeads, as found in toothpaste and
exfoliants, on microscopic marine life is unknown -- but we know now
that the substance is likely ingested by zooplankton along with their
diet of phytoplankton, thanks to a video by a team of filmmakers led by
Verity White of Five Films.
An
estimated 8 million metric tons of plastic makes its way into the
oceans every year, according to a study conducted by researchers at the
UC Santa Barbara National Center for Ecological Analysis and Synthesis, published in the journal Science
early this year.
Somewhere between 6,350 and 245,000 metric tons of tha
plastic is floating -- which means the rest of it ends up somewhere
beneath the surface.
And it's not all plastic bottles, six-pack rings and fishing
nets.
A lot of the plastic that ends up in the ocean comes from the
plastic microbeads
found in body wash and other personal care products.
Other discarded
plastics degrade pretty quickly, eroding into very small fragments.
And,
while it is estimated that plastics cause the death of over a million
seabirds and 100,000 marine mammals every year, the effect it has on
life under the ocean is difficult to gauge.
Zooplankton and flourescent plastic microbeads. Screenshot by Michelle Starr/CNET
The Plymouth Marine Laboratory
in Plymouth, England is studying the impact these microplastics have on
marine life, with a particular focus on zooplankton.
It was at the PML
that White and her team shot the film.
The action takes
place in a single drop of water over the course of about three hours,
condensed down into less than a minute of footage, reports New Scientist.
Several copepods -- a type of zooplankton -- were surrounded by microscopic fluorescent polystyrene beads.
Copepods
feed by moving their legs to direct food towards their mouths.
While
they can reject the wrong type of phytoplankton (algae), the film
clearly shows some of the beads get caught up and ingested by the
animals.
This can cause problems for the zooplankton, as
the plastic can remain in their bodies for up to seven days.
This
negatively impacts the rate at which the zooplankton can consume algae,
which in turn could impact their ability to survive.
This,
according to the film, is a cause for concern not just for the
zooplankton, but for other species as well. Zooplankton are at the
bottom of the food chain, so if zooplankton populations drop, the
animals that eat zooplankton will have a harder time finding food.
Moreover, what zooplankton ingest often ends up ingested by their
predators, all the way to the top of the food chain.
The
Plymouth Marine Laboratory has released this week a suite of videos and
other educational materials on the impact of microplastics on the ocean.
Sailors and travellers, including Charles Darwin aboard HMS Beagle, have often reported seeing "ballooning" spiders flutter from the air into the sails of their ships, far away from any shore.
Dispersing spiders are known to use strands of silk to remain airborne in gusts of wind, but what happens if they are swept offshore and land in water?
We thought they would drown, but it turns out they are as adept at sailing as they are aeronautics.
"It was like an illusion," says Morito Hayashi of London's Natural History Museum, who first noticed common UK spider species sailing in the lab.
He was studying their flight, trying to figure out how they take off when he spotted the sailing behaviour.
"I was amazed that these common spiders, found in everyone's gardens, had such skilful sailing behaviour that no one had noticed before."
Water tolerance and tiptoeing.
The relationship between tiptoeing, sailing and the ability to float on water.
All
tiptoeing individuals were also sailors, except for two individuals,
suggesting that the sailing behaviour is almost completely associated
with, and possibly a requirement for, the aeronautic behaviour
"One of the most amazing things is that no one had noticed this behaviour before," says his colleague Sara Goodacre of the University of Nottingham, UK.
Some species of spider form diving bells out of silk to enable them to breathe under water, while others are known to catch and eat fish.
But until now, no one realised that common
spiders can sail, probably because the species that do it are small,
typically just a couple of millimetres long.
"Water was always thought to be the
ultimate barrier to dispersion," says Goodacre.
"Now, we know they can
survive in water, so with this get-out-of-jail card, they can move far
greater distances than we thought."
To find out how they do it, Goodacre,
Hayashi and their colleagues observed the sailing skills of 325 spiders
of 21 species caught at random on islands in ponds and lakes in various
nature reserves around Nottingham in the UK.
Back in the lab, they placed individual
spiders on small water trays and then used small air pumps to expose the
spiders to breezes of between 3 and 80 centimetres per second.
All the spiders were able to stand on
water thanks to their water-repellent legs.
And 201 of them, covering
most species, showed off sailing skills.
Spider behaviour on water surface. Sailing behaviour: linyphiid (a, c) and tetragnathid (b, d) spiders moving on the water surface with their legs (a, b) or abdomen (c, d) used as sails. When the abdomen was used the behaviour was referred to as upside-down sailing. A spider can sail stably even on turbulent sea salt water. Anchoring behaviour: use of silk as anchor to slow down or stop movement on water surface by linyphiids (which dropped the anchoring silk) (e) and the tetragnathid (which dragged the anchoring silk after it caught a floating object) (f). Each scale bar represents 1 mm
Most attempted to catch the wind and cruise forward by making "sails"
from parts of their bodies. Some pointed two forelegs up in a V-shape, while others thrust their abdomen skyward – the
equivalent of a handstand on the water.
When exposed to a breeze on solid ground, they showed
none of the behaviours, which suggests these are used specifically for
sailing.
The spiders sailed just as well on salt and fresh water, and were able to manoeuvre even in turbulent water.
Some also created the equivalent of an
anchor by throwing out strands of silk for attachment to surfaces, such
as the side of the water tray.
They may use these to haul themselves
onto objects from water, or onto a suitable landing spot.
Goodacre thinks that size is a limiting
factor – only those not too heavy can skim across the water – which
means this behaviour is not common.
"I'd say the limit is probably
around 5 millimetres long," she says.
Her team now hopes to show that spiders sail in natural conditions, too.
Also, they want to examine what this means
for evolution and geographic dispersion, given that spiders may be able
to travel much further than thought.
"This may help explain why spiders are among the first species to colonise new habitats like islands," says Stefan Hetz of Humboldt University in Berlin.
"Spiders were thought to colonise exclusively by air; maybe they are good sailors too."
Deep beneath the waves of the Red Sea, scientists have discovered corals that fluoresce in a range of colors, likely because it helps their algae friends.
Deep beneath the surface of the Red Sea, a rainbow of glowing corals have been discovered that's unlike anything scientists have ever seen.
"I was indeed surprised to find such a great color diversity at these greater depths," said Jörg Wiedenmann, a marine biologist at the U.K.'s University of Southampton.
Wiedenmann was especially amazed because the shallow-water corals on the same reef only give off a green color. (See more stunning coral pictures.)
Corals generally get their glow from fluorescent pigments that act as
sunblock.
The sun's intense rays, which can sunburn swimmers and divers
that flock to these reefs, cause similar damage to coral and
zooxanthellae, the symbiotic algae that lives inside coral.
Although bright sunlight at shallow depths can make the pigments hard
to see with the naked eye, they can be visible if the coral makes lots
of them, says Wiedenmann, who led a new study on the corals published June 24 in PLOS ONE.
Though these pigments are well studied, scientists hadn't looked much
at fluorescence in deeper dwelling corals, since they're not as exposed
to sunlight.
Which begs the question: Why were the Red Sea corals so colorful?
Rainbow Bright
In 2014, Wiedenmann teamed up with Israel's Interuniversity Institute for Marine Sciences to study mesophotic reefs—or those reefs that are between 100 feet (30 meters) to more than 330 feet (100 meters) deep—near Eilat, Israel (map).
At these depths, very little sunlight reaches corals.
The few
lightwaves that do make it this far are almost all in the blue range,
the other colors having scattered.
(Also see "As Oceans Heat Up, a Race to Save World's Coral Reefs.")
The fluorescence of this Lobophyllia coral can change from green to red when exposed to blue or ultraviolet light.
Photograph by Professor J Wiedenmann
The researchers found that some of the corals at these depths glowed an intense green or orange. After photographing them in their natural environment, Wiedenmann packed samples of 16 different species of coral into plastic bags and brought them back to his lab in England for further study.
When Wiedenmann illuminated the corals with blue or ultraviolet light—mimicking what's found in the ocean depths—he found that they could also glow red or green.
Interestingly, Wiedenmann also discovered that the corals could produce these pigments in the absence of any light at all.
This, combined with the general lack of sunlight at these depths, means that these pigments weren't acting as a sunscreen.
Instead, the researchers believe that the pigments help make more light for their symbiotic algae, which need it for photosynthesis.
Happy algae translates to more oxygen and other benefits for the coral.
Red Sea corals glow in a rainbow of hues, a process that likely boosts the algae living inside them.
"To me, the most interesting part of the study is the range of colors you can find in very closely related species," Dimitri Deheyn, a marine biologist at the Scripps Institution of Oceanography who wasn't involved in the research.
He expected that similar corals would have similar colors, rather than the array that Wiedenmann found.
The corals' rainbow of hues is more than just a feast for our eyes—they may someday play a role in improving human health.
Wiedenmann says that these pigments could help scientists do
everything from tagging certain types of cells to look at them under the
microscope to helping physicians better see cancer cells in the body.
Usually, when we say
“American slavery” or the “American slave trade,” we mean the American
colonies or, later, the United States.
But as we discussed in Episode 2 of Slate’s History of American Slavery Academy, relative to the entire slave trade, North America was a bit player.
From the trade’s beginning in the 16th century to its conclusion in the 19th,
slave merchants brought the vast majority of enslaved Africans to two
places: the Caribbean and Brazil.
Of the more than 10 million enslaved
Africans to eventually reach the Western Hemisphere, just 388,747—less
than 4 percent of the total—came to North America.
This was dwarfed by
the 1.3 million brought to Spanish Central America, the 4 million
brought to British, French, Dutch, and Danish holdings in the Caribbean,
and the 4.8 million brought to Brazil.
This interactive, designed and built by Slate’s
Andrew Kahn, gives you a sense of the scale of the trans-Atlantic slave
trade across time, as well as the flow of transport and eventual
destinations.
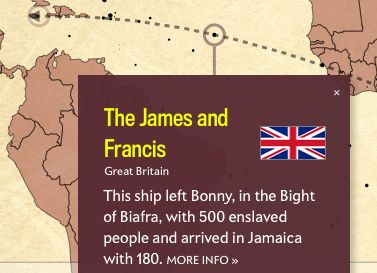
The dots—which represent individual slave ships—also
correspond to the size of each voyage.
The larger the dot, the more
enslaved people on board.
And if you pause the map and click on a dot,
you’ll learn about the ship’s flag—was it British? Portuguese?
French?—its origin point, its destination, and its history in the slave
trade.
The interactive animates more than 20,000 voyages cataloged in
the Trans-Atlantic Slave Trade Database.
(We excluded voyages for which there is incomplete or vague information
in the database.)
The graph at the bottom accumulates statistics based
on the raw data used in the interactive and, again, only represents a
portion of the actual slave trade—about one-half of the number of
enslaved Africans who actually were transported away from the continent.
There are a few trends worth noting.
As the first European
states with a major presence in the New World, Portugal and Spain
dominate the opening century of the trans-Atlantic slave trade, sending
hundreds of thousands of enslaved people to their holdings in Central
and South America and the Caribbean.
The Portuguese role doesn’t wane
and increases through the 17th, 18th, and 19th centuries, as Portugal brings millions of enslaved Africans to the Americas.
West and West-Central Africa were the regions that supplied the majority of the slaves taken across the Atlantic Ocean in all periods of the transatlantic slave trade.
The image is of a map produced by Joan Blaeu in 1662.
It shows the Atlantic coast of Africa stretching from Senegambia to Angola in West-Central Africa. This map was an important source of information for many cartographers and writers trying to better understand the continent and even today it offers important information for historians of Africa.
The image is reproduced courtesy of Tracy W. McGregor Library of American History, Special Collections, University of Virginia Library.
In the 1700s, however, Spanish transport diminishes and is
replaced (and exceeded) by British, French, Dutch, and—by the end of the
century—American activity.
This hundred years—from approximately 1725
to 1825—is also the high-water mark of the slave trade, as Europeans
send more than 7.2 million people to forced labor, disease, and death in
the New World.
For a time during this period, British transport even
exceeds Portugal’s.
In the final decades of the trans-Atlantic slave trade,
Portugal reclaims its status as the leading slavers, sending 1.3 million
people to the Western Hemisphere, and mostly to Brazil.
Spain also
returns as a leading nation in the slave trade, sending 400,000 to the
West.
The rest of the European nations, by contrast, have largely ended
their roles in the trade.
By the conclusion of the trans-Atlantic slave trade at the end of the 19th
century, Europeans had enslaved and transported more than 12.5 million
Africans.
At least 2 million, historians estimate, didn’t survive the
journey.
Until recently, global maps of coral reefs had not changed much since the days of Charles Darwin.
The British scientist created some of the first maps in the 1840s, including observations from his ocean expeditions.
French scientist Louis Joubin updated those maps in 1912, adding information from letters he received from people living near reefs around the world.
But it was not until the beginning of the 21st century that coral
reef mapping caught up with modern technology.
It took the arrival of a
high-quality satellite camera—the Enhanced Thematic Mapper Plus
on Landsat 7—and a convincing argument.
The Landsat series of
satellites was originally created to observe landforms, so imagers on
Landsat 1 through 5 were typically turned off while flying over large
oceans in order to conserve power or limited data storage.
Ocean
researchers eventually made the case to turn the instrument on over
coastal waters and, occasionally, the open ocean.
From 2000 to 2003, scientists participating in the Millennium Global Coral Reef Mapping project collected and analyzed 1,724 Landsat 7 satellite images in order to create a uniform, global map
of coral reefs.
The map has since been distributed openly on the
Internet and has been adopted by researchers and coral reef managers
around the world.
Now the next generation of Earth-observing satellites
is poised to significantly improve and update coral reef mapping.
The
sensors aboard Landsat 8 were designed to have higher sensitivity to
brightness and color than Landsat 7 (12-bit data versus 8-bit). Most
significantly, the satellite can observe Earth in wavelengths that
allows scientists to adjust for the distortions caused by the atmosphere
near the coast (a new shortwave, ultra-blue band at 0.43-0.45
micrometers supplements the blue band at 0.45-0.51 micrometers). This extra sensitivity
has made it easier to spot coral reefs and to quantify their area and
depth.
Scientists now have a tool for monitoring the health of coral
reefs even in the most remote regions.
“The Operational Land Imager on Landsat 8 is allowing us to outline
the reefs around the world and measure area and estimate depth in ways
never possible before,” said Frank Muller-Karger, a professor of
oceanography at the University of South Florida and a leader of the
Landsat-coral mapping efforts.
Muller-Karger has been funded by NASA’s
Applied Sciences to work together with the NOAA Coral Reef Watch program to develop new products for a coral reef alert program.
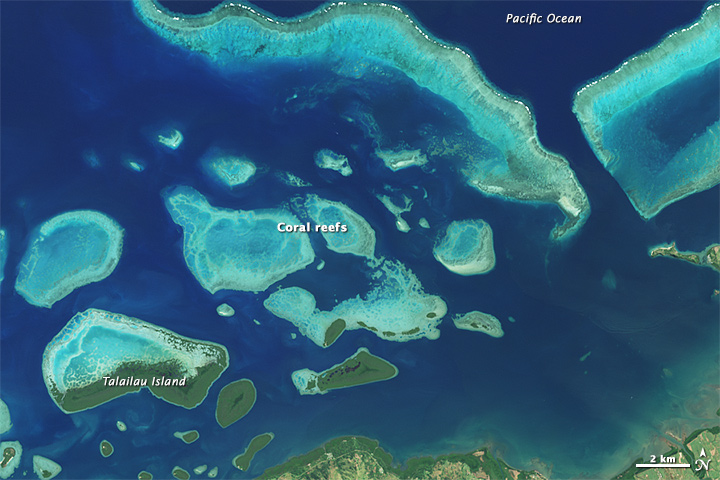
The large image and close-up above were acquired on May 10, 2015, by
the OLI instrument on Landsat 8.
The images show the extensive coral
reefs on the north shore of Vanua Levu, Fiji’s second largest island.
In addition to Landsat, Muller-Karger and colleagues can turn to
several other satellites to measure conditions around reefs.
Satellite
sensors like the Moderate-Resolution Imaging Spectroradiometer (MODIS)
instruments aboard NASA’s Terra and Aqua satellites can sense ocean
temperatures, a key variable in the healthy development of corals.
Similar readings are being collected by the Visible Infrared Imaging
Radiometer Suite (VIIRS) instrument on Suomi NPP and the Advanced Very
High Resolution Radiometer (AVHRR) instruments on NOAA’s Geostationary
Operational Environmental Satellites.
The next big leap in coral studies may come from hyperspectral
imaging.
New instruments tested on satellites, the International Space
Station, and research aircraft have shown the potential to observe at
more wavelengths and much better spatial resolution.
Such sensors might
someday be able to spot minor variations in coral reef color—a sign of
coral bleaching due to warming waters and changing ocean chemistry.
“You need Earth-observing cameras with small pixel sizes that allow a
closer look at the corals. The scale needed is much less than 100
meters,” said Nima Pahlevan, a scientist at NASA’s Goddard Space Flight
Center.
“With VIIRS and MODIS, for example, the best achievable spatial
resolution is 250-500 meters We need instruments capable of resolving
reefs at scales ranging from 1 to 40 meters.”