Saturday, November 11, 2023

World's first whale migration map is revealed: Scientists combine satellite tracking data from 845 animals over the past 30 years to create a chart of their ocean 'superhighways'

Migrating whales travel across "superhighways" every year, facing threats like overfishing and ship strikes.
Crossing various countries and stretches of international waters, their journeys know no boundaries.
Neither should our approach to protecting them!
courtsy of Lewis Pugh Foundation @LewisPughFDN 
 
From DailyMail by Shivali Best 

The map was created by WWF, and shows the ocean 'superhighways' whales use to travel around the globe
Sadly, the map highlights the increasing threats facing whales in the blue corridors they use to migrate
The most significant threat is entanglement in fishing gear and 'ghost nets', according to WWF
WWF is now calling for action by countries to safeguard the marine mammals along their superhighways

Scientists have combined satellite tracking data from 845 whales to create the world's first whale migration map.
The map was created by conservation charity WWF, and shows the ocean 'superhighways' whales use to travel around the globe.

It highlights the increasing threats facing the world's whales in their key habitats and the blue corridors they use to migrate.
WWF is now calling for action by countries to safeguard the marine mammals along their superhighways.

Chris Johnson, who leads the WWF protecting whales and dolphins initiative, said: 'Cumulative impacts from human activities – including industrial fishing, ship strikes, chemical, plastic and noise pollution, habitat loss and climate change – are creating a hazardous and sometimes fatal obstacle course.'

Whales play key roles in maintaining the health of the oceans and fish populations, as well as carbon storage, but six of the 13 great whale species are endangered or vulnerable to extinction despite decades of protection from whaling.

A report by WWF and marine scientists, including from the University of Southampton, Oregon State University and University of California Santa Cruz, details whale migrations and the threats they face along the way.

It draws on satellite tracking data from 845 whales collected over the past 30 years to map how species, including humpbacks, fin and blue whales, travel through oceans from breeding to key feeding grounds.

It highlights the growing dangers they face from human activity, both in their critical habitats and during migration along coasts and across oceans such as the Pacific, Indian and Atlantic, including into UK waters.

The most significant threat to whale and dolphin populations is entanglement in fishing gear and 'ghost nets' which are discarded, lost or abandoned by fishermen, which kills an estimated 300,000 whales a year, the report said.

They also face overfishing which limits their food supplies, increasing ship traffic which raises the risk of being hit by vessels, underwater noise, plastic and chemical pollution and offshore oil and gas drilling.

A handful of countries still hunt whales commercially, and the mammals are also at risk from climate change, which is affecting their prey and migration times and reducing important habitats such as sea ice.

WWF is calling for the international community to work together to deliver comprehensive marine protected areas (MPAs) that overlap national and international 'blue corridors'.
The charity wants to see ships moved away from critical whale habitat and measures to reduce underwater noise and vessel strikes, efforts to eliminate and clean up ghost gear and reduce plastic pollution, and work to end whales being caught as 'bycatch' in fisheries.
 
It says delivering protected blue corridors will help more than whales, who store significant amounts of carbon over their lifetime and whose waste fertilises the ocean, helping maintain populations of other species including commercial fish.

The report points to an assessment from the International Monetary Fund which estimates the intrinsic value of each great whale is more than $2 million (£1.5 million), making the global population worth more than a trillion US dollars (£740 billion).

The global whale-watching industry alone is valued at more than $2 billion (£1.5 billion) annually, the report said.

Dr Simon Walmsley, chief marine adviser at WWF UK, said: 'Gentle giants like fin and humpback whales can be frequent visitors to UK seas, but – as is the case right around the world – our waters are fraught with risk, from fishing gear entanglement to ship strikes to impacts from noise pollution.


Spatial and Seasonal Distribution of American Whaling and Whales in the Age of Sail
All observations of sperm, right, bowhead, gray, and humpback whales.
Daily locations of vessels were extracted from a sample of American whaling logbooks for voyages departing between 1780 and 1920.
Days with no whale observations and days with observations of sperm, right, bowhead, humpback, and gray whales and locations of key ports were distinguished by the colors indicated.
Whalemen from other countries caught whales in many of the same areas and in some areas where American whalemen did not go 
 
Links :

Friday, November 10, 2023

New AI system can map giant icebergs from satellite images 10,000 times faster than humans


From Phys by University of Leeds

Scientists have trained an artificial intelligence (AI) system to accurately map—in one-hundredth of a second—the surface area and outline of giant icebergs captured on satellite images.

The paper, titled "Mapping the extent of giant Antarctic icebergs with Deep Learning," is published in The Cryosphere.

It is a major advance on existing automated systems, which struggle to distinguish icebergs from other features in the image.
Manual—or human—interpretation of the image is more accurate, but it can take several minutes to delineate the outline of a single iceberg.
If that has to be repeated numerous times, the process quickly becomes time-consuming and laborious.

Icebergs have a significant impact on the polar environment and monitoring them is critical for both maritime safety and scientific study.
They can be extremely large—in some cases the size of small countries—and can pose a risk to passing ships.
As they melt, icebergs release nutrients and freshwater into the seas, and this can have an impact on marine ecosystems.

Dr. Anne Braakmann-Folgmann, who led the study while undertaking doctoral research at the Centre for Polar Observation and Monitoring at the University of Leeds, said, "Icebergs exist in hard-to-reach parts of the world and satellites are not only a fantastic tool to observe where they are, they can help scientists understand the process of how they melt and eventually begin to break apart.

"Using the new AI system overcomes some of the problems with existing automated approaches, which can struggle to distinguish between icebergs and other ice floating on the sea or even a nearby coastline which are present in the same image."


Image 1 shows the U-net algorithm correctly identifying the iceberg, which is highlighted in red.
In comparison, the k-means algorithm has incorrectly identified a cluster of smaller icebergs and ice fragments, shown in blue, as one large iceberg.
 Credit: Dr Anne Braakmann-Folgmann and the European Space Agency.
 

Neural network

Dr. Braakmann-Folgmann and her colleagues used an algorithm called U-net—a type of neural network—to "train" a computer to accurately map the outline of icebergs from images taken by Sentinel-1 satellites operated by the European Space Agency.

As part of the study, the effectiveness of the U-net algorithm was compared to two other state-of-the-art algorithms used to map icebergs.
They are known as k-means and Otsu.
The algorithms were programmed to identify the biggest iceberg in a series of satellite images.

Image 3 shows the U-net correctly identifying the iceberg, this time surrounded by sea ice.
The iceberg is highlighted in red, and the sea ice is seen as a gray structure.
However, the k-means algorithm has identified the iceberg and the sea ice as a single iceberg.


The algorithm is unable to differentiate between the two, despite them being distinct objects, where sea ice is rather flat ice on the sea and an iceberg stands meters above it.
(Shown in Image 4)

 How the algorithm works 
 

In this video: This animation 1 reveals how the algorithm works.
It uses an approach designed for manipulating images.
By analyzing the pixels in the image, it can determine the boundary or outline of objects, in this case it is identifying the outline of the iceberg.
Credit: Dr Anne Braakmann-Folgmann and the European Space Agency
 
 
This animation (Animation 2) compares the U-net algorithm with the much slower manual approach. Credit: Dr Anne Braakmann-Folgmann and the European Space Agency
 
Dr. Braakmann-Folgmann, now based at the Arctic University of Norway in Tromsø, said the technology could result in new services to provide information about the shape and size of giant icebergs.
Current mapping services show only the midpoint or central location and length of icebergs.
Interpretation by this new approach means their outline and area can be calculated.

She added, "Being able to automatically map iceberg extent with enhanced speed and accuracy paves the way for an operational service providing iceberg outlines on a regular, automated basis.
Combining them with measurements of iceberg thickness also enables scientists to monitor where giant icebergs are releasing vast quantities of freshwater into the oceans.
There are services that give data on the location of icebergs—but not their outline or area."
 
Using AI to measure the size of icebergs
 
Accuracy of the mapping system

The system has been tested on satellite images of seven icebergs, which were all between the size of the city of Bern—54 km2; and Hong Kong—1,052 km2.
For each of these icebergs, up to 46 images were used that covered all seasons from 2014-2020.

Over a series of tests, U-net outperformed the other two algorithms and was more effective in delineating the outline of an iceberg in images taken when environmental conditions were challenging, such as the image capturing a lot of ice structures.

On average, the U-net algorithm showed only a 5% lower estimate of the area of an iceberg.
In contrast, the k-means and Otsu algorithms returned—on average—figures for iceberg area that were 150% to 170% too large, probably because the algorithms were including sea ice and even nearby coastline in the calculations.

In machine learning, the F1 score is an evaluation of how well an algorithm performs and ranges from 0 to 1, with values closer to one displaying more precision.
U-net achieved an F1 score of 0.84.
The two other algorithms both scored 0.62.

Andrew Shepherd, Professor at the University of Northumbria and one of the co-authors of the study, said, "This study shows that machine learning will enable scientists to monitor remote and inaccessible parts of the world in almost real-time.
And with machine learning, the algorithm will become more accurate as it learns from errors in the way it interprets a satellite image."

Links :

Thursday, November 9, 2023

Billions of crabs went missing around Alaska. Scientists now know what happened to them


Molts and shells from snow crab sit on a table in June at the Alaska Fisheries Science Center in Kodiak, Alaska.
Joshua A. Bickel/AP

From CNN by Rachel Ramirez
 
Billions of snow crabs have disappeared from the ocean around Alaska in recent years, and scientists now say they know why: Warmer ocean temperatures likely caused them to starve to death.

The finding comes just days after the Alaska Department of Fish and Game announced the snow crab harvest season was canceled for the second year in a row, citing the overwhelming number of crabs missing from the typically frigid, treacherous waters of the Bering Sea.

The study, published Thursday by scientists at the National Oceanic and Atmospheric Administration, found a significant link between recent marine heat waves in the eastern Bering Sea and the sudden disappearance of the snow crabs that began showing up in surveys in 2021.

“When I received the 2021 data from the survey for the first time, my mind was just blown,” said Cody Szuwalski, lead author of the study and fishery biologist at NOAA.
“Everybody was just kind of hoping and praying that that was an error in the survey and that next year you would see more crabs.
“And then in 2022, it was more of a resignation that this is going to be a long road,” Szuwalski told CNN.

That year was the first the US snow crab fishery was closed in Alaska.
Catchers have attributed to the population decline to overfishing, but “overfished” is a technical definition that triggers conservation measures, experts told CNN — it doesn’t actually explain the collapse.

“The big take home for me from the paper, and just the whole experience in general, is that historically, fishery scientists had been very worried about overfishing — this has been our white whale, and in a lot of places we really solved that with management,” Szuwalski said.
“But climate change is really throwing a wrench into our plans, our models and our management systems.”

For the study, scientists analyzed what could have triggered the disappearance of the snow crabs beginning in 2020 and boiled it down to two categories: the snow crabs either moved or died.

Szuwalski said they looked north of the Bering Sea, west toward Russian waters and even into deeper levels of the oceans, and “ultimately concluded that it was unlikely that the crabs moved, and that the mortality event is probably a big driver.”

They found that warmer temperatures and population density were significantly linked to higher mortality rates among mature crabs.

The reason behind the mortality event: hungrier crabs.

Snow crabs are cold-water species and found overwhelmingly in areas where water temperatures are below 2 degrees Celsius, though they can function in waters up to 12 degrees Celsius, according to the study.
Warmer ocean water likely wreaked havoc on the crabs’ metabolism and increased their caloric needs.

The amount of energy crabs needed from food in 2018 — the first year of a two-year marine heat wave in the region — may have been as much as quadrupled compared to the previous year, researchers found.
But with the heat disrupting much of the Bering Sea’s food web, snow crabs had a hard time foraging for food and weren’t able to keep up with the caloric demand.


Scientists believe the crabs likely starved to death.
Fish like Pacific cod likely swooped into the warmer water to feed on what was left.
NOAA Fisheries

Other species took advantage of this dire situation, said Kerim Aydin, a co-author of the study and fisheries research biologist with NOAA’s Alaska Fisheries Science Center.

Normally, there is a temperature barrier in the ocean that prevents species like Pacific cod from reaching the crabs’ extremely cold habitat.
But during the heat wave, the Pacific cod were able to go to these warmer-than-usual waters and ate a portion of what was left of the crab population.

“This was a huge heat wave effect,” Aydin told CNN.
“When the heat wave came through, it just created a huge amount of starvation.
Other species may have moved in to take advantage of it, and then when the heat wave passed, things are maybe a bit more back to normal — although the crabs have a long road to getting past that even in normal times.”

Temperatures around the Arctic have warmed four times faster than the rest of the planet, scientists have reported.
Climate change has triggered a rapid loss in sea ice in the Arctic region, particularly in Alaska’s Bering Sea, which in turn has amplified global warming.

“2018 and 2019 were an extreme anomaly in sea ice in the Bering Sea, something that we’d never seen before,” Szuwalski said.
“There was maybe 4% of the coverage of ice that we’ve historically seen, and to know whether or not that’s going to continue going forward is hard to say.”

What’s happening with Alaska’s crabs is proof the climate crisis is rapidly accelerating and impacting livelihoods, Szuwalski said.
He knew this was going to happen at some point, but he “didn’t expect it to happen so soon.”

“This was kind of an unexpected, punctuated change in their populations,” he said.
“But I think long term, the expectation is that the snow crab population will move north as the ice recedes and in the eastern Bering Sea, we probably won’t see as much of them anymore.”
 
Links :

Wednesday, November 8, 2023

Mapping northern Greenland waters


From Hydro by Martin Jakobsson, Larry Mayer

A blank spot on nautical charts in ice-infested waters


An understanding of the interplay between glaciers and the ocean is needed to improve sea-level rise projections.
Seafloor mapping is critical in this pursuit, particularly where the ice sheets of Greenland and Antarctica meet the ocean.
Northern Greenland’s marine realm remains one of Earth’s least explored areas, with completely uncharted fjords.
In 2019, one of these fjords was mapped by the Swedish icebreaker Oden, with the next unmapped fjord to the east the target for 2024.
 
No detailed map available for North West of Greenland (DGA nuatical raster chart)

How marine-terminating glaciers impact global sea-level rise

The large ice sheets on Greenland and Antarctica consist of merged glaciers that drain areas of the ice sheets into the ocean through ice streams, similar to how rivers drain confined regions on land (Figure 1).
These glaciers play a crucial role in maintaining the ice sheets’ mass balance over time.
The annual ice accumulation primarily occurs through precipitation within the ice sheets’ interiors, while mass loss results from melting and calving.
Calving is the process whereby ice chunks break off from the glaciers’ fronts, forming icebergs that eventually melt and mix with the ocean, causing sea-level rise.
In recent decades, the stability of glaciers that drain into the ocean, known as ‘marine outlet glaciers’, has become a concern due to their alarming acceleration in mass loss.
These marine outlet glaciers are highly dynamic and can respond rapidly to environmental changes such as warming oceans, which can cause submarine ice-melting.
Their dynamics are also heavily influenced by the characteristics of the substrate they rest on and the shape and depth of the seafloor at their grounded margins or nearby.

The observed average global mean sea-level rise was about 1.6mm/year between 1900 and 2018, but accelerated in the 1990s to about 3.4mm/year between 1993 and 20181.
The single largest contributor to this rise in recent decades has been the melting of the Greenland Ice Sheet, accounting for nearly 0.5mm/year2.
The Greenland Ice Sheet has a total volume equivalent to about 7.4 metres of global mean sea level, but few if any scientists believe that this immense ice mass will completely disappear over hundreds of years, even under the worst global warming scenarios.
However, there are concerns that this could happen within the next 1,000 years3.
Nevertheless, a sea-level rise of just one metre, which some projections approach by the end of this century4, would impact millions of people globally.
It is therefore crucial that we understand the rate at which the Greenland and Antarctic Ice Sheets can lose mass and contribute to global mean sea-level rise.
This challenging task was emphasized in the IPCC’s special report on the ocean, cryosphere and sea-level change, which highlighted the urgent need to understand these processes and find viable solutions.

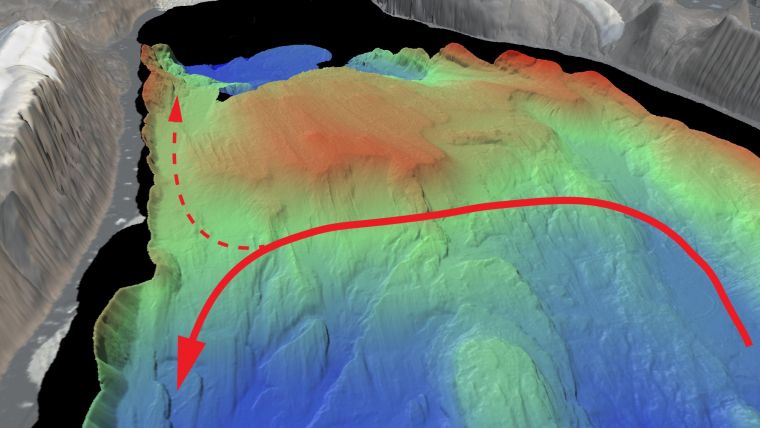
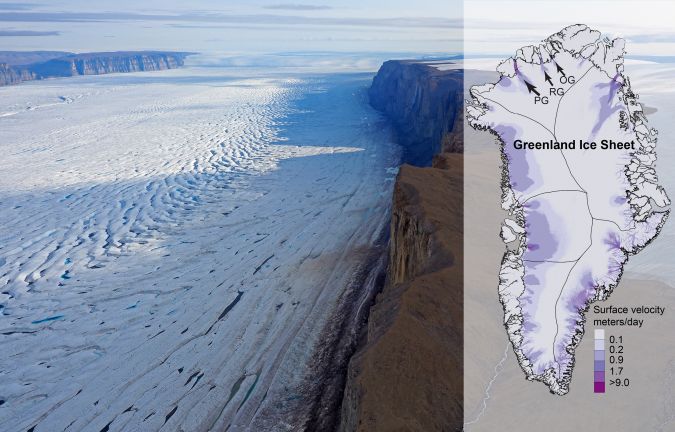
Figure 1: Photo showing the ice tongue of Ryder Glacier in northern Greenland.
The ice tongue comprises a floating extension of Ryder Glacier, one of the marine outlet glaciers that drain the Greenland Ice Sheet into the ocean.
The accompanying map illustrates the major drainage sectors within the Greenland Ice Sheet and displays the ice-flow surface velocity in metres per day.
The locations of the glaciers discussed in this article are shown by arrows aligned with their flow paths: OG = C.H. Ostenfeld Glacier; PG = Petermann Glacier; RG = Ryder Glacier.

The importance of seafloor mapping

To improve future global mean sea-level rise projections, the complex ice-ocean interactions must be understood and their geographical locations identified.
This requires both seafloor mapping and collection of oceanographic measurements in some of the world’s most remote areas: the polar regions.
Seafloor mapping is essential as it helps determine the bathymetry, which plays a crucial role in identifying areas where warmer ocean water can reach marine outlet glaciers or flow beneath their floating extensions, known as ice shelves or ice tongues when confined within fjords, and contribute to melting.

Fjords are commonly overdeepened after having served as pathways for outlet glaciers during several glaciations.
The seafloors of these fjords are filled with traces from the past glaciers in the form of submarine glacial landforms.
Some of the fjords have prominent shallow sills that can act as thresholds at their entrances.
These sills are often comprised of glacially eroded material covering a resistant rock formation.
They may be shallow enough to prevent inflow of warmer subsurface waters reaching the outlet glaciers’ margins (which promotes melting), while other sills are small or contain deeper channels that let the warmer water pass (Figure 2).
In northern Greenland, warmer subsurface water of Atlantic origin has been observed in several fjords.
This water has, after entering Fram Strait between Svalbard and Greenland or across the Barents Sea, circulated all the way around the Arctic Ocean before reaching the northern Greenland glaciers.
The water is only slightly warmer than 0°C when reaching the glaciers, but this is enough to cause substantial melting.
It flows below fresher and very cold water (less than -1°C), typically representing meltwater.
The warmer saltier water is heavier and therefore flows at depths where the seafloor morphology will greatly influence its path.

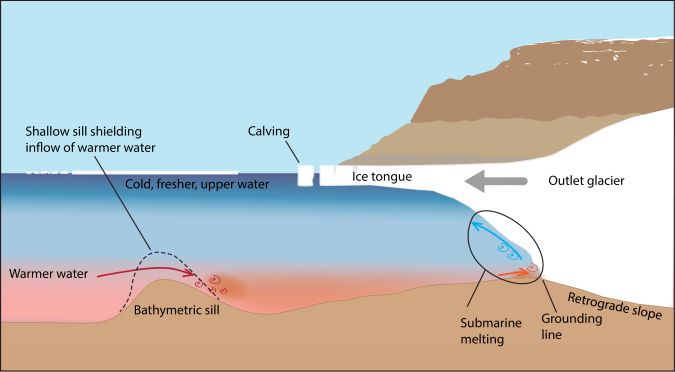
Figure 2: Schematic illustration of a marine outlet glacier with a floating ice tongue being subjected to submarine melting from inflow of subsurface warmer water.
Some fjords have bathymetric sills that are shallow enough to prevent warmer deeper water entering the fjord, as illustrated by the stippled line.
The blue arrow shows how meltwater rises along the underside of the glacier and interacts with the ocean water.
If the bed below the glacier slopes towards land as illustrated (retrograde slope), the warmer water will follow the glacier as it retreats and continue to cause melting.
This may lead to a process called ‘marine ice-sheet instability’, where the glacier becomes progressively thicker as it retreats at the grounding line into deeper water implying flotation, instability and increased calving.
A positive feedback loop is initiated.
Floating ice tongues have buttressing effects, and when they are removed the glacier flow may accelerate in response.

Mapping Petermann Fjord in northern Greenland

The Petermann 2015 expedition with the Swedish icebreaker Oden mapped the entire Petermann Fjord, into which Petermann Glacier drains, and the adjacent section of Nares Strait in northern Greenland (Figure 3).
This glacier received a lot of international attention when it lost approximately 40% of its floating ice tongue during two major calving events in 2010 and 2012.
The largest event occurred in 2010 when the calved tabular iceberg was about 251km2 in size, which is slightly larger than the area of Amsterdam.
Oceanographers subsequently discovered that warmer water of Atlantic origin enters the fjord5.

Multibeam mapping in 2015 revealed the presence of a well-developed sill at the fjord entrance, although of insufficient size to prevent the warmer water from reaching the glacier (Figure 4)6.
In contrast to Petermann Glacier, Ryder Glacier, which drains into Sherard Osborn Fjord further to the north-east, had been stable for decades.
Sherard Osborn Fjord had never been explored by a surface vessel and there were no soundings available to suggest what the seafloor might look like.
The reason for this is the sea-ice conditions in the Lincoln Sea, which are the most severe in the Arctic Ocean.
The bathymetry in the southern Lincoln Sea is based on a very sparse grid of spot soundings acquired by the Canadian Hydrographic Service.
Consequently, it was decided to prioritize the mapping and investigation of Sherard Osborn Fjord for the next expedition with icebreaker Oden: the Ryder 2019 expedition.

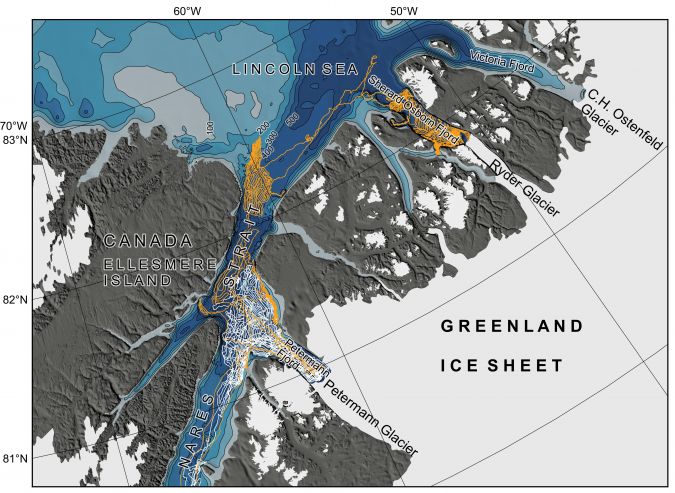
Figure 3: Northern Greenland featuring its three largest fjords, each hosting a marine outlet glacier that drains the northern sector of the Greenland Ice Sheet.
The overview bathymetry is based on the International Bathymetric Chart of the Arctic Ocean (IBCAO)7, which has been merged with the BedMachine compilation of under-ice topography8.
The BedMachine compilation employs a kriging algorithm to interpolate the bathymetry in fjords with limited data, utilizing the under-ice topography.
This implies, for example, that the depth of an outlet glacier’s grounding line will be used.
In the case of Victoria Fjord, where sounding data is unavailable, the bathymetry represents an interpolated extension between the depth of C.H.
Ostenfeld’s grounding line and the few spot soundings available outside of the fjord in the Lincoln Sea.
From a mariner’s perspective, this is practically the same as a blank chart.
The track of the Petermann 2015 expedition with Swedish icebreaker Oden is shown with a white line, and that of the Ryder 2019 expedition with an orange line.

 
The uncharted Sherard Osborn Fjord

The northern end of Nares Strait was reached without too many difficulties in 2019, thanks to the strong icebreaker Oden and the relatively light sea ice in the strait that year.
However, Oden hit a wall of hard multiyear sea ice more than four metres thick as it entered the Lincoln Sea.
The transit of approximately 46 nautical miles diagonally across the southern Lincoln Sea to Sherard Osborn Fjord therefore had to be planned using numerous ice-reconnaissance flights with the helicopters carried onboard.
The purpose was to locate fracture systems in the sea ice that facilitated icebreaking.

After completing this crossing in approximately 1.5 days, the next challenge awaited •– huge tabular icebergs in Sherard Osborn Fjord (Figure 5).
These icebergs had remained trapped in the fjord since previous calving events because the sea ice in the Lincoln Sea prevents them from escaping, in contrast to Petermann Fjord where the icebergs are expelled into Nares Strait, where they begin their journey southward and eventually disintegrate and melt.
During the initial helicopter reconnaissance of Sherard Osborn Fjord, the entire entrance was blocked by tabular icebergs, except for a narrow passage along the shore of Castle Island (Figure 5).
However, entering the fjord through such a small passage into uncharted waters was deemed unsafe.
Understanding the movement of the icebergs within the fjord was essential – was there a risk of becoming trapped inside? In addition to analyses of satellite imagery, GPS transponders were placed on a couple of selected icebergs to track them in real time (Figure 5).

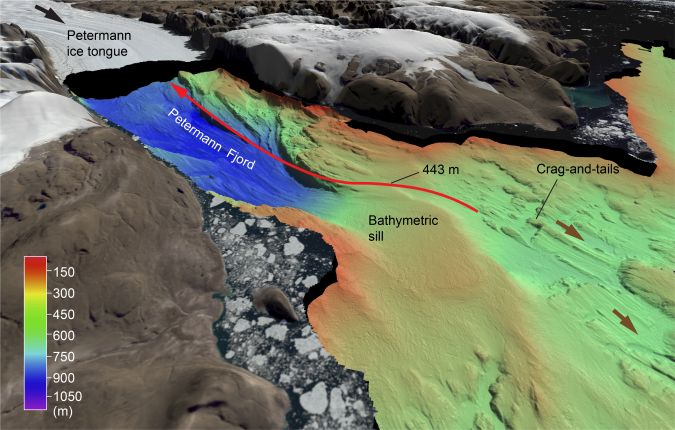
Figure 4: Multibeam bathymetry of Petermann Fjord and the adjacent area of Nares Strait acquired during the Petermann 2015 expedition with the Swedish icebreaker Oden (Multibeam: Kongsberg EM 122, 1°x1°, 12kHz).
There is a pronounced bathymetric sill at the fjord entrance; however, warmer water of Atlantic origin (red line) makes it past this sill and below the floating ice tongue of Petermann Glacier where it causes melting.
The seafloor bathymetry is dominated by glacial landforms produced by past glacier activities.
Crag and tails are classical glacial landforms, formed when a glacier passes over a hill of resistant bedrock in the seafloor and ‘smears out’ eroded material in the wake of the resistant crag.
These are good indicators of past ice-flow directions, here shown by brown arrows.


It was discovered that the icebergs circulated more or less regularly in an anticlockwise direction within the fjord, indicating that, with careful monitoring, there would always be a navigable path through them to exit the fjord.
Another major challenge was the fact that the fjord was completely uncharted.
Two small islands, Reef and Wedge islands, indicated that it was not possible to just steam into the fjord and expect it to be deep everywhere.
Instead, the installed Kongsberg EM122 (1°×1°, 12kHz) multibeam had to be used to its full extent.
Systematically mapping back and forth across the fjord, with the beams extending into the uncharted fjord during each pass, enabled safe navigation.
While this mode of operation was time consuming, it had the advantage of providing high-quality bathymetry.
Mapping was done in this way during the nights, while sediment coring and other sampling operations filled the days.
Two weeks were spent mapping and sampling in Sherard Osborn Fjord and the entire fjord was covered, apart from some small holes where icebergs were constantly in the way.

The bathymetry of Sherard Osborn Fjord is notably complex with two major sills: one at the fjord entrance and another just in front of the current position of the ice-tongue margin (Figure 6).
Oceanographic measurements revealed that while the outer sill would allow the passage of warmer water into the fjord, the inner sill is shallow enough to shield Ryder Glacier from most of the inflowing warmer water.
The inner sill in Sherard Osborn Fjord is believed to be a crucial factor in explaining the contrasting behaviour of Ryder and Petermann glaciers over the past few decades9.
It underscores the importance of incorporating seafloor bathymetry into numerical models used to accurately project the contribution of glaciers to future sea-level rise.

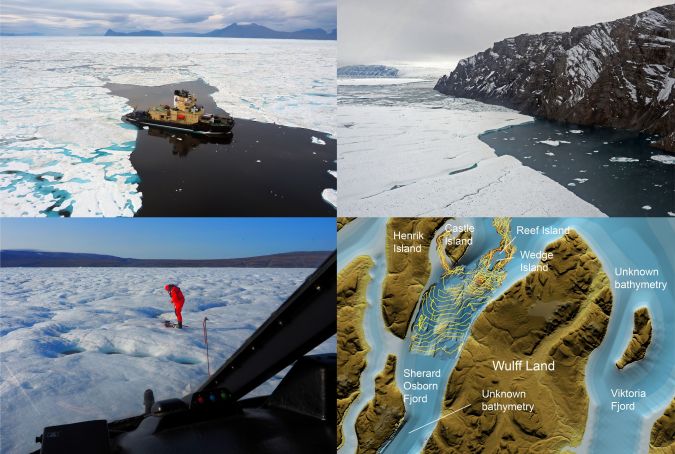
Figure 5: (Upper left) Icebreaker Oden in the area outside Sherard Osborn Fjord.
(Upper right) Tabular iceberg, calved from Ryder Glacier, blocking the entrance to Sherard Osborn Fjord, apart from leaving a small passage next to Castle Island.
(Lower left) Installation of a GPS transponder on one of the large tabular icebergs.
(Lower right) Map showing the track of Oden mapping its way into Sherard Osborn Fjord.

The North of Greenland 2024 expedition


C.H. Ostenfeld Glacier, which drains into Victoria Fjord, lies to the east of Ryder Glacier.
Currently, Victoria Fjord remains completely unmapped, with no ship having entered it (Figure 3).
C.H. Ostenfeld Glacier recently lost nearly all its floating ice tongue and will be the primary focus of the North of Greenland 2024 expedition, which is part of the North Greenland Earth-Ocean-Ecosystem Observatory (GEOEO) research theme.
The Swedish Polar Research Secretariat adopted this theme following a proposal submitted to its Polar Research Process.
The expedition builds on the achievements of the Petermann 2015 and Ryder 2019 expeditions and will again utilize the Swedish icebreaker Oden.

The overarching goal of GEOEO is to improve our understanding of North Greenland’s marine cryosphere’s dynamic history and response to climate change.
This includes investigating the implications for marine and terrestrial ecosystems in North Greenland, the adjacent Arctic Ocean, and the contribution of the North Greenland Ice Sheet to future sea-level rise.
If the expedition successfully maps Victoria Fjord, it will complete the mapping of all three major outlet glaciers north of 80° that drain the northern sector of the Greenland Ice Sheet.

The bathymetric data collected will be contributed to both IBCAO and BedMachine through the Nippon Foundation - GEBCO Seabed 2030 project.
This global initiative, launched in 2017, aims to comprehensively map the world’s entire ocean floor by 2030.
While the southern Fram Strait is one of the better-mapped regions in the world’s oceans, the Lincoln Sea and areas in the central Arctic Ocean, north of Greenland and north of the eastern part of the Canadian Arctic Archipelago remain among the least mapped regions.
Looking at the entire world’s oceans, the Nippon Foundation-GEBCO Seabed 2030 project reported a mapping coverage of 24.9% when the latest GEBCO grid was released in spring 2023 (https://seabed2030.org/; https://www.gebco.net/).

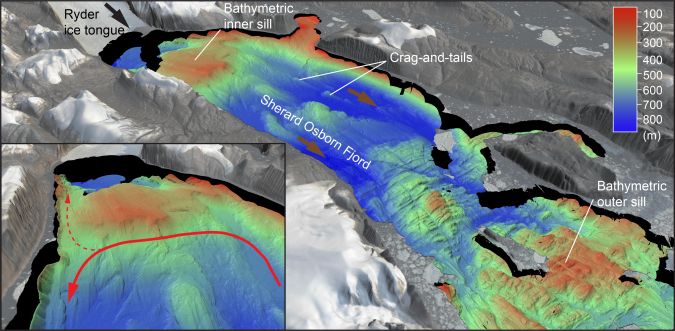
Figure 6: Multibeam bathymetry of Sherard Osborn Fjord acquired during the Ryder 2019 expedition with the Swedish icebreaker Oden.
Two prominent bathymetric sills were mapped in the fjord.
The inner sill was found to be shallow enough to shield Ryder Glacier from inflowing warmer Atlantic water, which was observed by oceanographic measurements.
The inset shows a close-up of the inner sill from a slightly different view.
Note that a narrow deeper channel exists where some warmer water may pass and flow towards Ryder Glacier.


Links :

Tuesday, November 7, 2023

A new layer in the GeoGarage platform : Netherlands nautical charts based on rasterized ENC material from NLHO

Nautical charts for Netherlands today which leads to the availability of a new dedicated layer for Netherlands with NLHO rasterized ENCs

Until today, the GeoGarage platform used the raster chart material (RNC) provided by NLHO display nautical charts for the Netherlands areas.

For internal management reasons specific to NLHO, the Netherlands Hydrographic Office has made some technical changes to deliver updates to their commercial licensees (whose GeoGarage) causing us problems to deliver updates for our customers in our chain of processes.

The GeoGarage platform was already in the capacity to deliver a rasterized visualization of Electronic Navigation Chart (vector ENC) through their web services (WMTS) for their B2B customers involved in webmapping and other onshore GIS activities.

Today, the GeoGarage platform is ready to propose the visualization of official ENC to their customers using mobile navigation apps (non SOLAS) so Weather 4D Routing and Navigation on iOS and SailGrib on Android.
 
In consequence, the GeoGarage platform no longer offers a subscription to Netherlands Raster maps for Netherlands on its e-commerce platform for mobile apps.
However, the Netherlands RNC subscription will continue for their current mobile customers until its expiry date (visible on your W4D R&N/Sailgrib application) but will not be automatically renewed on this date.

The RNC plan is replaced by a new layer based on ENC type maps edited by the Netherlands Hydrographic Office (NLHO), and rasterized for W4D/Sailgrib : Netehrlands (derived from NLHO ENC)
The price of the annual subscription (24.99 EUR) remains the same. 
 
So Weather4D R&N and Sailgrib users (with last updated versions) can right now display the whole catalogue of NLHO ENC (166 ENC at this time), with a half-yearly updating process : see GeoGarage news

Today, in this first version, the vector ENC are displayed using a graphical rendering similar to the one used in official ECDIS (s-52 IHO specifications) : they are not to be used for shipping navigation (IMO SOLAS), but only for recreative use, not as a primary tool for navigation.
Effectively, in contrast to the use in ECDIS, there is no possibility -today with the W4D/SailGrib current version- to ask for text info and details regarding any navigational objects (beacon, buoy, marks...).
 
View of Amsterdam harbor with RNC chart
 
Same view of Amsterdam harbor with ENC chart

A new layer in the GeoGarage platform : Germany nautical charts based on rasterized ENC material from BSH

 Nautical charts for Germany today which leads to the availability of a new dedicated layer for Germany with BSH rasterized ENCs

Until today, the GeoGarage platform used the raster chart material (RNC) provided by BSH to display nautical charts for the German areas.

For internal management reasons specific to BSH, the Hydrographic Institute of Germany has made some technical changes to deliver updates to their commercial licensees (whose GeoGarage) causing us problems to deliver updates for our customers in our chain of processes.

The GeoGarage platform was already in the capacity to deliver a rasterized visualization of Electronic Navigation Chart (vector ENC) through their web services (WMTS) for their B2B customers involved in webmapping and other onshore GIS activities.

Today, the GeoGarage platform is ready to propose the visualization of official ENC to their customers using mobile navigation apps (non SOLAS) so Weather 4D Routing and Navigation on iOS and SailGrib on Android.
 
In consequence, the GeoGarage platform no longer offers a subscription to BSH Raster maps for Germany on its e-commerce platform for mobile apps.
However, the Germany RNC subscription will continue for their current mobile customers until its expiry date (visible on your W4D R&N/Sailgrib application) but will not be automatically renewed on this date.

The RNC plan is replaced by a new layer based on ENC type maps edited bythe German Hydrographic Service (BSH), and rasterized for W4D/Sailgrib : Germany (derived from BSH ENC)
The price of the annual subscription (24.99 EUR) remains the same. 
 
So Weather4D R&N and Sailgrib users (with last updated versions) can right now display the whole catalogue of BSH ENC (298 ENC at this time), with a half-yearly updating process : see GeoGarage news

Today, in this first version, the vector ENC are displayed using a graphical rendering similar to the one used in official ECDIS (s-52 IHO specifications) : they are not to be used for shipping navigation (IMO SOLAS), but only for recreative use, not as a primary tool for navigation.
Effectively, in contrast to the use in ECDIS, there is no possibility -today with the W4D/SailGrib current version- to ask for text info and details regarding any navigational objects (beacon, buoy, marks...).
 
View of Hamburg harbor with RNC chart

Same view of Hamburg harbor with ENC chart

Seals show scientists an unknown Antarctic canyon


Seals with helmets are helping scientists with climate research in Antarctica
 
From Scientific American by Ethan Freedman
 
Charting the seafloor with deep-diving animals can help scientists predict glacial and ice-sheet-melting physics
 
Humans have sailed the oceans' surfaces for millennia, but their depths remain effectively uncharted.
Only about a quarter of the seafloor has been mapped at high resolution.
Maps of most regions display only approximate depths and often miss entire underwater mountains or canyons.

The tracker measures temperature, depth and salinity and beams that data back to base via satellite.(Supplied: Clive McMahon)

So a group of researchers has recruited some deep-diving experts: Elephant Seals and Weddell Seals.
Scientists have been placing trackers on these blubbery marine mammals around Antarctica for years, gathering data on ocean temperature and salinity.
For a new study, the researchers compared these dives' location and depth data with some of the less detailed seafloor maps.
They spotted places where the seals dove deeper than should have been possible according to the maps—meaning the existing depth estimates were inaccurate.
 
Vincennes Bay with the GeoGarage platform (NGA nautical raster chart)

In eastern Antarctica's Vincennes Bay, the diving seals helped the scientists find a large, hidden underwater canyon plunging to depths of more than a mile.
An Australian research ship called the RSV Nuyina later measured the canyon's exact depth using sonar, and the researchers have proposed naming their find the Mirounga-Nuyina Canyon—honoring both the ship and the involved Elephant Seals, genus Mirounga.

“The seals discovered the canyon, and the ship confirmed it,” says Clive McMahon, a researcher at the Integrated Marine Observing System in Australia and a co-author of the new study, published in Communications Earth & Environment.

Elephant seals fitted with tracking devices.
Credit: Clive McMahon, IMOS and SIMS
 
But seals can't map the entire ocean floor.
The trackers used in the study could pinpoint a seal's geographical location only within about 1.5 miles, which allows for useful but not exactly high-resolution data.
Plus, because the seals don't always dive to the bottom of the ocean, they can reveal only where the bottom is deeper than in existing maps—not shallower.
McMahon notes that scientists could improve on these data by using more precise GPS trackers and analyzing the seals' diving patterns to determine whether they have reached the seafloor or simply stopped descending.

The current seal-dive data can still be valuable for an important task, says Anna WÃ¥hlin, an oceanographer at the University of Gothenburg in Sweden, who was not involved in the new research.
The deep ocean around Antarctica is warmer than the frigid waters at the surface, and seafloor canyons can allow that warmer water to flow to the ice along the continent's coast, WÃ¥hlin explains.
To predict how Antarctica's ice will melt, scientists will need to know where those canyons are and how deep they go.

 Links :

Monday, November 6, 2023

A landslide triggered the 1650 tsunamigenic eruption of Kolumbo in the Aegean Sea

A new study using 3D seismic data confirms the hypothesis that a flank collapse triggered the explosive eruption that caused damage across the Aegean Sea.

From EOS by Dave Petley,

In 1650, a destructive tsunami occurred in the Aegean Sea, which is an embayment of the Mediterranean sea, located between the modern Greece to the west and Turkey to the east.
There is a nice presentation about the tsunami and its effects online.
It is documented that the tsunami destroyed farmland, boats, trees and churches on the island of Santorini.
There is clear archaeological and geological evidence for this tsunami.

 
The source of the tsunami is known to be an underwater volcano, known as Kolumbo, located about 7 km northeast of Santorini.
The volcano was erupting for several weeks ahead of the tsunami.
On the 29 September 1650, a huge explosion was heard up to 100 km from Santorini as the volcano erupted catastrophically.
The resultant tsunami waves were up to 20 m high, striking islands across the southern part of the Aegean Sea, as well as the north coast of Crete.

It has long been speculated that the trigger for the catastrophic eruption might have been the collapse of the volcanic cone triggered by a submarine landslide.
This hypothesis has been investigated by a team that has just published their research in the journal Nature Communications (Karstens et al.
2023
– available open access).
The researchers have mapped Kolumbo with 3D seismics, generating profiles of the crater and the surrounding seabed.

 GR4APP06 Thira island (scale 1:450000) ENC with zoom on the North East for Kolumbo

source : NOAA
 
The paper includes the following perspective view of the bathymetry data, showing the crater, the landslide deposit and the clear detachment surface – the shear surface in landslide parlance:
 
 
3D bathymetry data for Kolumbo volcano, showing the volcanic cone, the landslide deposit and the shear plane.

The seismic profile through the hypothesised landslide deposit clearly demonstrates that thus was a flank collapse event:
 
 
A seismic profile line through Kolumbo volcano, showing the volcanic cone, the landslide deposit and the shear plane.

Thus, the sequence of events was that during the eruption, the flanks of the volcano destabilised and slipped in a very large landslide – the estimated volume is 1.2 cubic kilometres.
This then removed the cap from the magma chamber, which contained a large volume of gas under pressure.
This generated a huge explosion that created the crater that is seen in the images above.
The crater is 2.5 km in diameter and 500 m deep.

The team has modelled the tsunami that would result from a landslide event of this sequence of events – a flank collapse followed by an explosives’ eruption – and have compared it with the modelled tsunami from an explosion alone.
They found that the former sequence fits the observed tsunami rather better.

It is interesting that in recent weeks we have seen a large GLOF that was triggered by slope instability into the glacial lake and now clear evidence that a volcanic eruption and tsunami were caused by a landslide.
I have long argued that slope instability is under-appreciated as the trigger mechanism for major hazards across a broad range of types.

Links :

Sunday, November 5, 2023

Transat Jacques Vabre Normandie Le Havre 2023

Class 40 departure
 

Ultim departure for SVR Lazartigue trimaran