Meditation on and reflection of the creative process
Artist statement :
In my ocean paintings I’m interested in holding the moment.
I contemplate the collision of opposites at life’s centre, both brutally tragic and endlessly tender.
The ocean mirrors the tempo of my body, the beating of my heart, the in and out of my breath.
Surging contractions birth swells that rise and then die.
Waves like a metronome mark the present, each insisting: now.
In the ocean I’m immersed in now.
Yet in the ancient body of the sea I feel the root of time.
In the pulsing surge I feel the wild place of my wilderness beginnings.
There is no totem to the irrational more potent.
Nothing points to the stirrings of my unconscious more than what lies below the surface.
No peril is more ominous.
Yet the sea is where I bathe my wounds.
Where I get lost in all that is luxuriously infinite.
Nothing is more symphonic, more effervescent, more delicately complete than the endless sea.
Ran Ortner, 2015
Few natural phenomena are as
mesmerizing as a swimming jellyfish, with its graceful full-body
contractions.
Biologists rhapsodize about it for a different reason than
your typical aquarium-goer, though: It’s a highly efficient way to get
around the ocean.
And now, scientists have figured out exactly what
helps drive that locomotion.
New research in Nature Communications reveals that jellyfish and an unrelated eel-like creature called a lamprey are in fact more pulling
their bodies along than pushing.
That might seem like a minor
discovery, but in fact it could transform not only how engineers think
about building underwater vehicles, but how biologists think about
movement at large.
Take a look at the GIF below.
That’s a swimming lamprey, surrounded
by millions of miniscule glass beads.
By shining lasers into the
tank and recording it all with high-speed cameras, researchers were able
to track the movements of the beads and calculate the different
pressures the lamprey creates as it cuts through water.
A lamprey doing its thing. Red is high-pressure water, while blue is low-pressure.
John O. Dabiri
What you’re seeing in red at the lamprey’s snout is an area of high
pressure, which you’d expect where the creature has to break through
the water.
More interesting, though, are the blue bits: areas of low
pressure that those undulations create.
As the lamprey twists and rotates, it churns the water next to its
body into small whirlpools, explains Stanford University’s John Dabiri, a
fluid dynamicist who authored the study.
“At the center of those
vortices you end up getting low pressure, just like in a hurricane or
tornado you often will have low pressure in the middle of that rotating
mass of air.”
Those low pressure whirlpools form near the creature’s forward-facing
surfaces, sucking in the water ahead of the lamprey and propelling the
animal forward.
The jellyfish is the same way: Both animals essentially
suction their way through Earth’s oceans.
A lamprey illuminated with the green and red lasers
that track the movement of tiny glass balls in the tank.
Sean P. Colin
That mechanism makes them highly efficient swimmers.
If these animals
just propelled themselves forward by pushing water back with their
waggling tails or full-body contractions, they’d waste a lot of
energy—imagine the waves left behind a high-speed motorboat.
“In the
case of the suction motion,” Dabiri says, “it’s possible to sort of slip
past that water without leaving a lot of energy in your wake.”
These findings could be a big deal for engineers.
Like a flick of a
fish’s tail tends to waste energy, so too do propellers.
But there may
be a way to generate low-pressure suction around a vessel to give it
a boost, says Dabiri.
If engineers end up capitalizing on this suction-driven swimming
technique, they won’t be the only ones.
Biologists may take note too.
Lampreys and jellyfish are pretty darn evolutionarily distinct—they’re
not even remotely closely related.
So if this trick of locomotion is
present in two disparate groups, it may well show up elsewhere in the
animal kingdom.
To create the low-pressure vortices, both the lamprey and the
jellyfish exploit their bendy bits—and all kinds of other structures in
the animal kingdom are nice and flexible as well.
“What we see are, for
example, wings and fins bending somewhere around 70 percent of the way,”
says biologist Jack Costello of the Marine Biological Laboratory, who
was also involved in the research.
“That seems to be true whether it’s a
mosquito wing or a condor wing or fish bodies.”
Another shot of a swimming lamprey, this one showing the direction of flowing water.
John O. Dabiri
Could it be that other creatures out there are utilizing the suction
trick?
With such a big advantage in energy savings, one might expect
evolution to select for it.
“It’s such a strong selective force acting,
it doesn’t care what lineage you come from,” says Costello. “It’s sort
of like gravity doesn’t care whether you’re a dinosaur or a tsetse fly.”
The beautiful, hypnotic jellyfish, then, may hold far more secrets
than it lets on.
So the next time you’re at the aquarium, take time to
appreciate its ballet.
It’s kind of a big deal.
Nautical charts are an important tool in navigating safely in coastal waters, and Coast Survey’s mission is to keep these charts up to date.
However, maintaining accurate charts can be a challenge in locations where sandy shoals may shift seasonally and present a danger to navigation.
These areas differ from the current nautical charts, and bottom contours change so rapidly that it may seem an impossible task to keep up using the traditional survey methods. Office of Coast Survey and NOAA Ship Thomas Jefferson are seeking a solution to this ongoing problem and may have an answer with satellite-derived bathymetry.
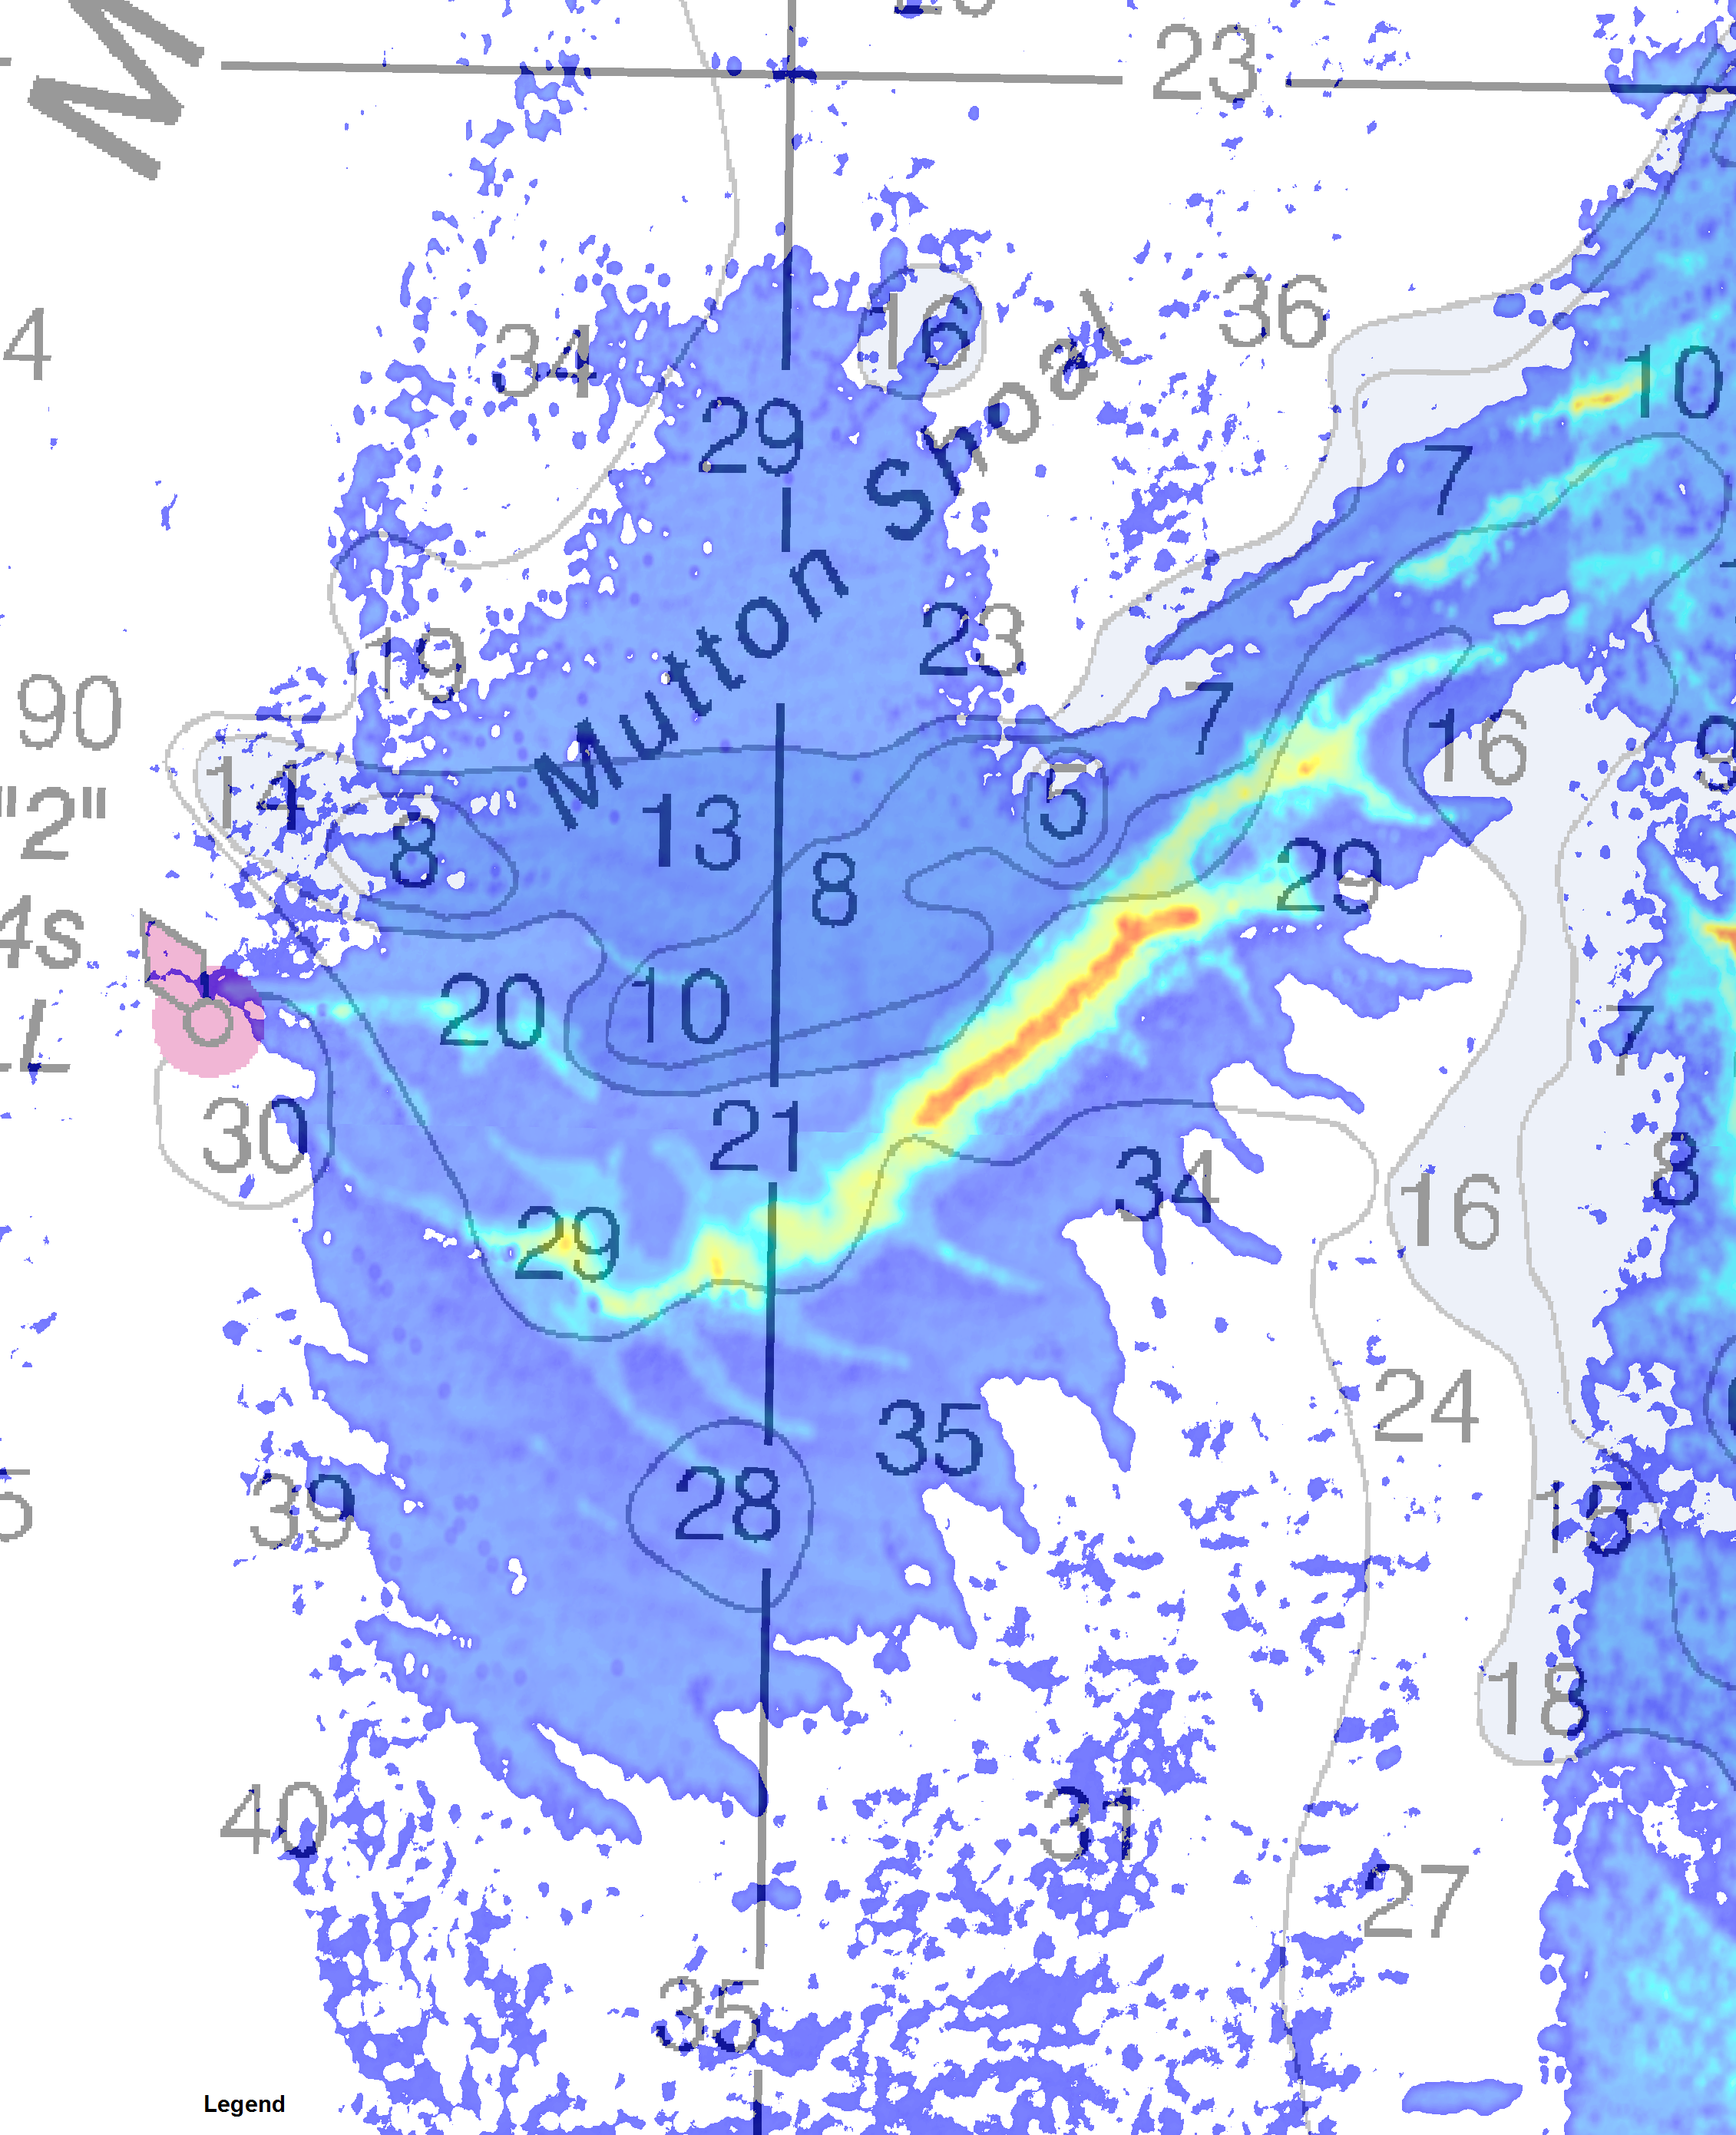
Satellite-derived bathymetry (SDB) begins with using multi-spectral satellite imagery, obtained by satellites such as Landsat and WorldView2, which compares green and blue color bands.
Multi-spectral satellite imagery of Mutton Shoal in Nantucket Sound, overlaid on the chart.
Green color bands are attenuated by the water faster than blue bands and help to infer relative depths of the water (blue areas being deeper than green).
These images are then transformed into a color range scale applicable to the color scale used when surveying with a multibeam echo sounder.
With the color range applied, reds on the image represent an area that may be shoal whereas blues and greens represent deeper water.
Satellite-derived bathymetry of Mutton Shoal with a color range scale
that is correlated with the color scale used for multibeam processing.
Since the images are based on attenuation of color bands, depth can only be inferred, so survey equipment (such as vertical beam and multibeam sonars) is necessary to acquire true depth.
This fall, NOAA Ship Thomas Jefferson investigated the use of satellite-derived bathymetry imagery as a new survey tool.
Survey technicians will calibrate the application of this imagery through bathymetry studies for Nantucket Sound and Chincoteague Island.
NOAA Lt. Anthony Klemm, who is leading the studies, chose these project areas because they both had relatively clear shallow water and were in a highly changeable area.
At these locations, he chose specific shoals for exploration based on vessel traffic density.
In October, Thomas Jefferson spent two days in Nantucket Sound researching shifting shoals using the satellite-derived imagery overlain on the most recent chart.
Ensign Marybeth Head developed line plans to acquire data over the potential location of shoals as seen with the satellite images, as well as their charted locations.
Survey launches acquired multibeam data in water deeper than six feet, and Z-Boats were sent in to acquire vertical beam data in areas too shoal for the launches to safely operate.
Satellite-derived bathymetry of Mutton Shoal with multibeam data from
the investigation overlaid. This picture demonstrates how accurate the
location of the shifted shoal was compared to the SDB imagery.
During routine conductivity, temperature, and depth casts for sound speed velocity, Ensign Head and Ensign Kaitlyn Seberger used a Secchi disk to determine the attenuation coefficient at each cast location for later comparisons.
The satellite imagery was a vital tool in project planning, as well as determining safe navigation of the ship and the survey launches.
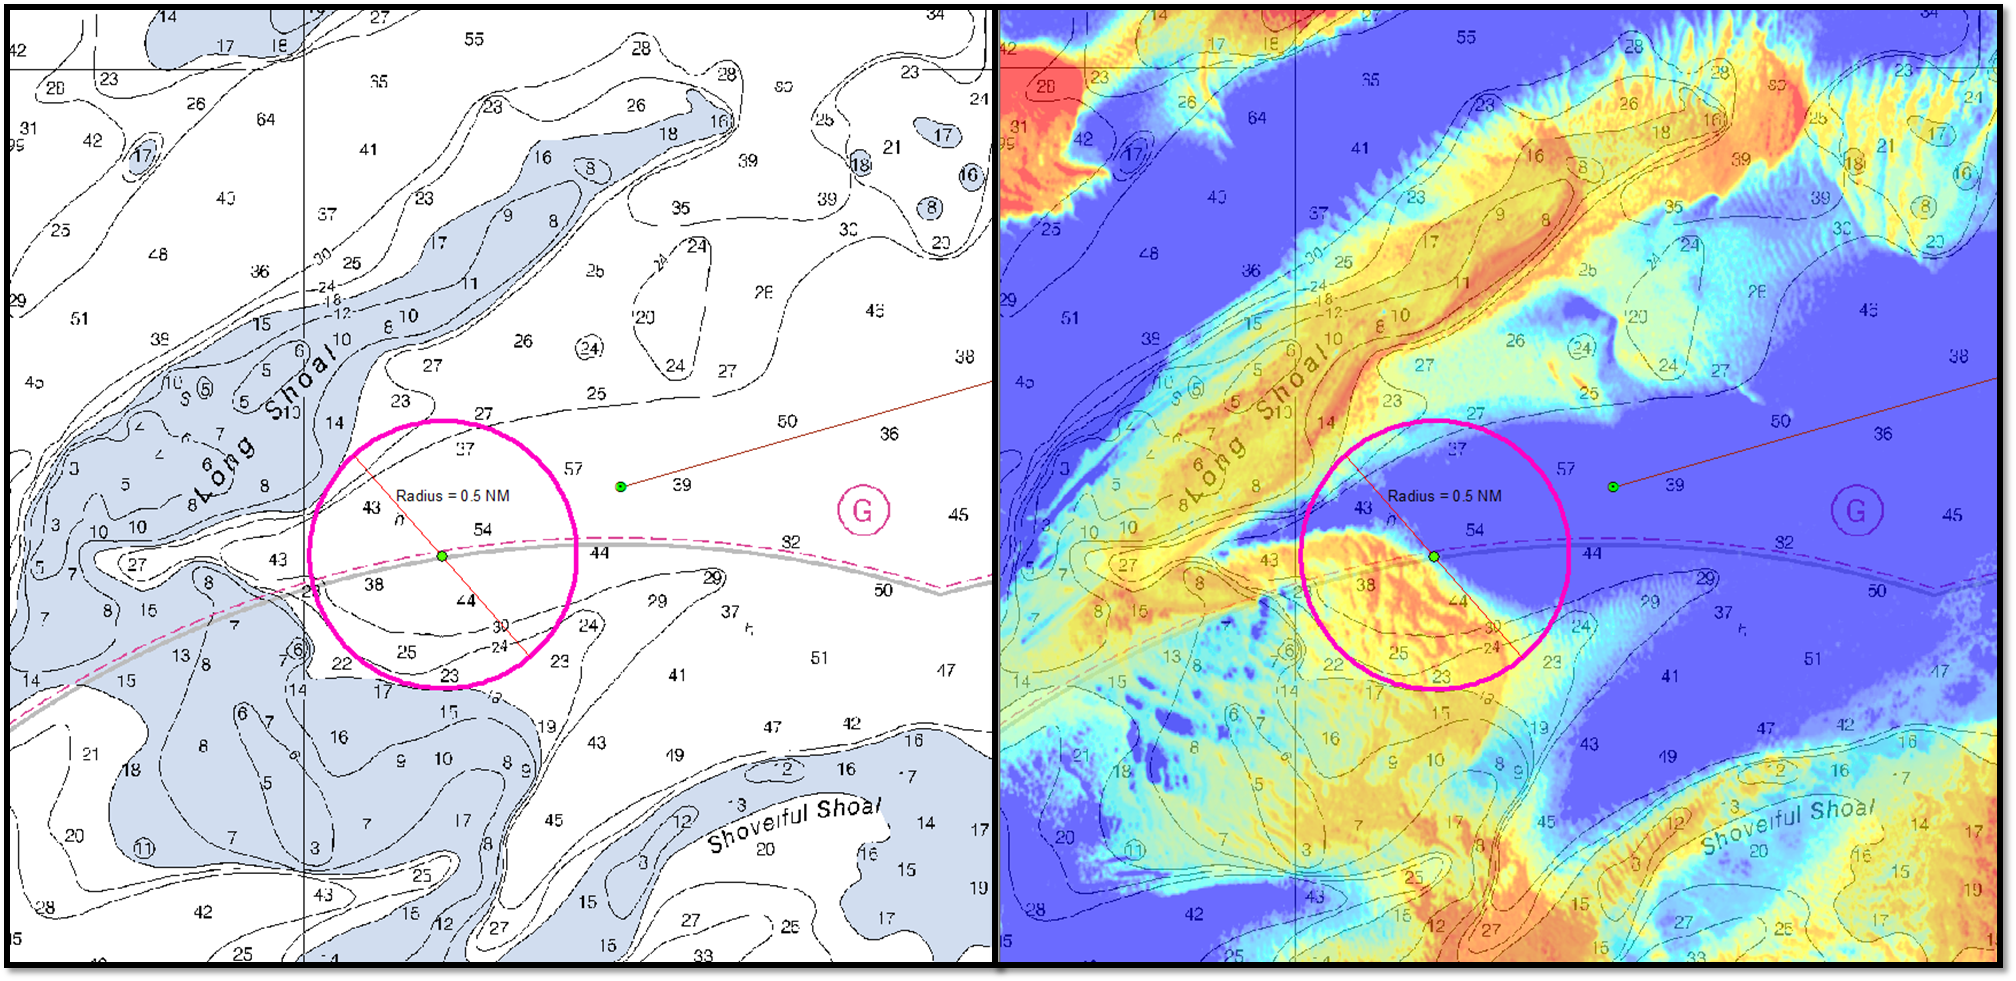
Below is a picture of the chart location where Thomas Jefferson intended to anchor.
The adjacent image is the satellite-derived bathymetry imagery indicating the anchorage would have been within a shoal area and unsafe for anchoring.
Side-by-side picture of the chart and SDB imagery for the intended
anchorage location in Nantucket Sound.
SDB imagery indicated a shoal
that covered half of the anchorage safety circle.
A Z-boat verified the
indicated shoal was almost 30 ft shoaler than charted and without this
useful imagery, the ship and launches could have run aground.
Ensign Head determined safe passage routes for the survey launches, using the satellite-derived bathymetry imagery overlaid on a chart of the area, as the charted soundings were not reliable.
For example, a safe passage route between the study areas and the ship was located between two shoals that had shifted considerably from the chart of the area.
Sections of the passage are currently charted at 20 feet or more of water, but the fathometer on the launch displayed depths of less than 10 feet.
Boat sheet for the launches indicating a potential safe passage route
from the project area to the ship.
After processing the multibeam data, Ensign Head determined that more than half of the charted shoals in the project area had shifted and the red zones depicted in the satellite-derived bathymetry imagery were significantly shoaler than charted depths for the surrounding area.
Results from the investigation showed that the satellite-derived bathymetry for Nantucket Sound was exceptionally accurate and aided in the identification of current navigational dangers.
However, more research is needed regarding the use of satellite-derived bathymetry as a contemporary survey method.
Limitations on use of the imagery can include variables such as cloud cover, turbidity, Chlorophyll a, and other water quality properties that may affect attenuation.
Despite these challenges, satellite-derived bathymetry is a new tool that could support survey efforts by reducing the amount of time and area necessary to survey and by increasing the effectiveness of NOAA’s efforts to efficiently provide safe navigation to the local mariner.
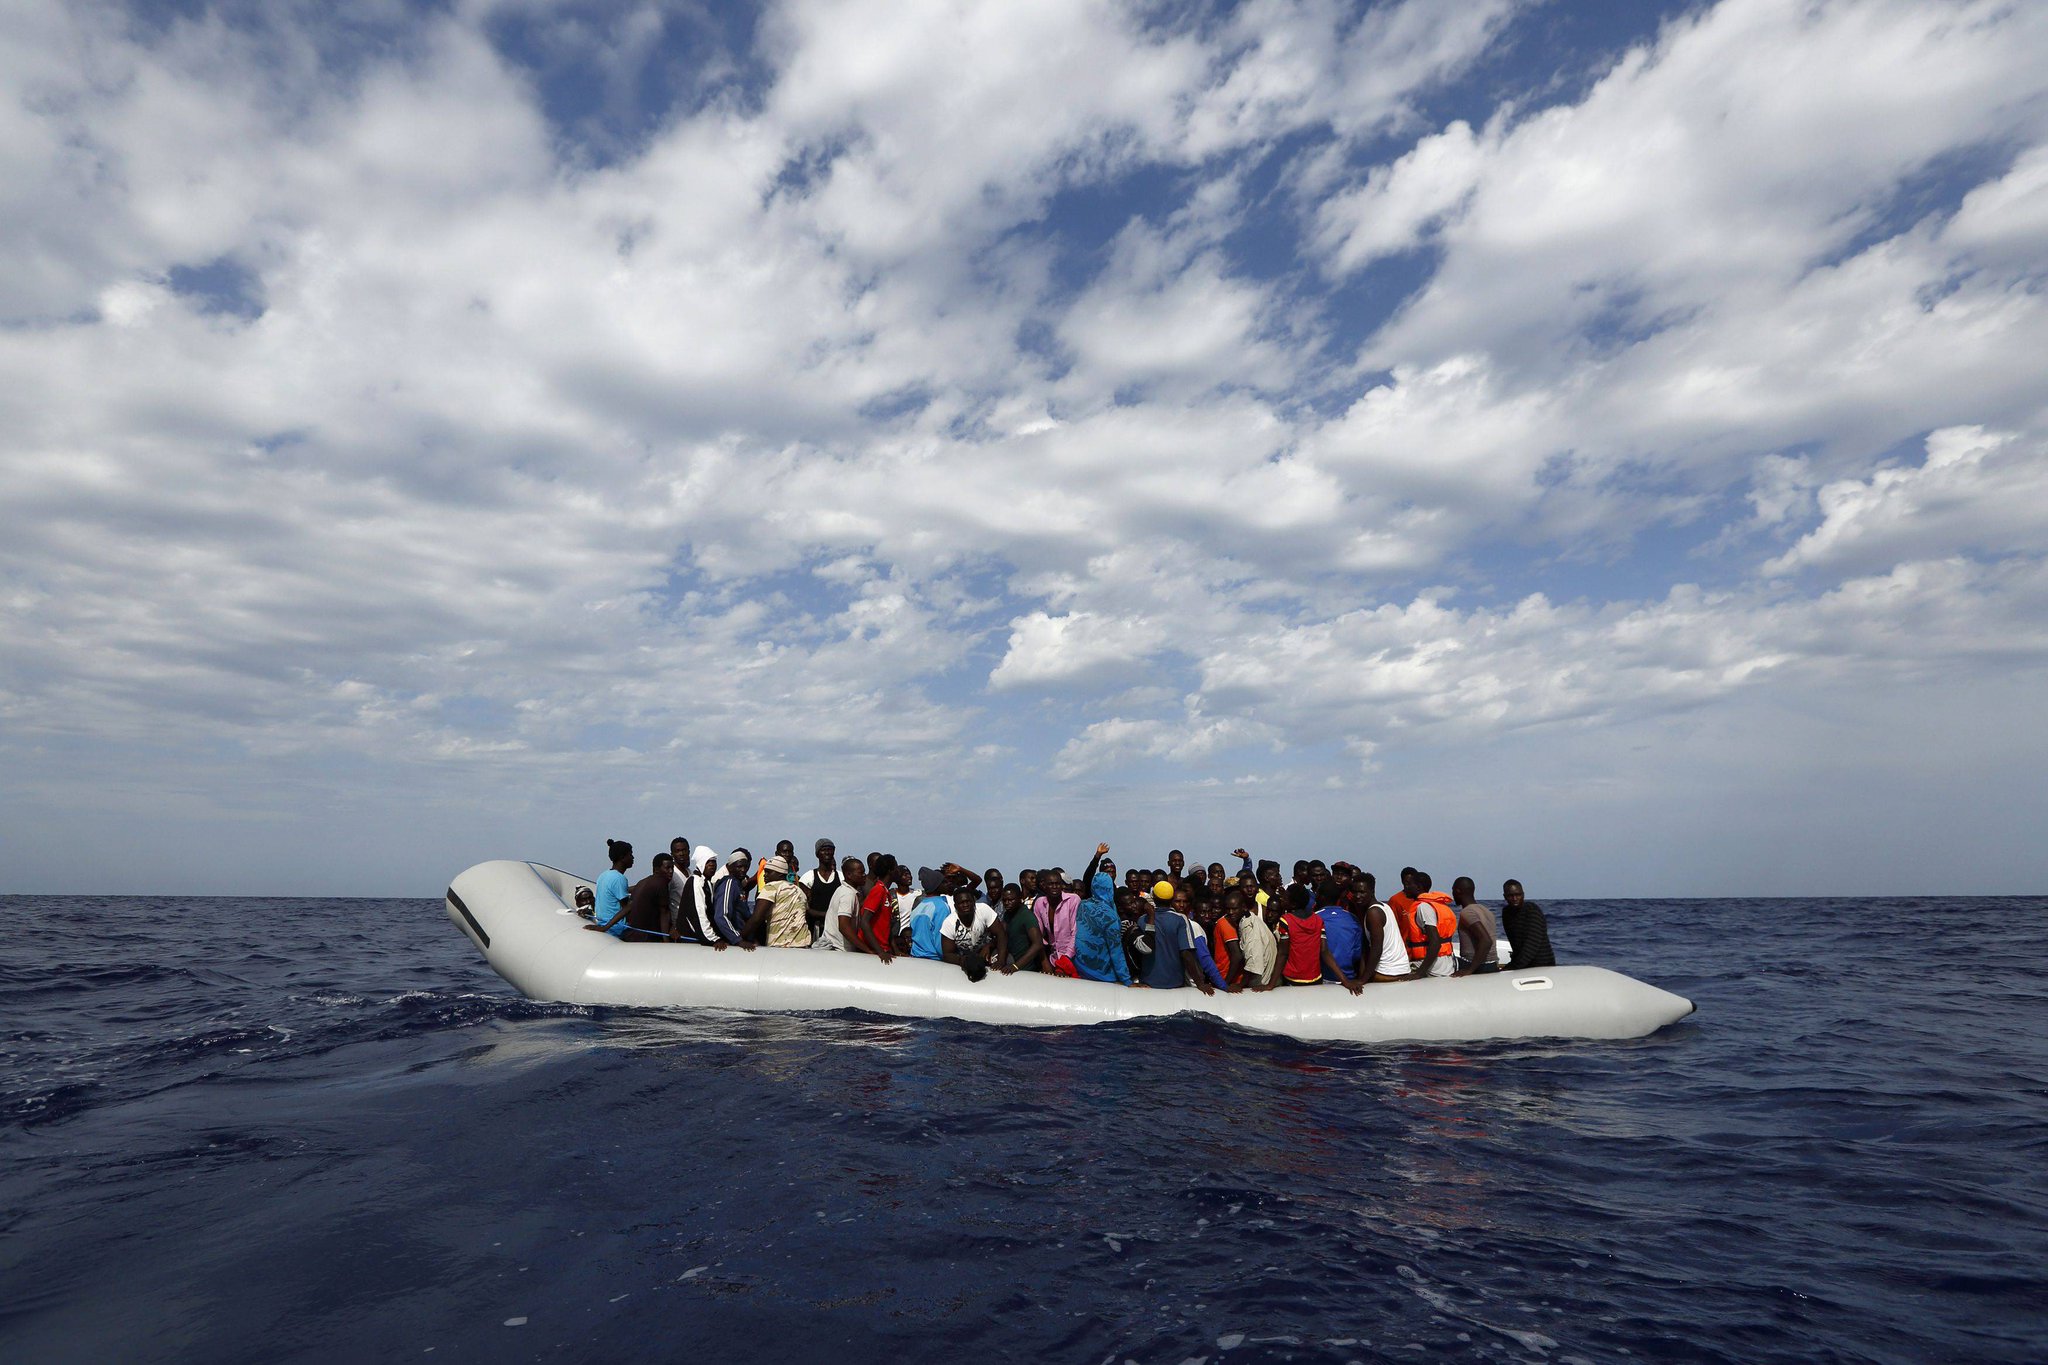
Migrant crisis: more than 4,000 migrants and refugees have had to be rescued by the Greek Coast Guard off the shores of Lesbos this month alone. Migrant tragedy in Greek seas shows dangers as winter nears (Monthly record of 218,000 reach EU by sea) EU predicts 3 million more migrants could arrive by end 2016
The rubber dinghy rolled perilously on the waves and twisted sideways, nearly flipping, as more than three dozen passengers wrapped in orange life vests screamed, wept and cried frantically to God and the volunteers waiting on the rocky beach.
Khalid Ahmed, 35, slipped over the side into the numbing waist-high water, struggled to shore and fell to his knees, bowing toward the eastern horizon and praying while tears poured into his salt-stiff beard.
“I know it is almost winter,” he said.
“We knew the seas would be rough. But please, you must believe me, whatever will happen to us, it will be better than what we left behind.”
Migrants from Turkey arriving on the Greek island of Lesbos in early November.
The great flood of humanity pouring out of Turkey from Syria, Afghanistan, Iraq and other roiling nations shows little sign of stopping, despite the plummeting temperatures, the increasingly turbulent seas and the rising number of drownings along the coast.
If anything, there has been a greater gush of people in recent weeks, driven by increased fighting in their homelands — including the arrival of Russian airstrikes in Syria — and the gnawing fear that the path into the heart of Europe will snap shut as bickering governments tighten their borders.
“Coming in the winter like this is unprecedented,” said Alessandra Morelli, the director of emergency operations in Greece for the United Nations High Commissioner for Refugees.
“But it makes sense if you understand the logic of ‘now or never.’ That is the logic that has taken hold among these people. They believe this opportunity will not come again, so they must risk it, despite the dangers.”
A dinghy crowded with migrants approaching Lesbos.
Refugees and relief workers shrug when asked how far into winter people will try to make the treacherous crossing.
The surge means that countries throughout the Balkans and Central Europe already under intense logistical and political strain will not find relief — especially Germany, the destination of choice for many of the refugees.
Hopes that weather and diplomacy would ease the emergency are unfounded so far, putting more pressure on financially strapped and emotionally overwhelmed governments to quickly find more winterized shelter.
The influx also underscores the European Union’s failure to reach a unified solution to the crisis, leaving places like this, on the Greek island of Lesbos in the northern Aegean Sea off the coast of Turkey, struggling to deal with huge numbers of desperate people and raising questions about what will happen not just this winter, but in the spring and beyond.
Early this week, the number of people who had crossed into Greece from Turkey hit 600,000, after having passed 500,000 only a few weeks earlier.
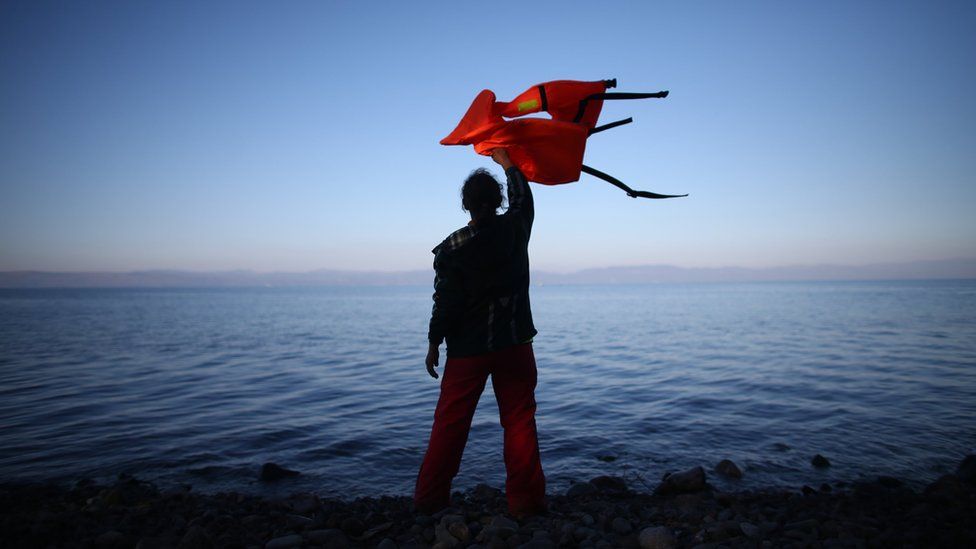
Boats and life jackets left by migrants on a Lesbos beach.
“Coming in the winter like this is unprecedented,” said Alessandra Morelli, the director of emergency operations in Greece for the United Nations High Commissioner for Refugees.
Both migrants and relief workers shrug when asked how far into the winter people will try to make the treacherous crossing.
“Some of the smugglers, they tell the people who call them, ‘Yes, there will be more trips, you should come,’ and so the people keep coming,” said Abu Jawad, a 28-year-old Palestinian Syrian who works as a broker for Turkish smugglers, recruiting passengers from the crowds in Izmir, Turkey, and other coastal cities.
“So what I think is that people will keep coming as long as the smugglers tell them to come, and the smugglers will keep attempting trips as long as the people are coming,” he said.
In mid-October, an average of 8,700 a day were landing in Greece, peaking at 10,006 on Oct. 21. Fistfights broke out, and there were some stabbings, as people tried to cut in line to get the precious documents from Greek officials that allowed them to take a ferry to Athens and beyond.
Relief workers sent out pleas for help and resources.
But smaller numbers of migrants arrived, largely because of the weather, and the adoption of a new system that divided the migrants into groups to apply for the necessary papers allowed officials in Lesbos to more easily send refugees on their way.
The landings fell to an average of 5,800 a day before creeping up to 6,200 per day in the last seven days. In all, 16,500 people were waiting in camps across the Greek islands on Wednesday for transport to the mainland.
But the calm may be short-lived: a four-day strike by Greek ferry workers that began on Tuesday threatened once again to create bottlenecks and overwhelm relief workers who had only just begun to catch their breath.
In the meantime, with every break in the weather, rafts and dinghies continue to wash ashore.
On Saturday, 9,300 people landed on the Greek islands, when it was unseasonably balmy.
On the next two days, when the north winds blew more fiercely, about half that number arrived.
On Tuesday, once again, the seas calmed and boats appeared one after another pushing across the choppy strait.
“We had no choice,” said Nouri Mahmoud, 60, who once ran a small oil company in Syria.
“We had to leave Aleppo. It has gotten much worse in recent weeks. The rebels are fighting each other, and now we have the Russians, too. Everyone is fighting everyone else. Whoever comes into Aleppo next is going to be slaughtering people.”
Clustered around him in the doorway of a temporary shelter at a refugee center were his wife and his 15-year-old triplets.
“We can’t go back now,” Mr. Mahmoud said.
“We have nothing to go back to.”
A man holds up a young boy as a boat carrying migrants and refugees arrives at the Greek island of Lesbos after crossing the Aegean sea from Turkey
Photo: AFP
That the crossing is getting more perilous — as it does every winter when the northern winds and the sinking temperatures churn and chill the sea — is beyond doubt.
Last Wednesday, a boat carrying more than 250 migrants — a “yacht,” the Turkish smugglers call them, but they are usually old and creaky tubs — foundered in the stretch between Turkey and the north shore of Lesbos.
More than three dozen drowned.
And that was only the largest recent catastrophe.
In one day this week, 11 people died when a boat capsized just 30 yards off the shore of Samos, another Greek island; two died off the shore of Rhodes, and six perished in the waters north of Lesbos.
“We are confronted with these shipwrecks every day now,” Ms. Morelli said.
In an outdoor coffeehouse one afternoon last week outside the main train station in Izmir, several dozen Syrian refugees sipped tea at rickety tables.
Nearby shops sell life jackets, inner tubes and waterproof packets for cellphones and passports.
“Of course, we are aware that winter is coming, but it took us this long to sell all of our land and our house in Deir ez-Zor,” said Ahmed Ali, 28, who was surrounded by a half-dozen family members.
“Now, with the Russians bombing in places, we think the situation will be even worse.”
He is waiting, he said, to shop among the smuggling operations to try to divine which one he can trust.
“What choice do we have now but to move forward?” he said.
“We have nothing left at home to return to. Tell me, where else can we go?”
By late Tuesday night, Mr. Ali said, the family had already reached Lesbos, taken a ferry to Athens, crossed through Macedonia and Serbia and was making its way across the Croatian border.
A few yards away, at another tottering table, Adnan Sheikh Mohammad clicked shut his flip-phone and smiled broadly, clapping his cousin, Sami, on the shoulder.
“I have made a deal with a smuggler,” he said.
“God willing, we leave tomorrow.”
The price was $1,100 per adult, half that for the children, a sizable amount for a party of 12 adults and 10 children.
They plan to make their way to Sweden, where friends live, but they do not know the exact path they will follow.
“We are going to get off the boat in Athens and just follow the crowd,” said Sami, 39, who had been a barber in Aleppo.
A woman waved a life jacket to direct a migrant boat ashore as it made the crossing from Turkey to the Greek island of Lesbos.
Carl Court/Getty Images
The next afternoon, volunteers waited at high points on Lesbos’ shore and scanned the horizon.
Every now and then, small orange dots bobbing in the distance slowly clarified into a line of smaller orange dots.
As they drew closer, they transformed, like apparitions, into a few dozen people in orange life vests, waving frantically.
A volunteer clambered atop his car and began twirling a life vest over his head, signaling the boat to head to his left, away from a more treacherous stretch of shore.
But the migrants did not see him or were unable to control the boat, and it crashed into the surf line on a jagged patch of stones.
It had clearly been a terrifying crossing.
A half-dozen children wailed and clutched at their mothers, who were also weeping, the men looking about, trying to figure out what to do.
Volunteers charged into the waves and tried to keep the boat perpendicular to the shore, but the force of the water was too strong and it flattened against the shoreline, threatening to upend.
One by one — children first, then women, then men — the passengers were unloaded and escorted the final few feet to shore.
They looked around, dazed and tearful, but they all survived.
“Adi! Adi!” a frantic mother screamed, spotting her son leaning against a nearby rock.
She fell to the ground, pulled up the leg of his pants and began to kiss his shivering shin.
When we feel The Earth beneath our feet, see it with our eyes, hear it when the wind blows, we perceive only the most obvious filaments of a far more complex place.
Only with exquisite machines--spacecraft in orbit and powerful computers on the ground--can humanity begin to uncover the elegant nature of our complex home. Presented here are a collection of data visualizations based on observations gathered by a fleet of spacecraft. In various depictions we see the currents of the world's oceans, changes in temperature and land cover over time, and precipitation as it cycles energy and water around our living planet.
A team of NASA and university scientists has developed a new way to use satellite measurements to track changes in Atlantic Ocean currents, which are a driving force in global climate.
The finding opens a path to better monitoring and understanding of how ocean circulation is changing and what the changes may mean for future climate.
In the Atlantic, currents at the ocean surface, such as the Gulf Stream, carry sun-warmed water from the tropics northeastward.
As the water moves through colder regions, it sheds its heat.
By the time it gets to Greenland, it's so cold and dense that it sinks a couple of miles down into the ocean depths.
There it turns and flows back south.
This open loop of shallow and deep currents is known to oceanographers as the Atlantic Meridional Overturning Circulation (AMOC) -- part of the "conveyor belt" of ocean currents circulating water, heat and nutrients around the globe and affecting climate.
A schematic of the Atlantic meridional overturning circulation, otherwise referred to as the 'thermo-haline circulation', incorporating the Gulf Stream.
Because the AMOC moves so much heat, any change in it is likely to be an important indicator of how our planet is responding to warming caused by increasing greenhouse gases.
In the last decade, a few isolated measurements have suggested that the AMOC is slowing down and moving less water.
Many researchers are expecting the current to weaken as a consequence of global warming, but natural variations may also be involved.
To better understand what is going on, scientists would like to have consistent observations over time that cover the entire Atlantic.
"This [new] satellite approach allows us to improve projections of future changes and -- quite literally -- get to the bottom of what drives ocean current changes," said Felix Landerer of NASA's Jet Propulsion Laboratory, Pasadena, California, who led the research team.
Landerer and his colleagues used data from the twin satellites of NASA’s Gravity Recovery and Climate Experiment (GRACE) mission.
Launched in 2002, GRACE provides a monthly record of tiny changes in Earth's gravitational field, caused by changes in the amount of mass below the satellites.
The mass of Earth's land surfaces doesn't change much over the course of a month; but the mass of water on or near Earth's surface does, for example, as ice sheets melt and water is pumped from underground aquifers. GRACE has proven invaluable in tracking these changes.
NASA's GRACE satellites (artist's concept) measured Atlantic Ocean bottom pressure as an indicator of deep ocean current speed.
In
2009, this pattern of above-average (blue) and below-average (red)
seafloor pressure revealed a temporary slowing of the deep currents.
Credits: NASA/JPL-Caltech
At the bottom of the atmosphere -- on Earth's surface -- changes in air pressure (a measure of the mass of the air) tell us about flowing air, or wind.
At the bottom of the ocean, changes in pressure tell us about flowing water, or currents.
Landerer and his team developed a way to isolate in the GRACE gravity data the signal of tiny pressure differences at the ocean bottom that are caused by changes in the deep ocean currents.
“We've wanted to observe this phenomenon with GRACE since we launched 13 years ago, but it took us this long to figure out how to squeeze the information out of the data stream,” said Michael Watkins, director of the Center for Space Research at the University of Texas at Austin, former GRACE project scientist and a co-author of the study.
The squeezing process required some very advanced data processing, but not as many data points as one might think.
"In principle, you'd think you'd have to measure every 10 yards or so across the ocean to know the whole flow," Landerer explained.
"But in fact, if you can measure the farthest eastern and western points very accurately, that's all you need to know how much water is flowing north and south in the entire Atlantic at that section. That theory has long been known and is exploited in buoy networks, but this is the first time we've been able to do it successfully from space."
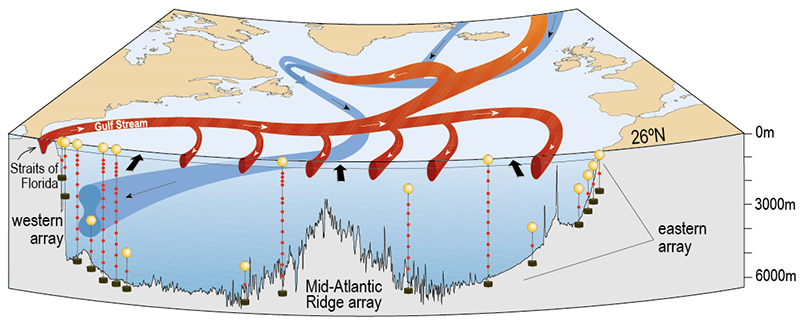
The new measurements agreed well with estimates from a network of ocean buoys that span the Atlantic Ocean near 26 degrees north latitude.
The agreement gives the researchers confidence that the technique can be expanded to provide estimates throughout the Atlantic.
In fact, the GRACE measurements showed that a significant weakening in the overturning circulation, which the buoys recorded in the winter of 2009-10, extended several thousand miles north and south of the buoys' latitude.
The ocean buoy network, known as RAPID, is operated by the Rapid Climate Change group at the U.K.'s National Oceanography Centre, Southampton, together with the University of Miami and the Atlantic Oceanographic and Meteorological Laboratory of the National Oceanic and Atmospheric Administration.
Gerard McCarthy, a research scientist in the RAPID group who was not involved with the study, said, "The results highlight synergies between [direct measurements] like [those from] RAPID and remote sensing -- all the more important given the rapid and surprising changes occurring in the North Atlantic at the present time."
Eric Lindstrom, NASA’s Physical Oceanography Program manager at the agency's headquarters in Washington, pointed out, "It’s awesome that GRACE can see variations of deep water transport, [but] this signal might never have been detected or verified without the RAPID array. We will continue to need both in situ and space-based systems to monitor the subtle but significant variations of the ocean circulation."
A paper in the journal Geophysical Research Letters describing the new technique and first results is available online in prepublication form.
The UKHO's Port Approach Guides are port-scale charts that contain a
wide range of planning and support information for some of the world's
busiest ports.
By allowing bridge crews to view this information in one
place, each guide can help to simplify a number of passage planning
tasks; making port entry and exit quicker and easier.
Information from a range of official ADMIRALTY charts and publications on one chart, helping bridge crews to plan for particular approaches and to support Master Pilot Exchange
Quick Response (QR) codes, providing easy access to current warnings and notices for specific port areas.
Expanding coverage of some of the world's most complex approaches, including Antwerp, Rotterdam and the Panama Canal.
Extra information to aid planning
Each chart contains planning information such as contact details and harbour regulations, Vessel Traffic Service (VTS) information, principal lights and landmarks, specific warnings, tide and climate information, anchorages and prohibited areas, dangerous cargo, pilotage, berth information and port services.
By allowing you to view this information in one place, each guide can help to simplify a number of passage planning tasks.
Quick reference
ICS flags are used to link text panels to chart features, helping you to identify warnings and notices for specific ports and improve situational awareness.
QR codes also provide quick access to important information such as port authority websites, as well as online supporting applications such as ADMIRALTY EasyTide and Notice to Mariners WebSearch.
Familiarity and up-to-date information
All charts display widely used and instantly recognisable features and chart symbols, giving you clarity and reassurance during times of peak workload and pressure.
Any changes to port areas are also highlighted by regular updates via ADMIRALTY Preliminary Notice to Mariners (PNMs).
These PNMs, as well as 7 day tidal forecasts, can be accessed using QR Codes on each chart and are also available within our weekly paper NM bulletin.
Find out which Port Approach Guides are available by downloading our release schedule here.
Simulation showing the major glaciers of the Amundsen Sea Embayment over three centuries of sustained retreat. The colours show the ice flow speed in metres per year.
The grounding line, which separates the grounded (resting on bedrock) ice from floating ice, is represented in bright blue.
It may be the biggest climate change story of the last two years.
In
2014, several research groups suggested that the oceanfront glaciers in
the Amundsen Sea region of West Antarctica may have reached a point of “unstoppable” retreat
due to warm ocean waters melting them from below. There’s a great deal
at stake — West Antarctica is estimated to contain enough ice to raise
global sea levels by 3.3 meters, or well over 10 feet, were it all to
melt.
The urgency may now increase further in light of just published research suggesting
that destabilization of the Amundsen sea’s glaciers would indeed
undermine the entirety of West Antarctica, as has long been feared.
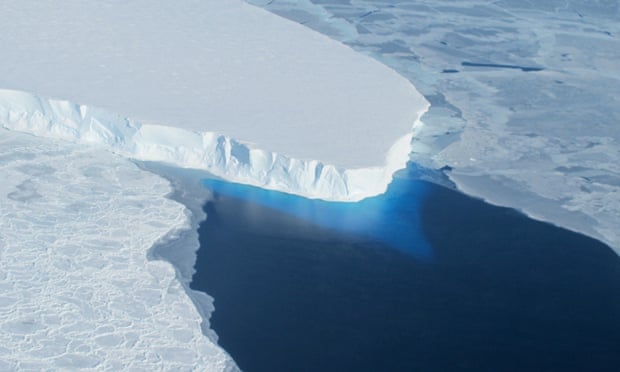
The Thwaites glacier in western Antarctica. Photograph: AFP/Getty
In a new study published
Monday in the Proceedings of the National Academy of Sciences, Johannes
Feldmann and Anders Levermann of the Potsdam Institute for Climate
Impact Research use a sophisticated climate model to study what will
happen if these glaciers are, indeed, fully destabilized.And in
essence, they find that the process of retreat doesn’t end with the
region currently up against the ocean.
“We showed that there is
actually nothing that stops it,” said Levermann.
“There are troughs and
channels and all this stuff, there’s a lot of topography that actually
has the potential to slow down or stop the instability, but it doesn’t.”
Or
as the paper puts it: “The result of this study is an if–then
statement, saying that if the Amundsen Sea Sector is destabilized, then
the entire marine part of West Antarctica will be discharged into the
ocean.”
The Potsdam Institute for Climate Impact Research shows what would happen if glaciers in West Antarctica melted.
West Antarctica can actually be considered the smallest of three planetary ice sheets
— Greenland contains some 6 meters (20 feet) of potential sea level
rise, and East Antarctica is the most vast of all, at nearly 60 meters,
or 200 feet.
However,
West Antarctica is currently believed to be the most vulnerable to
rapid, large scale change, due to the fact that the Amundsen
Sea’s glaciers are rooted on a seabed that slopes downward as you move
further inland, in some places plunging a mile or more below sea level.
The region’s largest glacier, the gigantic Thwaites, is bigger than
Pennsylvania and over a mile in total thickness in places — and may be
the single most vulnerable point.
Indeed, Antarctic scientists have expressed a strong consensus that
they need to conduct a lot more research in this very remote area as
soon as possible, to determine how fast the change could happen.
Antarctica is vital to the planet’s climate system.
The
current study was not an example of — and cannot replace — this
difficult fieldwork.
Rather, the researchers used a complex ice sheet
model that simulated the entire West Antarctic ice sheet, as well as the
Antarctic peninsula and some of East Antarctica.
They then simulated
what they termed a 20 to 200 year “perturbation” to the region, in the
form of increased rates of melt similar to what is believed may have
already happened.
“Our modeled sea-level contribution from the perturbed
region lies well within the range of observations,” they say.
With
a 60 year or greater perturbation, the model — which, the researchers
caution, is only “a single realization of an ice-sheet model that
applies approximations to the ice dynamics” — then produced a retreat
that continues even without continuance of the perturbation.
That is,
after all, precisely what has been feared — that the region has an
inherent “marine ice sheet instability,” as researchers put it.
“If
you have a situation where the bedrock is declining when you go inland,
that means that wherever the grounding line is, it is thicker the
further it is inland,” explains Levermann.
“Which means the [ice] flux
is bigger the further you go inland. Which means you lose more ice the
further you go inland, which is the vicious cycle.”
Levermann confirmed,
by email, that this in effect means that there is an “inherent”
instability to West Antarctica, based on his new research.
Here’s a visualization of what is happening with West Antarctica, and how a “marine ice sheet instability” works:
The critical issue here is, of course, the speed at which this could all
occur.
The new study’s simulations show the loss of West Antarctica
playing out over thousands of years. But many scientists worry that at
least some of the change could happen faster.
“We know very little about the new world we are entering of rapid retreat into deep basins,” said Sridhar Anandakrishnan,
a glaciologist at Penn State University who has conducted research atop
Thwaites glacier and reviewed the study for the Post, by email.
“There
are likely processes there that we haven’t fully accounted for. For
example, as the grounding line shifts farther back, the ice front may
start to fracture and fail — something we don’t see today because we
don’t have any deep grounding lines to study and use as analogies.”
When
asked how fast he thought all of this could unfold, Levermann
underscores that we simply don’t know.
“And by we don’t know, I mean, we
don’t know,” he says.
“I don’t want to say it’s quicker, but it’s much
more likely that it’s faster than these thousands of years, than [that]
it’s slower.”
He points out that based on reconstructions of the
planet’s past, there are reasons to think sea levels can rise fairly
rapidly.
The study therefore concludes that:
The
currently observed retreat in West Antarctica hence might mark the
beginning of a millennial period of self-sustained ice discharge from
West Antarctica and require long-term global adaptation of coastal
protection, such as the building or rebuilding or raising of dykes, the
construction of seawalls, or the realization of land fills in the
hinterland.
Given the significance of the findings, the Post asked several other Antarctic experts to comment on the work.
Anandakrishnan,
who was concerned that sea level rise could happen even faster than in
the study, nonetheless called the work a “fascinating study that shows
the tipping points in the stability of the whole West Antarctic Ice
Sheet (not just Thwaites or Pine Island, as some previous studies have
shown)” by email.
“The retreat of Thwaites continues past any ‘local’
ups and downs in its bed, and affects the glaciers that flow into the
Ross Ice Shelf and into the Filchner Ronne Ice Shelf.”
(You can see
these regions on the map above.)
Antarctic sea ice likely reached its annual maximum extent on Oct. 6, barring a late season surge. This video from NASA shows the evolution of the sea ice cover of the Southern Ocean from its minimum yearly extent to its peak extent. see NASA
Jonathan Bamber, a glaciologist
at the University of Bristol in the UK, also praised the study, calling
the model “sophisticated” and adding, “It make take millennia for a full
collapse but once it’s started we’re fully committed to multiple metres
of sea level rise. How quickly we reach this point of no return, and
how rapidly it proceeds, are sensitive to certain model details but what
is clear is that the next few decades will determine whether the WAIS
is just endangered or on its path to extinction.”
What’s
striking is that even though we are now having this discussion about
possible destabilization of West Antarctica, scientists are still not
fully sure about what has caused the phenomenon.
One suspicion, however,
is that the warming of the climate as a whole has changed wind patterns
around Antarctica which, in turn, has also changed ocean patterns —
allowing warmer water to reach the bases of mostly submerged glaciers
that hold back the gigantic volumes of inland ice.
There is some concern that similar processes may also play out in submarine based glaciers of East Antarctica —
although so far, scientists have not identified a part of the Antarctic
continent that is both as vulnerable, and also experiencing as rapid
change, as West Antarctica.
Despite all of this, Levermann
cautions that the results should not be over-interpreted in an alarmist
way, since whatever change may be occurring, it is certainly
not expected to happen all at once.
“No one has to be afraid of sea level rise,” he says.
“One should be worried about sea level rise. It is not a threat to people, it’s a threat to things, and land, and cultural heritage.”
The Philippines has won an important ruling in its case against China over disputed parts of the South China Sea, with an arbitration court in the Netherlands saying it has jurisdiction in the case and will hold hearings.
The Permanent Court of Arbitration in The Hague issued the ruling on Thursday, in proceedings that China has boycotted since the Philippines, an ally of the United States, filed suit at the court in 2013.
The ruling was a blow to China, which had hoped the court would reject jurisdiction, allowing Beijing to continue making a case that its claims in the South China Sea are based on history rather than legal precedent.
The Philippines welcomed the decision on Friday and said it was prepared to argue the merits of its case before the tribunal.
“Our people can be assured that those representing our country have been continuously preparing for this,” said Abigail Valte, a spokeswoman for the Philippine president, Benigno S. Aquino III.
China’s Foreign Ministry said the country would not accept any ruling from the court, a standard statement from the ministry on the case.
It accused the Philippines of “a political provocation under the cloak of law.”
The case is being closely watched by the United States and other Asian nations that are claimants in the South China Sea, where China asserts sovereignty over islands and reefs within about 90 percent of the strategic waterway.
The Philippines — represented by an American lawyer, Paul Reichler, of the Washington law firm Foley Hoag — contends that it has the right to exploit oil and gas in waters in a 200-nautical-mile exclusive economic zone extending from territory that it claims in the South China Sea.
The Hague court rejected Beijing’s claims that the disputes in the sea are about its territorial sovereignty, which China says is based on historical rights and is indisputable.
Mr. Reichler made his arguments in July before the court, which was established in 1899 to encourage the peaceful resolution of international disputes.
There had been speculation about whether the court would accept the case, given China’s absence from the proceedings.
Who Claims What? China claims sovereignty over all South China Sea islands and their adjacent waters and delineates its claims with a 'nine-dash' line, based on a map issued in 1947, but has never published coordinates for its precise location. China's claims overlap with those of Vietnam, Malaysia, Taiwan, Brunei and the Philippines.
Sources: Center for Strategic and International Studies (claim boundaries); U.S. Department of Defense (outposts)
The court ruled on Thursday that it had the authority to hear the Philippines’s submissions, which are based on the United Nations Convention on the Law of the Sea, a set of laws that the United States has not signed but uses as the basis of its policies in the heated contest with China over the South China Sea.
This week, an American destroyer, the Lassen, sailed within 12 nautical miles of Subi Reef, in the Spratly archipelago near the Philippines, which China has built into an artificial island.
A Chinese military airstrip is under construction on the island.
The American naval operation was devised to show that the new island does not have a 12-mile territorial zone.
The Law of the Sea says that bits of rock or reef that are elevated only at low tide are not entitled to such a zone.
In part of its case, the Philippines argues that China has prevented Philippine vessels from exploiting the waters adjacent to Scarborough Shoal and Johnson Reef, two small outcrops favored by fishermen.
In 2012, China put a barrier across the entrance to Scarborough Shoal that prevented Philippine fishing boats from entering its waters.
A deal brokered by the United States that called for both countries to withdraw from the shoal soon fell apart.
Assets in the Region The size of China's maritime fleet far outnumbers the fleets of other countries in the region.
Sources: Office of Naval Intelligence; U.S. Department of Defense; regional naval officers; Congressional Research Service
Jay Batongbacal, the director of the Institute for Maritime Affairs and Law of the Sea at the University of the Philippines, said the ruling would be useful in diplomatic negotiations with other countries that oppose China’s actions in the South China Sea.
“The ruling could act to embolden and bring unity to the other claimants,” he said.
Zhu Feng, the executive director of the China Center for Collaborative Studies of the South China Sea at Nanjing University, said the ruling was not a defeat for China, adding, “The international jurisdiction will always move in its own way.”
But he said he supported the idea of China becoming more involved in the court proceedings.
“I hope Beijing could become more active in participating in all forums and respond to the international ruling at the tribunal,” he said.
Links :
HuffingtonPost : Philippines vs. China: International Law or Rule of the Jungle?
TheDiplomat : A Legal Analysis of the Philippine-China Arbitration Ruling
 Ran Ortner Documentary Teaser (Sept) from Todd Holland