On 11 June 2016, Libyan militia aligned to the UN-backed unity government took control of much of the city of Sirte after fierce fighting with Islamic State militants.
As forces advance into a city which has been held by ISIS for two years, we look at the impact losing Sirte will have on the terror group’s maritime operations on the Libyan coast.
Libya coast with the GeoGarage platform (NGA chart)
ISIS and Sirte
When ISIS took control of Sirte in spring 2015 it quickly became its most important base of operations outside of Iraq and Syria.
The city soon became the home to ISIS leadership, who claimed it marked a key success for its territorial caliphate in North Africa.
However, as the anti-Islamic State coalition advances towards ISIS capitals in Iraq and Syria (Mosul and Raqqa), the importance of maintaining Sirte will become less critical for ISIS.
It is likely that the Islamist group will withdraw from Sirte when they lose control – a situation similar to when ISIS fought for its first Libyan stronghold, Derna, before relinquishing it in June 2015 to preserve Sirte.
Whilst losing Sirte will be a significant blow to ISIS, it has been laying the groundwork to withdraw from the city and regroup elsewhere in Libya for months.
Media reports suggest that ISIS have already sent convoys from Sirte towards the south-west region of Fezzan.
Changing Tactics
With the establishment of a new operating base in the Fezzan region the priority for ISIS, it is likely to then evaluate its choices for further operation in order to re-establish the caliphate that it desires.
Operationally, the terror group is likely to launch attacks aimed at undermining the new Tripoli based Government of National Accord (GNA) and will do so in two ways: launching raids on oil infrastructures to hurt Libya’s economy, whilst attacking urban areas to disrupt public confidence in the new GNA government.
Tripoli harbour with the GeoGarage platform (NGA chart)
Cities with a high population density such as the sea port cities of Tripoli or Misurata are possible targets.
Gulf of Aden with the GeoGarage platform (UKHO chart)
This capability has been evident already in its attempts to slow down the GNA’s advance in to Sirte through its use of car bombs and improvised explosive devices; more so than in Aden and al Mukalla (Yemen) where the group is competing with Al-Qaeda in the Arabian Peninsula (AQAP) as the dominant Jihadi insurgency amongst civil war.
Al Mukala harbour (Yemen) with the GeoGarage platform (NGA chart)
With a withdrawal expected to an area of south-west Libya, ISIS will be given access to expand its operation westwards and set conditions for a caliphate in Tunisia or Algeria.
ISIS’s primary effort would be a cross-border insurgency aimed at seizing territory in Tunisia, similar to its March 2016 attack on Ben Guerdane, hoping to capitalise on local sympathies.
Libyan Peace
The removal of ISIS from Sirte is a positive sign.
However, it would be foolhardy to view this as a step towards Libyan peace or unity.
Instead, it is likely that the Libya National Army (LNA) will resume its hostile rhetoric towards the Government of National Accord (GNA), of whose legitimacy it does not acknowledge, whilst militias that support the GNA are likely to reopen control for Sirte over unresolved divisions.
Ending ISIS’s hold on Sirte was necessary, but the city’s fall in the absence of a political strategy could prove a catalyst for further conflict.
The lack of a political resolution will continue to drive instability in Libya, as its competing factions continue to prioritise their own interests over countering the ISIS threat.
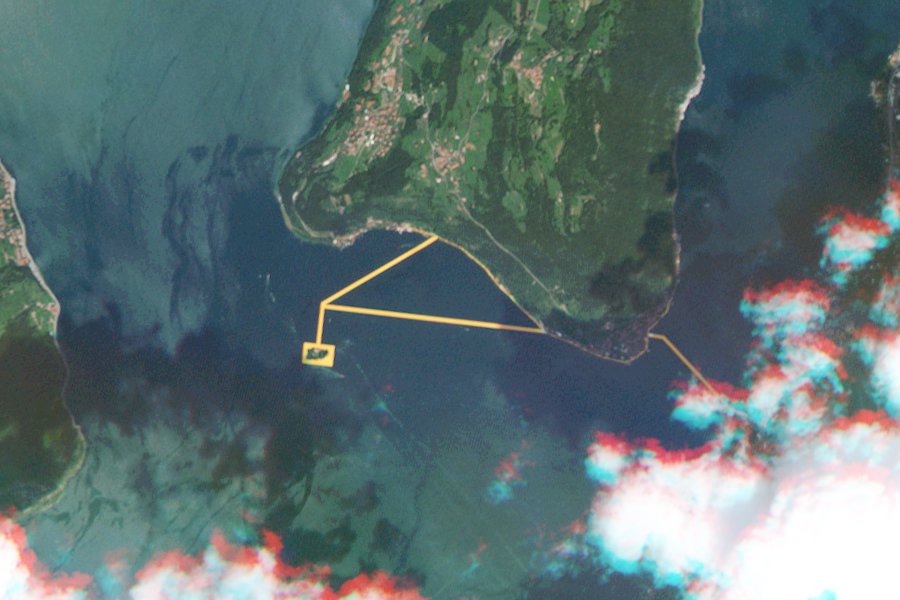
Sirte harbour with the GeoGarage platform (NGA chart)
Impact on Maritime Operations
Realising that oil would be difficult to sell on the black market from its position in Libya, ISIS quickly decided to attack and disrupt oil fields in the country instead of capturing them as a source of revenue, as they had done in Syria and Iraq.
This methodology has been evident in the raids on the coastal oil facilities of Zuetina, Ras Lanuf and As Sidr throughout January 2016.
Ra's Lanuf with the GeoGarage platform (NGA chart)
Whilst the loss of Sirte would make it harder for the terror group to target coastal oil facilities, and could mark an incremental step towards the eventual re-opening of closed oil ports such as Zueitina,
As Sidr and Ras Lanuf, ISIS is likely to retain active cells throughout the country and will continue to try and undermine oil production.
In the past, Dryad has assessed that ISIS actually posed a low threat to shipping in the main Mediterranean shipping lanes due to a lack of any real intent and capability as well as limited opportunity.
The loss of Sirte will further limit their freedom of manoeuvre on the coast, which reduces their opportunity to conduct offshore attacks.
However, Dryad continues to consider that an attack close to shore on a ship in, or approaching, a Libyan port remains a possibility.
In summary, the removal of ISIS from Sirte is likely to decrease the maritime threat in the region as the terror group moves its base from the coastal area inland.
Nevertheless, there remains a high threat, with Jihadi sympathies widespread throughout Libya and a significant risk ashore in port cities where ISIS is likely to retain cells.
Improvements to ocean temperature measurements are making good measurements great
I have often said that global warming is really ocean warming.
As humans add more heat-trapping gases to the atmosphere, it causes the
Earth to gain energy. Almost all of that energy ends up in the oceans.
So, if you want to know how fast the Earth is warming, you have to
measure how fast the oceans are heating up.
Sounds easy enough at first, but when we recognize that the oceans
are vast (and deep) we can appreciate the difficulties.
How can we get
enough measurements, at enough locations, and enough depths, to measure
the oceans’ temperatures?
Not only that, but since climate change is a
long-term trend, it means we have to measure ocean temperature changes
over many years and decades.
We really want to know how fast the oceans’
temperatures are changing over long durations.
But that isn’t all.
Throughout the years, we have made changes to the
measurement methods.
From old canvas buckets that were dipped into
waters which were then measured, to insulated buckets, to temperature
probes on the hulls of ships, devices that would be dropped into deep
ocean waters, and now the ARGO fleet, which is approximately 3,000
autonomous devices that are more-or-less equally distributed across the
oceans.
Each of these devices measures temperatures a little
differently; they have biases.
As you change from one set of instruments
to another, you might see a cooling or warming effect related to the
change in instruments, not because the water temperatures are changing.
The seeming intractability of this problem is why I began studying it
a few years ago.
I have worked with colleagues to answer a very
specific equation related to one of the most commonly employed ocean
measurement devices, the eXpendable BathyThermograph (or XBT for short).
For many years, these devices formed the backbone of ocean temperature
measurements.
My colleagues and I want to ensure measurements from XBTs
are as accurate as possible.
UCI Marine Scientist Jim Nickels takes a second to show us some "Old School Science" equipment, -a Bathythermograph, and explain it's purpose.
These
devices are used by navies to measure the depth of the thermocline.
While that was their original mission, climate scientists have adopted
the devices for determining long-term ocean temperature changes.
The
problem is that the devices are relatively simple; they are freely
dropped into ocean waters.
As they descend, like a spinning torpedo,
they unwind a wire connected to a computer system on-board the ship.
A
sensor in the probe sends temperature information to the computer system
and a recording is made.
When the device expends its wire, the wire
breaks and the device continues to fall until it impacts the ocean
floor.
It’s important for scientists to know the depth of each temperature
measurement that the probe makes. The problem is, the probe does not
detect its depth.
Rather, its depth is estimated by knowing how fast the
probe falls in water.
The probe weight is balanced by drag forced
between the water and the device.
If the knowledge of probe speed is not
known accurately, it means a scientist may think the probe is at one
depth when in fact, it’s at a different depth.
This subtle uncertainty
can lead to large uncertainties in the overall ocean heat content.
Extensive experiments have shown that our expectations of probe speed
is suitable in areas where the ocean water is warm.
But, what about
Arctic regions?
There, where water is cold, the water has a higher
viscosity (and consequently drag force).
We wanted to know whether we
could correct that archive of ocean temperature measurements to account
for measurements made in cold waters.
To solve this problem, I teamed up
with world-class scientists Dr. Lijing Cheng and Rebecca Cowley.
Lijing
Cheng is a rapidly rising international scientist from the Chinese
Academy of Sciences.
He is currently producing some of the best research
on the Earth’s energy imbalance.
Rebecca Cowley is a data expert from CSIRO in Australia.
Her group is
recognized as among the best in ocean heat content measurements and
data quality.
Map of XBT lines
An eXpendable BathyThermograph (XBT) is a temperature probe that is dropped into the ocean from a ship, either by hand or using using an automatic launching system.
Temperatures are recorded as the probe drops at a known rate through about the upper kilometer of the ocean.
By making measurements at the same location at regular intervals, it is possible to observe the evolution of the thermal structure of the upper ocean. NOAA employs two sampling modes for deployment of XBT probes, each serving a different scientific purpose: Frequently Repeated (FR) and High Density (HD).
The article was just published by the American Society of Meteorology and can be found here.
Our data shows that as you move from warm waters to cold waters, probe
descent speed changes by approximately 2%.
We provided a simple way that
oceanographers could account for this effect in their data, and we then
compared our proposed correction to high-quality temperature data
obtained from side-by-side temperature experiments with two different
instruments.
We showed that our method reduces temperature error and
increases our understanding of ocean warming.
I asked Rebecca Cowley for her perspective on this study and she said,
We can see the effects of climate change in our oceans. To do
this, we measure changes in temperature in our oceans over decadal time
scales. Measuring the temperature of ocean water is not a new thing, it
has been done for hundreds of years, and over time, measurement
techniques have changed. In modern times, the XBT has been used
extensively to measure ocean temperature and is only one of many
methods. XBT data is special because it comprises ~50% of historical
data between 1967 and 2001, a huge resource for oceanographers and for
estimates of decadal changes in ocean temperature. Small biases in the historical XBT data have been identified and
various bias corrections have been developed which greatly improve the
XBT data for climate change estimates. This work focusses on a purely
physical method to estimate a fall rate for the XBT, which is unusual in
the field of bias correction estimates. By looking at the physical
shape of the XBT probe the fall rate is modelled. Other bias correction
studies have looked at comparisons between XBTs and other instruments. When we apply fall rate bias corrections, we improve the
historical XBT dataset (a massive resource), reduce the bias errors and
give estimates of ocean warming that are more comparable to the results
we see with other instrumentation. In turn, the XBT data becomes very
useful as it fills the gaps in time where we have very few other
instruments collecting ocean temperature data. The XBT data also becomes
useful for global ocean models – the data is included in the models and
it improves their accuracy. Improving the accuracy of our ocean models
leads to better forward estimates of future climate change impacts.
Sometimes science isn’t sexy.
Sometimes, you spend hours, days, and
weeks to create small improvements in data.
But at the end of the day,
these small improvements add up.
Being able to say we made things better
is one of the reasons we got into science in the first place.
Through his music, acclaimed Italian composer and pianist Ludovico Einaudi has added his voice to those of eight million people from across the world demanding protection for the Arctic.
Einaudi performed one of his own compositions on a floating platform in the middle of the Ocean, against the backdrop of the Wahlenbergbreen glacier (in Svalbard, Norway).
Italian pianist and composer, Ludovico Einaudi, today performed one of his own compositions, Elegy for the Arctic, on a floating platform in the Arctic Ocean, against the backdrop of the Wahlenbergbreen glacier (in Svalbard, Norway).
Through his music Einaud has added his voice to those of eight million people from across the world demanding protection for the Arctic.
Speaking onboard the Arctic Sunrise, Einaudi said:
“Being here has been a great experience. I could see the purity and fragility of this area with my own eyes and interpret a song I wrote to be played upon the best stage in the world. It is important that we understand the importance of the Arctic, stop the process of destruction and protect it."
The musician, known for his composition for the film, “Black Swan” and the television serial, “Doctor Zhivago”, travelled onboard the Greenpeace ship Arctic Sunrise on the eve of the week-long meeting of the OSPAR Commission, which could secure the first protected area in Arctic international waters.
The massive early retreat of sea ice due to the effects of climate change allowed the construction of a 2.6 x 10 metre artificial iceberg, made from more than 300 triangles of wood attached together and weighing a total of nearly two tonnes.
A grand piano was then placed on top of the platform.
For sixteen days – June 18 through July 3, 2016 (weather permitting) – Italy’s Lake Iseo is being reimagined. 100,000 square meters of shimmering yellow fabric, carried by a modular floating dock system of 220,000 high-density polyethylene cubes, undulate with the movement of the waves as The Floating Piers rise just above the surface of the water.
Visitors can experience this work of art by walking on it from Sulzano to Monte Isola and to the island of San Paolo, which is framed by The Floating Piers.
The mountains surrounding the lake offer a bird’s-eye view of The Floating Piers, exposing unnoticed angles and altering perspectives.
Lake Iseo is located 100 kilometers east of Milan and 200 kilometers west of Venice.
“Like all of our projects, The Floating Piers is absolutely free and accessible 24 hours a day, weather permitting,” said Christo.
“There are no tickets, no openings, no reservations and no owners. The Floating Piers are an extension of the street and belong to everyone.”
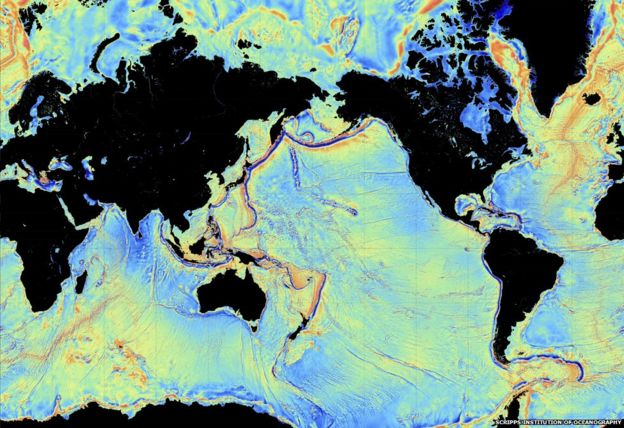
The blue areas have not been mapped with the most modern, high resolution technologies World Hydrography Day is celebrated on June 21 every year with the aim of giving suitable publicity to the work of hydrographers at all levels and of increasing the coverage of hydrographic information on a global basis.
Ocean experts have called for
international action to generate the kinds of maps of global seabeds
that space missions have already returned for the Moon and Mars.
The
call to "map the gaps" comes from GEBCO, the General Bathymetric Chart
of the Ocean, a body first set up in 1903 to compile maps from naval
surveys around the world.
But more than a century on from the
first international charts, vast expanses of the ocean are still
represented by just a single point where an ancient mariner threw a
lead-weighted rope over the ship side.
Only 5% of the seafloor has
been mapped by modern methods. Even around the UK, a nation with a long
maritime history, almost a third of the coast is unsurveyed.
The entire
Moon, in contrast, is known to a resolution of 7m, thanks to satellite
mapping.
"It's a matter of commitment," complains Larry Mayer,
director of the Center for Marine Science and Coastal Engineering at the
University of New Hampshire, a world-leading centre of oceanographic
expertise.
"We could map the entire deep oceans for $3bn - no more than a single Mars mission."
The founding meeting of GEBCO, from 1903, led by HSH Prince Albert I of Monaco
As another participant quipped, the community is "stuck between
ability and utility."
Existing maps are principally produced to support
shipping - to find safe routes for maritime traffic from supertankers
and trawlers to leisure craft.
Detailed measurements of the ocean bottom
are possible, but who would pay for it.
David Heydon, who founded
the submarine mining company Nautilus Minerals and directs another
exploration outfit, DeepGreen Resources, argues: "The land we live on is
one-third of the planet - it's rare.
The other two-thirds are more than
3,000m under the water. It'd be crazy not to understand it."
The question is how it would be used.
"How
can you build offshore windfarms, lay submarine cables, forecast storm
surges, if you don't know the shape and depth of your coastal regions,"
asks Robert Ward, president of the International Hydrographic
Organization, who is enthusiastic about a big scale-up of current
efforts.
The problem comes down to time and cost.
If London were
underwater, it would take weeks to map using conventional echo-sounding
methods, Ward explains; and several days even using the most modern
multibeam methods.
The type of multibeam echosounder used in the MH370 search
Today's survey vessels cost tens of thousands of dollars a day to
run.
Others point out that London would simply vanish as too small to
notice on many of the maps that currently exist.
Our ignorance of the seafloor came into sharp relief with the loss of the Malaysian airliner MH370.
"It
went down in an area where we knew almost nothing," explains Rochelle
Wigley, an oceanographer also based at the University of New Hampshire.
"There was just one modern survey line across an area the size of New
Zealand."
Her colleague Larry Mayer agrees: "Much of the effort
that's gone into finding [MH370] has been essentially making a base
map."
The area has turned out to be filled with ridges and canyons
spanning depths down to 7,000m, which has greatly hampered the search.
"If we'd had that base map, it would have saved months and months of time," the researcher asserts.
One solution could be the autonomous barge
The question that has dogged the debate at this week's forum is how much detail is needed.
More
detail means more time and more cost.
For many just a single
measurement every hundred metres would be a vast improvement on what's
available today, even though it would fall far short of the quality of
astronomers' lunar maps.
But anything worth investigating further could
be followed up later with dedicated missions.
Others argue that
the aim should be to beat the Moon maps, if the effort is to be
attempted.
Swarms of undersea robots scanning the seafloor would be
needed.
A tie up with the Xprize Shell Ocean Discovery Challenge seems a possibility.
Satellite gravity data can do a job - but it cannot see underwater mountains less than 1.5km in height
Larry
Mayer has a half-way proposition - a vast uncrewed barge laden with
equipment that could roam the high seas autonomously for just a third of
the cost of conventional missions, and never need to come into port.
With the biggest sonar array ever built, and controlled remotely, it
could focus in where necessary, and sweep up large areas of abyssal
plains at top speed.
"It would also be available if something
like an MH370 happened again," he promises, "to sail into a region where
you need a high-resolution search."
Such a self-steering vessel
really would resemble a Nasa space mission mapping an unexplored world.
What GEBCO lacks is a Nasa-style infrastructure and budget to make it
happen.
Anybody got a spare billion?
Used Google Earth to find size of creature which showed 30m (100 feet)
Sighting occurred on April 9, 2016 using 63° 2'56.73"S 60°57'32.38"W
Said it must be the Kraken, but also looks like a Plesiosaur
Another theory is this disturbance could be an underwater UFO
Nordic folklore speaks of a massive creature that haunted the icy seas of the North Sea, where it attacked passing vessels with gigantic tentacles.
And conspiracy theorists claims to have spotted this mythical Kraken swimming off the coast of Deception Island near Antarctica.
Using Google Earth, this sea monster appears to be 120m from head to end, with ‘the mid area of a giant squid’.
‘It looks like the Kraken,’ Scott C Waring shared on UFO Sightings Daily.com.
‘I used Google ruler and it says this is 30 meters (100 feet) from head to end, but the end looks like just the mid area of a giant squid, which means it could be 60+ meters long with tentacles.
'That sounds like the Kraken to me.’
The sighting occurred on April 9, 2016, when Waring looked at the coordinates 63° 2'56.73"S 60°57'32.38"W in Google Earth – although it is not clear how or where he obtained these exact coordinates.
Waring also thought of the extinct prehistoric animal Plesiosaur when he spotted the massive beast causing ‘a massive disturbance in the ocean’.
Bing imagery
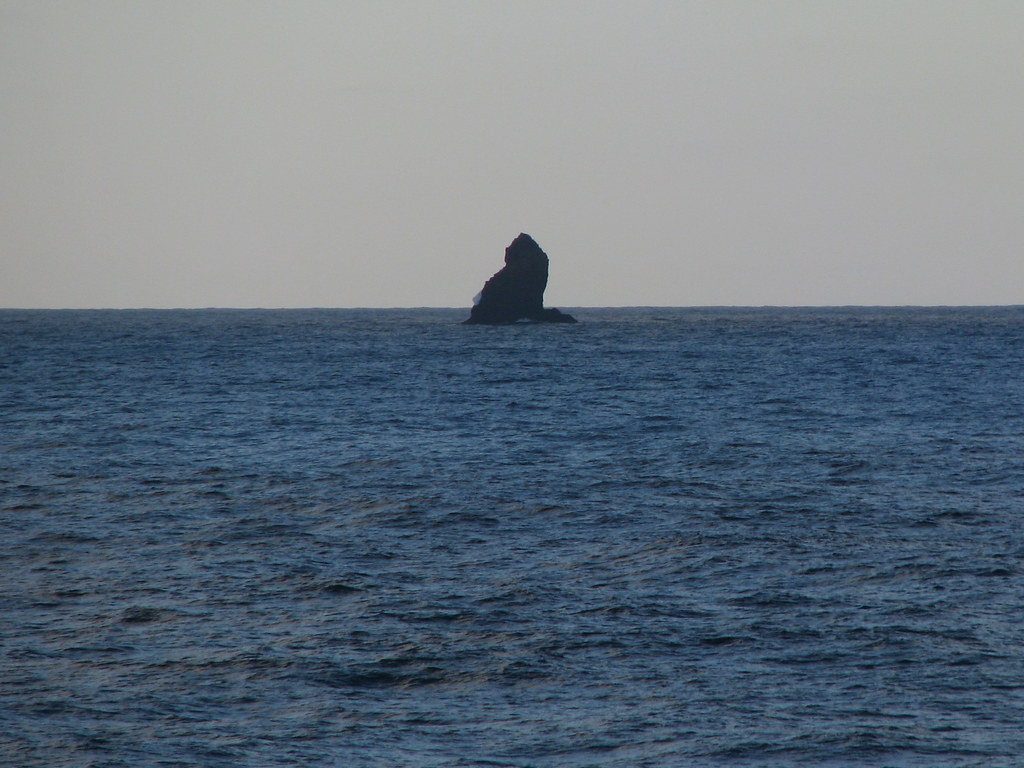
What a Deception :
Although there is no track of land in all the available online map viewers (see above), some maps show a rock at the supposed position of the Kraken closed to Deception Island in the South Shetland Islandsarchipelago:
Actually, the Kraken is an small rock named 'Sail Rock'.
Insular rock, 30 m high, lying 7 mi SW of Deception Island, in the South Shetland Islands.
This name, which dates back to at least 1822, was probably given by sealers.
Archinaute prepares a third way of navigation for the third millenium, a solution between sailing and motoring, to match the challenges of Energy Transition.
With the rotating sail principle, wind power can supply all the energies required aboard and Archinaute reaches operational capabilities quite similar to motorships with zero fossil fuel use and zero emission.


