Flying fish in flight
— Science girl (@sciencegirl) December 29, 2025
pic.twitter.com/iRwm51igha
Saturday, January 3, 2026
Flying fish in flight
Friday, January 2, 2026
Why the North Pole is now slowly moving towards London
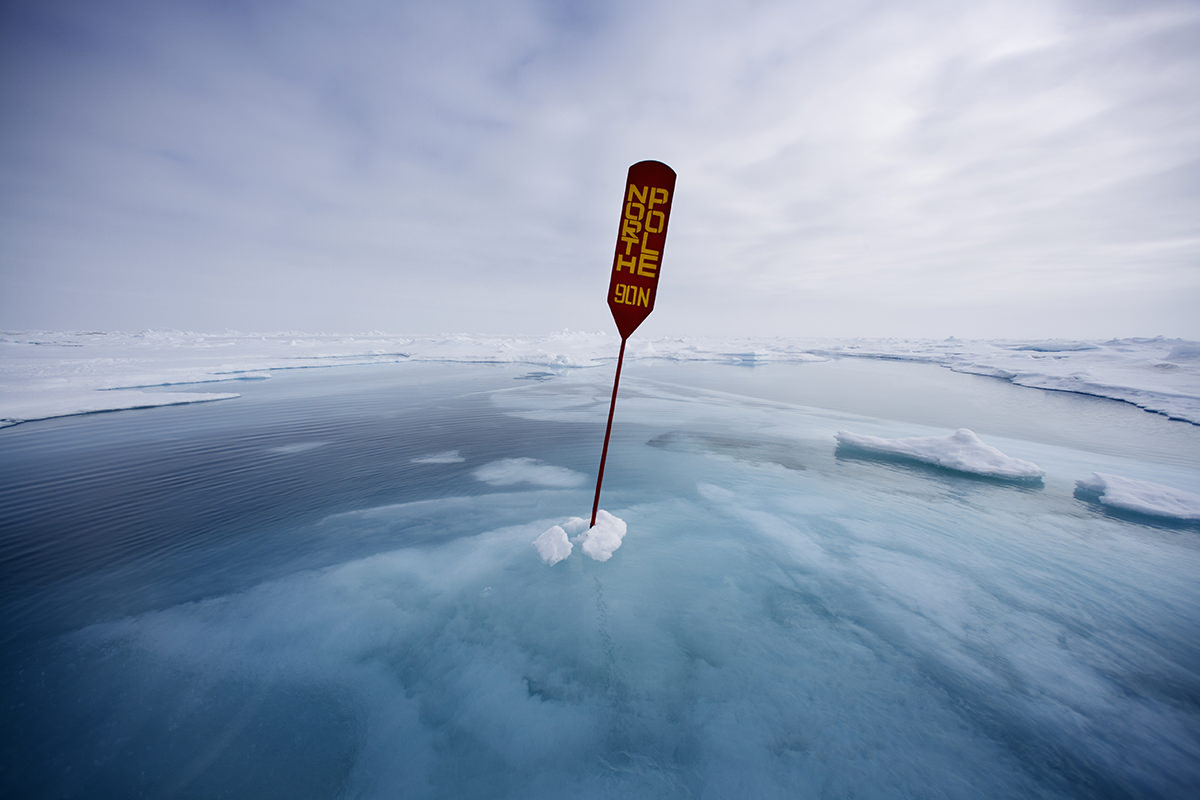
Sue Flood/Getty
London is calling.
The planet’s North Pole mysteriously changed the direction of its travel in 2000, turning eastwards towards the Greenwich meridian.
It now seems that this change in direction is down to the redistribution of water on land as well as to melting polar ice.
The Earth’s rotational axis, and with it the location of the physical North Pole, was travelling at a rate of about 10 centimetres a year over the last century towards Canada’s Hudson Bay along a line of longitude that runs through Toronto and Panama City.
This movement was down to the redistribution of Earth’s mass as the crust has slowly rebounded after the end of the last ice age.
Some evidence suggested that the shrinking of ice sheets in Greenland and Antarctica caused by climate change was behind the surprise shift.
Now, a study says this change is also influenced by the changing distribution of water on land.
“This is the first time we have solid evidence that changes in land
water distribution on a global scale also shift which direction the axis
moves to,” says lead researcher Surendra Adhikari of NASA’s Jet Propulsion Laboratory in Pasadena, California.
For example, Adhikari says, the Indian subcontinent and the Caspian Sea are losing a massive amount of water, pulling the axis eastwards.
Pole shifts aren’t just theories.
— Darshak Rana ⚡️ (@thedarshakrana) April 11, 2025
Earth’s magnetic poles are known to move.
But currently, the North Pole is shifting at an unprecedented rate—34 miles per year toward Russia.
Some researchers worry this fast movement signals a potential sudden shift.
NASA's research shows: pic.twitter.com/AeAEUY0Q6U
Always on the move
The study used data from NASA’s GRACE satellites to investigate how
the distribution of water mass was related to the direction of Earth’s
axis movement between 2002 and 2015.
The results also shed light on another long-standing puzzle: why the
axis oscillates every few years. This oscillation is also down to
changes in water mass around the planet, says Adhikari.
“The precise knowledge of polar motion, and Earth rotation in
general, is indispensable for many applications,” says Florian Seitz of
the German Geodetic Research Institute in Munich.
This includes GPS
navigation systems and the positioning of satellites.
The findings could
also help us study climate change, he says.
Because we have an accurate record of the axis’s movement since 1899,
we may now be able to use that data to map out past changes in the
distribution of land water more precisely.
This, in conjunction with factoring in where the axis is heading, could help make climate models more accurate.
Links :
- National Geographic : Climate Change Is Moving the North Pole
- ScienceAlert : The North Pole Is Slowly Moving Towards London, And Scientists Have Finally Figured Out Why
- GeoGarage blog : Earth's magnetic North Pole moving closer to Russia / Earth's Magnetic North Pole has begun racing towards ... / Earth's magnetic field is acting up and geologists don't ... / Scientists explain magnetic pole's wanderings / ESA scientists celebrate discovery of weird magnetism ...
Thursday, January 1, 2026

Wednesday, December 31, 2025
Trump’s Greenland purchase plan has been a US ambition since 1868

Copyright: xpiemagsx digcompie09122022-14431
From Arctic by Elías Thorsson, Marybeth Sandell
When President-elect Donald Trump once more floated the idea of purchasing Greenland, reactions ranged from ridicule to intrigue. Critics dismissed the notion as another eccentric Trump proposal. However, history reveals that the United States’ interest in Greenland is far from new—it’s a strategy that dates back more than a century.
From territorial ambitions in the 19th century to Cold War military priorities, Greenland has repeatedly caught the attention of American policymakers. But while the U.S. has eyed Greenland as a strategic asset, the political and legal dynamics surrounding the island have evolved significantly over time. Today, Greenland has self-rule and the right to declare independence from Denmark, fundamentally altering the terms of such discussions. Arctic Today has compiled a timeline of key developments in the history of U.S. interest in acquiring Greenland.
A Timeline of Greenland’s Ownership and U.S. Interest
1823: Monroe Doctrine
The Monroe Doctrine established U.S. opposition to European colonial expansion in the Americas. While it did not directly mention Greenland, the doctrine laid the groundwork for American territorial ambitions in the region.

The first official Danish map of Greenland where all sections of the coastline of Northeastern Greenland are charted. (Royal Danish Library)
1868: Early Negotiations
William H. Seward, then U.S. Secretary of State, pursued the acquisition of both Greenland and Iceland. Reports suggested that negotiations with Denmark for a $5.5 million purchase were nearly complete. However, no formal offer materialized.
Alternative:
1871-1872: Polaris Expedition
During the Polaris Expedition, American explorer Robert Peary claimed much of northern Greenland for the United States. Although these claims were unofficial, they underscored the strategic interest in the Arctic region.
1910: Renewed Proposals
U.S. Ambassador to Denmark Maurice Francis Egan discussed acquiring Greenland in 1910. While the idea gained traction in Washington, it did not progress to formal negotiations.

Francis Egan in 1923, wearing the Danish Medal of Merit (United States Library of Congress)
1917: A Trade with Denmark
In a notable exception to the Monroe Doctrine, the U.S. recognized Denmark’s ownership of Greenland in exchange for acquiring the Danish West Indies (now the U.S. Virgin Islands). This agreement was intended to bolster American control over the Caribbean and protect the Panama Canal.
1941: World War II Occupation
When Germany invaded Denmark, the U.S. landed armed forces in Greenland to secure the territory. Denmark, under occupation, agreed to the arrangement, and Greenland became a key American military asset during the war.

The USCG cutter Northland operating off Greenland during World War II. (U.S. Coast Guard)
1946: The $100 Million Offer
In the post-war period, U.S. interest in Greenland intensified. President Harry Truman offered Denmark $100 million (equivalent to $1 billion today) in gold bullion for the island. Senator Owen Brewster called the purchase a “military necessity” for Arctic defense.
In the post-war period, U.S. interest in Greenland intensified. President Harry Truman offered Denmark $100 million (equivalent to $1 billion today) in gold bullion for the island. Senator Owen Brewster called the purchase a “military necessity” for Arctic defense.

Official portrait of Harry S. Truman as president of the United States. (Harry S. Truman Library)
1953: Thule Air Base
As part of Operation Blue Jay, the U.S. constructed Thule Air Base in northern Greenland. The base became a vital hub during the Cold War, employing thousands of Greenlanders and hosting nearly 10,000 American personnel.

General view of Thule Air Base, Greenland, Denmark October 31, 2018. Picture taken October 31, 2018. Ritzau Scanpix/Linda Kastrup via REUTERS
1979: Greenland Gains Home Rule
Greenlanders voted overwhelmingly in favor of home rule, leading to the establishment of a local parliament. This marked a turning point in Greenland’s autonomy, granting control over areas like education, health, fisheries, and the environment.
1985: Departure from the European Community
Greenland withdrew from the European Economic Community (EEC), reflecting its unique economic and political needs. The move further solidified Greenland’s distinct identity within the Kingdom of Denmark.
2009: Self-Governance Act
The Self-Governance Act recognized Greenlanders as a distinct people with the right to self-determination under international law. The agreement laid out a pathway to full independence, contingent on Greenland’s economic viability—particularly revenues from mineral extraction.

Denmark’s Queen Margrethe hands over the law of Self government to the chairman of the Greenland Parliament, Josef Motzfeldt at a ceremony at the Greenland parliament, the Landstinget, in Nuuk June 21, 2009. REUTERS/Keld Navntoft/Scanpix
2019: Trump’s first Proposal
Inspired by discussions with advisor Ron Lauder, President Trump reportedly considered offering Denmark a trade involving Puerto Rico for Greenland. The proposal, discussed in the White House Situation Room, highlighted Greenland’s strategic importance and the enduring allure of its untapped resources.
2024: A Push for Independence
In February 2024, Greenland formally declared independence as its ultimate goal. While Denmark continues to provide significant subsidies, Greenland’s vast mineral wealth—including rare earth elements—offers the potential for economic self-sufficiency.
2025: Trump’s Renewed Interest
In late 2024, President-elect Trump reignited the discussion about purchasing Greenland. The idea reportedly originated from conversations between Trump and his pick for ambassador to Denmark, Ken Howery. Trump framed the proposal as a strategic investment to bolster U.S. Arctic dominance and access Greenland’s untapped natural resources. The renewed push, however, was met with skepticism from both Danish and Greenlandic leaders, who reiterated Greenland’s right to self-determination.
In late 2024, President-elect Trump reignited the discussion about purchasing Greenland. The idea reportedly originated from conversations between Trump and his pick for ambassador to Denmark, Ken Howery. Trump framed the proposal as a strategic investment to bolster U.S. Arctic dominance and access Greenland’s untapped natural resources. The renewed push, however, was met with skepticism from both Danish and Greenlandic leaders, who reiterated Greenland’s right to self-determination.
Links :
- ArticToday : Why does Trump want the US to control Greenland?
Tuesday, December 30, 2025
Tsunami seen from space: NASA’s swot satellite captures 2025 Kamchatka megaquake in unprecedented detail
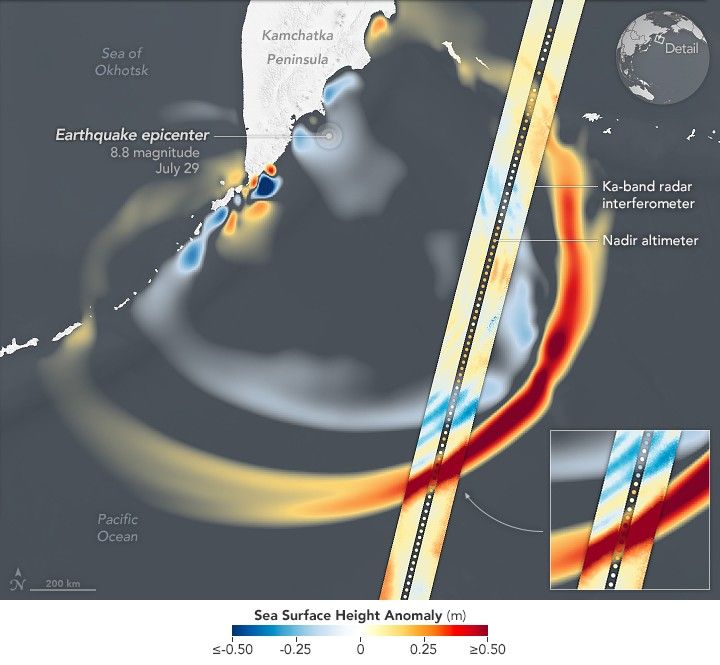

Data provided by the water satellite are helping to improve tsunami forecast models.
NASA Earth Observatory images by Michala Garrison, using SWOT data provided by NASA/JPL-Caltech and a tsunami forecast model provided by the U.S.
National Oceanic and Atmospheric Administration (NOAA) Center for Tsunami Research.
Story by Jane Lee, NASA/JPL-Caltech, adapted for Earth Observatory.
National Oceanic and Atmospheric Administration (NOAA) Center for Tsunami Research.
Story by Jane Lee, NASA/JPL-Caltech, adapted for Earth Observatory.
From TS2 by Marcin Frackiewicz
When a magnitude 8.8 megathrust earthquake struck off Russia’s Kamchatka Peninsula on July 29, 2025, it sent a tsunami racing across almost the entire Pacific.
Now, scientists have revealed something just as extraordinary as the quake itself: for the first time, a satellite has captured a giant Pacific tsunami in high-resolution detail from space, forcing a rethink of how these waves behave and how we forecast them.
[1]
New analyses of data from NASA and CNES’s Surface Water and Ocean Topography (SWOT) satellite – published in The Seismic Record at the end of November – show a surprisingly intricate tsunami wavefield that challenges long‑held assumptions in tsunami science.
[2] On December 3, 2025, that breakthrough is rippling through Google News and Discover, with fresh coverage from ScienceAlert, SURFER/Yahoo News and others helping bring the story to a global audience.
[3]
A megaquake that shook the Pacific – but not the world
The 2025 Kamchatka earthquake struck at 23:24:52 UTC on July 29 (11:24:52 a.m.
local time on July 30), along the Kuril–Kamchatka Trench, a major subduction zone where the Pacific Plate dives beneath the Okhotsk Plate.
The event clocked in at magnitude 8.8 and lasted about four and a half minutes, making it the most powerful earthquake worldwide since Japan’s 2011 Tōhoku disaster and tying for the sixth‑strongest ever instrumentally recorded.
[4]
Despite its size, damage on land was far less catastrophic than many feared.
Shaking caused moderate damage and dozens of injuries in Kamchatka Krai and Sakhalin Oblast, but the Pacific‑wide tsunami it generated was weaker than expected: in most places, wave heights were around 1 meter (3 feet) or less, though a narrow valley near Russia’s Vestnik Bay recorded a local run‑up of about 33 meters (109 feet).
[5]
In other words, this was the sort of “lucky” megaquake that gives scientists an enormous dataset – and humanity a second chance to get ready for the next one.
SWOT’s lucky flyover: a tsunami framed from orbit
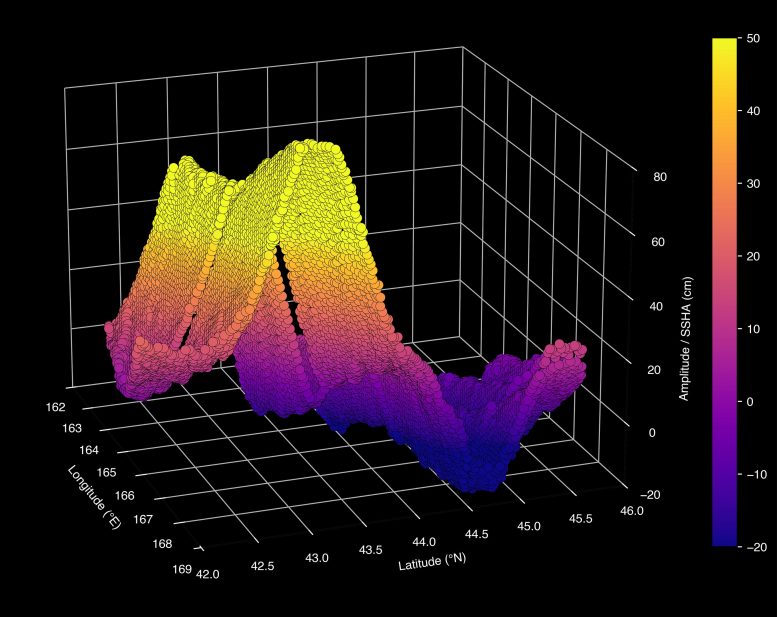
This visualization depicts the leading edge of the tsunami based on sea surface height data from SWOT looking from south to north, when the leading edge was more than 1.5 feet (45 centimeters) high, east of Japan in the Pacific Ocean.
Credit: NASA/JPL-Caltech
Credit: NASA/JPL-Caltech
SWOT is a joint mission between NASA and the French space agency CNES, launched in December 2022 to map Earth’s rivers, lakes and ocean surface in unprecedented detail using wide‑swath radar altimetry.
Instead of measuring sea level along a single narrow track, SWOT paints a ~120‑kilometer‑wide (75‑mile) swath of sea-surface height with each pass.
[6]
On July 30 local time, just about 70 minutes after the earthquake, the satellite happened to cross the Pacific as the tsunami wave train rolled beneath it.
According to NASA, SWOT captured the leading edge of the tsunami spawned by the 8.8 quake off Kamchatka at around 11:25 a.m.
local time.
The data showed a broad crest more than 45 centimeters (about 1.5 feet) high east of Japan – a modest bump in the open ocean that could translate to towering walls of water in shallower coastal waters.
[7]
NASA scientists used SWOT’s measurements to compare the real tsunami with NOAA’s operational forecast model, confirming that the model’s predicted wave heights and arrival times closely matched what the satellite observed.
That kind of “reality check” is exactly what forecasters have wanted from space‑based measurements since the devastating 2004 Sumatra tsunami.
[8]
From snapshot to science: The Seismic Record study
The new paper, titled “SWOT Satellite Altimetry Observations and Source Model for the Tsunami from the 2025 M 8.8 Kamchatka Earthquake,” is led by physical oceanographer Angel Ruiz‑Angulo (University of Iceland) and colleagues.
[9]
The team combined three key ingredients:SWOT’s swath of sea-surface height along the tsunami’s path
Data from three nearby DART (Deep‑ocean Assessment and Reporting of Tsunamis) buoys
Detailed numerical tsunami models
Using an inversion technique with “Gaussian unit sources” – essentially building the tsunami backward from the observations – they reconstructed how the seafloor moved during the quake.
Their results show:The rupture likely extended roughly 400 kilometers along strike, longer than earlier finite‑fault models that put it closer to 300 km.
Peak seafloor uplift reached about 4 meters, with limited slip very near the trench.
[10]
Comparisons with reconstructions of the 1952 magnitude 9.0 Kamchatka earthquake suggest the 2025 rupture re‑activated much of the same megathrust segment, but farther down‑dip (deeper) and with less shallow slip, which helps explain why the 2025 tsunami was far less destructive across the Pacific than the 1952 event.
[11]
The surprise: a “braided” tsunami that breaks the rules
For decades, tsunami scientists have treated large, basin‑spanning tsunamis as “non‑dispersive” shallow‑water waves.
Because their wavelength is much longer than ocean depth, the standard assumption is that they propagate as a relatively simple, coherent wave packet rather than splitting into different components.
[12]
SWOT’s bird’s‑eye view tells a more complicated story.
The satellite track and accompanying models reveal a complex, braided pattern of crests and troughs radiating from the source region, with evidence of dispersion and scattering as the wavefield interacts with seafloor topography and Earth’s curvature.
Instead of a single clean hump, the tsunami appears as a dominant leading wave followed by a train of smaller trailing waves, a structure that doesn’t line up with classic non‑dispersive expectations.
[13]
When the researchers ran their models with dispersive physics switched on, the simulated pattern matched SWOT’s observations far better than traditional non‑dispersive simulations.
That’s a big clue that dispersion matters more for giant tsunamis than textbooks have generally assumed.
Why does this matter? Because dispersion affects how energy is reshuffled within the wave train.
Trailing waves can steal or add energy from the leading crest, potentially altering how high water runs up when it finally hits the shore.
As Ruiz‑Angulo and colleagues point out, that extra “wiggle” in the wavefield is a sign that something important has been missing from standard tsunami models – and may need to be incorporated into future hazard assessments.
[14]
What this means for tsunami forecasting
Modern tsunami-warning systems rely heavily on DART buoys and coastal tide gauges, combined with pre‑computed scenarios and real-time earthquake parameters.
DART sensors are exquisitely sensitive but sparse: each one gives a time series at a single point in the open ocean.
SWOT, by contrast, delivers a two‑dimensional snapshot of sea-surface height over a wide swath, capturing the geometry of the tsunami at once instead of waiting for it to pass over multiple instruments.
[15]
In the near term, SWOT and similar satellites have several key roles:Validating and improving forecast modelsNASA and NOAA scientists have already used the July 2025 event to check NOAA’s tsunami forecast, and SWOT’s observations confirmed the model’s accuracy for this case.
[16]
Refining earthquake source models after the factBy blending SWOT data with DART buoy records, scientists constrained the rupture’s size and slip distribution more tightly than using seismic and geodetic data alone.
[17]
Testing how much dispersion changes hazard estimatesThe new study hints that some long‑term risk maps, which assume non‑dispersive behavior, might underestimate how energy is redistributed in the far field for certain events.
[18]
There are limitations.
SWOT’s orbit doesn’t guarantee it will always be in the right place at the right time, and it provides snapshots rather than continuous coverage, so it’s not a silver-bullet real‑time tool on its own.
But the Kamchatka event is a proof of concept: if future missions or constellations are designed with tsunami monitoring in mind, space‑based altimetry could become a powerful complement to in‑ocean sensors.
A milestone for space‑based disaster monitoring
The Seismological Society of America describes SWOT’s pass over the July 2025 tsunami as the first high‑resolution, spaceborne track of a great subduction‑zone tsunami – exactly the kind of dataset disaster scientists have hoped to capture since satellites first started measuring the oceans.
[19]
Beyond tsunamis, the mission is already transforming:Studies of fine‑scale ocean currents and eddies
Measurements of lake and reservoir levels
Monitoring of river discharge and flooding
The Kamchatka tsunami shows that extreme events – once thought too fast or too rare to catch – can now be sampled in remarkable detail from orbit.
How the story is being covered today (3 December 2025)
As of December 3, 2025, the tsunami‑from‑space breakthrough is surging through science and general‑interest media:ScienceAlertPublishes “First Detailed Look at a Tsunami From Space Reveals Unexpected Feature,” highlighting the unexpected dispersive wave pattern and the potential to improve warning systems using SWOT and DART data.
[20]
SciTechDailyCarries a Seismological Society of America piece titled “NASA Satellite Captures First‑Ever High‑Res View of a Giant Pacific Tsunami,” emphasizing the first‑of‑its‑kind satellite track and the finding that the rupture was longer than earlier models suggested.
[21]
SURFER (syndicated via Yardbarker and Yahoo News)Frames the discovery for a broader lifestyle and sports audience as “Tsunami Wave Seen From Space in First‑Ever Satellite Image (Video),” stressing that the July tsunami caused relatively little damage while giving scientists a “brand‑new view” of these rare, dangerous waves.
[22]
Seismological Society of America & Phys.org / Earth.comProvide more technical and Earth‑science‑focused coverage that explains how the event challenges long‑standing models and underlines the value of satellite altimetry for hazard assessment.
[23]
Taken together, today’s news cycle is doing something unusual: it’s pushing a fairly technical advance – dispersive tsunami dynamics seen from space – into mainstream feeds, from science outlets to surfing magazines.
That visibility may help build public understanding of why “boring” things like DART buoys, altimetry satellites and physics‑heavy models matter when the ocean suddenly rises.
Looking ahead: from rare fluke to routine capability?
The 2025 Kamchatka tsunami was a rare alignment of timing and technology: a great subduction‑zone earthquake, a Pacific‑wide tsunami, and a cutting‑edge altimetry mission flying almost directly overhead at just the right moment.
Researchers now want to turn that lucky moment into systematic capability by:Integrating satellite altimetry into operational tsunami workflows whenever data are available
Designing future missions with rapid data turnaround and coverage tailored to hazard monitoring
Updating hazard models and design standards to incorporate insights about rupture style, dispersion and complex wavefields
As Ruiz‑Angulo put it in comments re‑quoted across several outlets, SWOT is like a “new pair of glasses” for the ocean– and for tsunamis in particular.
[24]
The July 2025 event may ultimately be remembered not for the destruction it caused – mercifully limited – but for the way it reshaped our view of tsunamis, quite literally, from space.
Deadly Tsunami Heads Toward Kamchatka After 8.8 Quake!
Links :
Monday, December 29, 2025
Study: Baltic GPS disruption comes from a tactically-controlled network
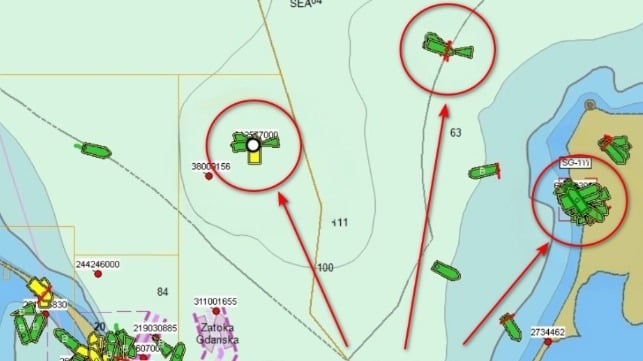
The vessels circled in red were in the port of Gdynia at the time of this image.
Spoofing tricked their GPS receivers into computing false locations, which then appear on AIS in the cluster pattern seen here (GPSPatron / GMU)
Spoofing tricked their GPS receivers into computing false locations, which then appear on AIS in the cluster pattern seen here (GPSPatron / GMU)
From Maritime Executive
Research reveals multiple jamming types, bands, equipment classes, and locations - all turning on and off at once
The Baltic is a notorious hotspot for GPS interference, particularly in the region around the Russian exclave of Kaliningrad.
But pinning down the extent and the nature of the problem requires careful research.
A team from GPSPatron and Gdynia Maritime University have carried out that work - first with shore-based data collection, and now with on-the-water data from a research vessel at sea.
Between June and October, the joint team used a sophisticated interference detector aboard the research vessel Imor on trips near the Polish coastline, including several approaches to the maritime boundary with Kaliningrad.
The sensor suite was built to detect interference with GPS, Galileo and GLONASS - three out of the four GNSS satellite constellations - in order to identify simultaneous attacks on multiple channels.
The intensity of jamming (and the research vessel's itinerary) varied over the course of the study.
Jamming was most intense in late June and July, when GNSS positioning was unavailable off Gdansk about 17 percent of the time.
The power level of the interference became stronger as the vessel went further out into Gdansk Bay, away from the port.
In addition, strong spoofing components targeting the GPS and BeiDou constellation signals were detected when offshore - not in port.
"This spoofing–jamming combination is a widely used technique.
Full multi-constellation spoofing would require generating all GPS, Galileo, GLONASS, and BeiDou signals across multiple frequency bands," the researchers observed.
"In practice, this is complex and costly.
For this reason, real-world interference systems typically spoof only GPS — the primary navigation constellation — and simultaneously jam all other GNSS signals.
This prevents the receiver from performing any constellation cross-checks and forces it to rely solely on the forged GPS solution."
The characteristic sign of this GPS spoofing technique is the "ship-on-land" aberration.
The ship's GPS sensor picks up the spoofed position and feeds it to the AIS transceiver on the bridge, which then retransmits it - broadcasting a message that the ship is wherever the spoofing signal says it is.
On AIS, this displays as a cluster of "ships" that appear to be sharing the same false position, sometimes orbiting in circular tracks, often located on land.
The signal combination is not some form of accidental interference, the researchers suggest.
The data point strongly towards a network of transmitter station sites, which operate on multiple bands and change continuously in strength.
Some of the recorded spectral patterns of the jamming show artifacts consistent with analog radio equipment, while others are more refined, indicating that the operator is using several different generations of transmitter equipment.
In addition, the team found that the GPS spoofing signal is itself partially jammed by other stations in the network.
Most persuasively of all: these interference methods all turn on and off at the same time.
"Taken together, these observations point to a distributed, multi-node interference system, where several independently operating transmitters—likely of different generations and purposes—are synchronized to work as a single electronic warfare network," the researchers concluded.
This poses an ongoing threat to shipping, the team warned.
By tampering with GPS and all three satellite-navigation alternatives, the jamming network can throw off ECDIS systems, confuse watchstanders and VTS operators, disrupt some types of autopilot systems, and generally raise the risk of collision.
"The findings demonstrate that GNSS spoofing in the southern Baltic is not a theoretical threat—it is an operational reality already affecting vessels daily.
The risks to maritime safety, port operations, and environmental security are immediate and significant," the team concluded.
Links :
- Resilient Navigation : Kaliningrad Jamming and Spoofing Up Close – Inside GNSS
Sunday, December 28, 2025
Wait for the wave
Wait for the wave
— Science girl (@sciencegirl) December 18, 2025
pic.twitter.com/XqUvf8N7Nv
Subscribe to:
Posts (Atom)