Saturday, September 1, 2012
Friday, August 31, 2012
Isaac storm as it appears in a visualization of America's wind

From TheAtlantic
Here's a view of Hurricane Isaac unlike any other you've seen so far.
This comes from hint.fm, a collaboration of data-visualization stars Fernanda Viégas and Martin Wattenberg, leading Google's "Big Picture" visualization research group in Cambridge, Massachusetts.
Their wind map provides a nearly real-time glimpse of the wind flow around the United States, based on hourly data drawn from the National Digital Forecast Database.
"So," they write, "what you're seeing is a living portrait."
(It looks even better on their site, so definitely click through to see it in its full glory.)

The beautiful side of storm Isaac (zoom New Orleans)
The map is always beautiful, even without a hurricane's massive force.
Today, though, it can give you a sense of just how far-reaching are Isaac's effects, just how much of the country can feel the winds, literally, of a storm in the gulf.
Hurricane Isaac moved towards New Orleans and the Gulf Coast on August
28, 2012.
This movie shows the movement of the hurricane from dawn to
dusk.
GOES-14—a geostationary weather satellite temporarily taken out of
on-orbit storage—took one image every minute, compared to the standard
of one image every 15 minutes.
The "super rapid scan" images reveal the
movement of clouds at different altitudes, and the rapid development of
thunderstorms near the storms core as evening approached.
Images courtesy NOAA and the University of Wisconsin-Madison Cooperative Institute for Meteorological Satellite Studies.
Images courtesy NOAA and the University of Wisconsin-Madison Cooperative Institute for Meteorological Satellite Studies.
Thursday, August 30, 2012
Fishing in the deep: first observations of a deep-sea anglerfish
This video shows never-before seen footage of a deep-sea angler fish, Chaunacops coloratus.
In it, we summarize recent work by scientists at Monterey Bay Aquarium Research Institute, Moss Landing Marine Laboratories, and Monterey Bay National Marine Sanctuary.
The video seen here was recorded by MBARI's ROV Doc Ricketts at depths of 7,800 - 10,800 feet below the ocean's surface.
From BBC
A rare species of anglerfish has been filmed for the first time by US scientists.
The deep-dwelling fish was first described in 1899 from a dead specimen but has not previously been seen alive.
Using a remote-operated vehicle, biologists observed the fish "walking" with its fins and using its namesake lure.
Scientists suggest the footage also shows that the fish change colour as they age.
The discovery is reported in the journal Deep Sea Research Part I by the team from the Monterey Bay Aquarium Research Institute (MBARI), California, US.
They made their discoveries in underwater mountainous areas, known as seamounts, off the coast of California.
The species Chaunacops coloratus belongs to the family of fish known as anglerfish because of their unique method of predation.
In the same way an angler uses a baited line to catch fish, anglerfish dangle a fleshy lump (the esca) from their head on a long filament (the illicium) which lures prey towards their mouth.
"[Our results] reveal a little more information about an animal that lives 3200 metres below the ocean's surface that no one has ever seen before," said Senior Research Technician at MBARI Lonny Lundsten, "and we've got gorgeous HD video of it!"

The study has extended the fish's known depth by 1500m and distribution by a further 5500km north.
"Nobody knew these existed off California or north of Costa Rica for that matter," said Mr Lundsten.
Images were captured by the team's submersible vehicle equipped with scientific instruments and underwater recording equipment.
The fish, described as "rarely encountered" by experts, was recorded swimming, retreating from a threat, deploying its lure and "walking" on the sea floor.
According to Mr Lundsten, "walking" is common among anglerfish which use their fins to manouevre across solid surfaces.
Scientists were also intrigued by the observation that smaller fish were steely blue in colour compared to the bright-red adults.
That suggests that colour change is part of the developmental process of the fish as they mature.
Wednesday, August 29, 2012
Marie Tharp: the woman who mapped the ocean floor

The 1977 World Ocean Floor Panorama.
It was painted by Berann and based on the previous 25 years of Marie and Bruce's work.
Shortly after receiving printer's proofs of this map in the summer of 1977, Marie and Bruce set off for research expeditions in the North Atlantic, where they'd begun mapping the ocean floor in 1952. Marie set sail on a ship called the Discovery from Wales, Bruce out of Reykjavik on the NR-1, a nuclear research vessel.
Image courtesy of Marie Tharp Maps.
From HuffingtonPost
On February 2, 2009, thanks to Google Ocean, the ocean floor's topography was revealed for millions of people to see.
Before that day, the 70 percent of the Earth's surface covered by water had been filled in by a cold blank blue, essentially ignored by an interface meant to encourage armchair exploration.
One of Google Ocean's features is the Marie Tharp Historical Map, which allows users to see the Earth transformed. Google's satellite pixels replaced the brush strokes of the 1977 World Ocean Floor Panorama Marie produced with her partner Bruce Heezen and the artist Heinrich Berann.
Continents are rich ripe yellows, and the oceans are countless shades of blue; both land and sea darken as if bruised where mountains push through the skins of their plains.
In 1948 Marie moved to Manhattan in search of a more intellectually stimulating job.
She found one at Columbia University, where she met Maurice "Doc" Ewing, the director of a new geophysical program. Doc hired her to draft and do calculations for his male graduate students, including Bruce Heezen.
By 1952, Marie began working exclusively with Bruce to map the ocean floor; that same year, she discovered the Mid-Oceanic Rift Valley.
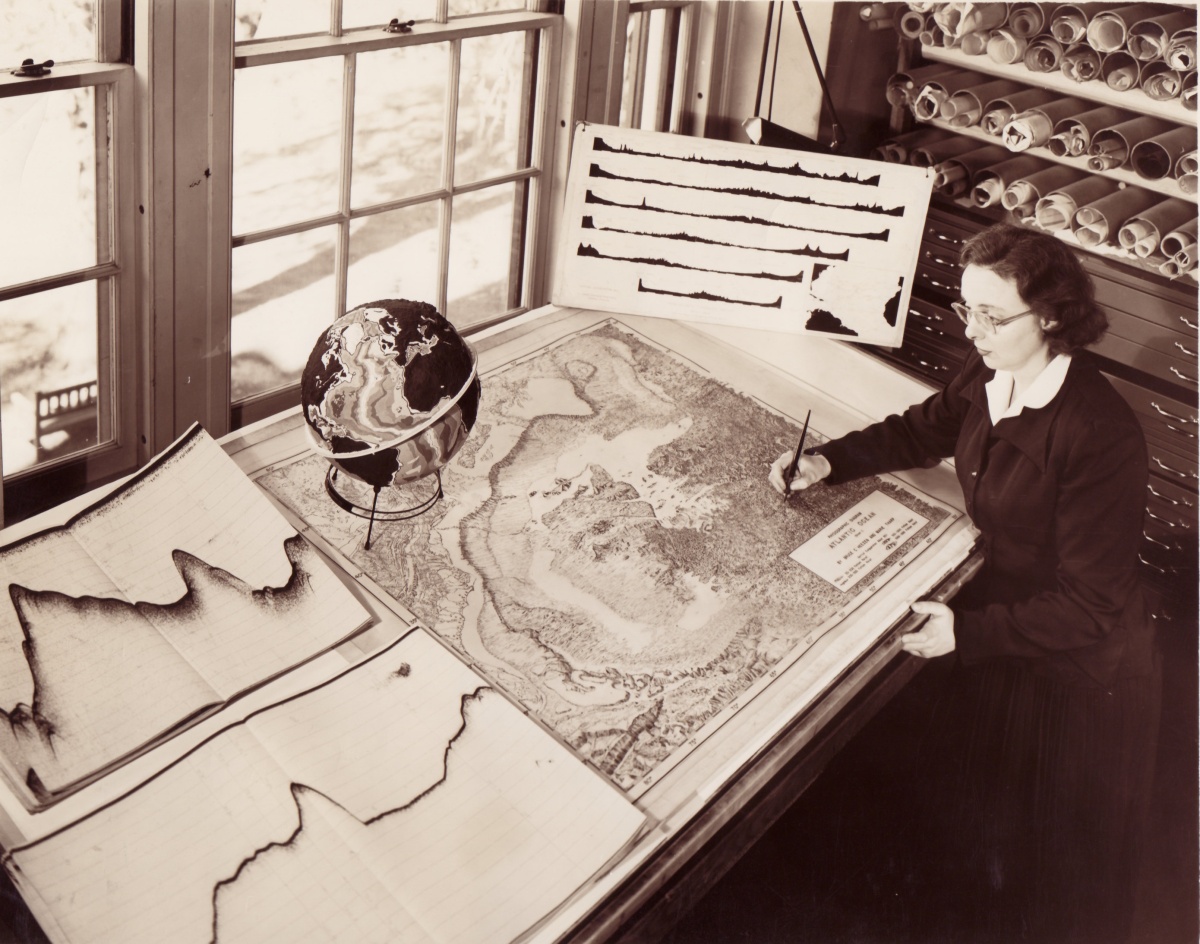
This photo, from the late 1950s, shows a posed Marie pretending to sketch the physiographic diagram of the North Atlantic Ocean.
This photo, from the late 1950s, shows a posed Marie pretending to sketch the physiographic diagram of the North Atlantic Ocean.
Sounding records are visible to the left of the diagram, one of the globe prototypes that she and Bruce constructed sits in the middle, and an enlarged version of her six North Atlantic profiles (two dimensional outlines of the ocean floor's topography) is propped in the corner.
Photo courtesy of the Lamont-Doherty Earth Observatory.
Photo courtesy of the Lamont-Doherty Earth Observatory.
No one had undertaken a close examination of the ocean floor until 1952, when Marie (working at Columbia University's Lamont Geological Observatory) began the arduous task of processing thousands of feet of soundings (sonar pings used to collect depth measurements in bodies of water) from the North Atlantic.
When I first read about Marie in 2007, I was surprised to discover that no one had undertaken a close examination of her life.
That's when I began writing Soundings: The Story of the Remarkable Woman Who Mapped the Ocean Floor (Henry Holt, $30), a biography that brings this amazing woman and her pioneering scientific achievements to life--for the first time.
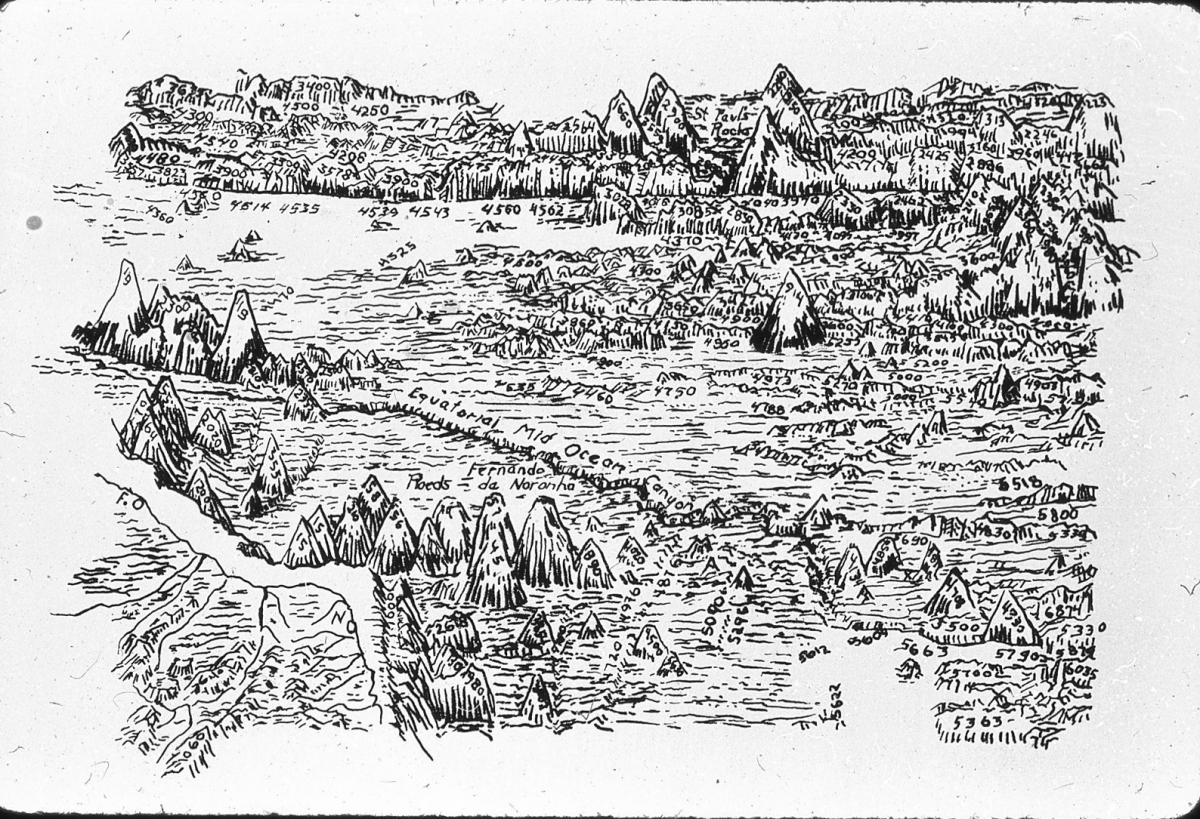
Close-up of Marie's 1961 South Atlantic physiographic diagram, showing the Equatorial Mid-Ocean canyon off the coast of Brazil.
On the full-size map, this portion would be just a few inches wide.
The "Fernando de Norondha Rocks" visible in the foreground are now know as the "Fernando de Norondha Ridge".
Marie's research led to a revolutionary discovery: there was a rift valley running down the center of the Atlantic Ocean.
It began off the coast of Iceland and, she eventually realized, extended for more than 40,000 miles beneath the ocean's surface.
The existence of such a rift was nearly incontrovertible proof of continental drift--a hypothesis that was so unpopular in the United States at the time that belief in it was considered a form of scientific heresy.
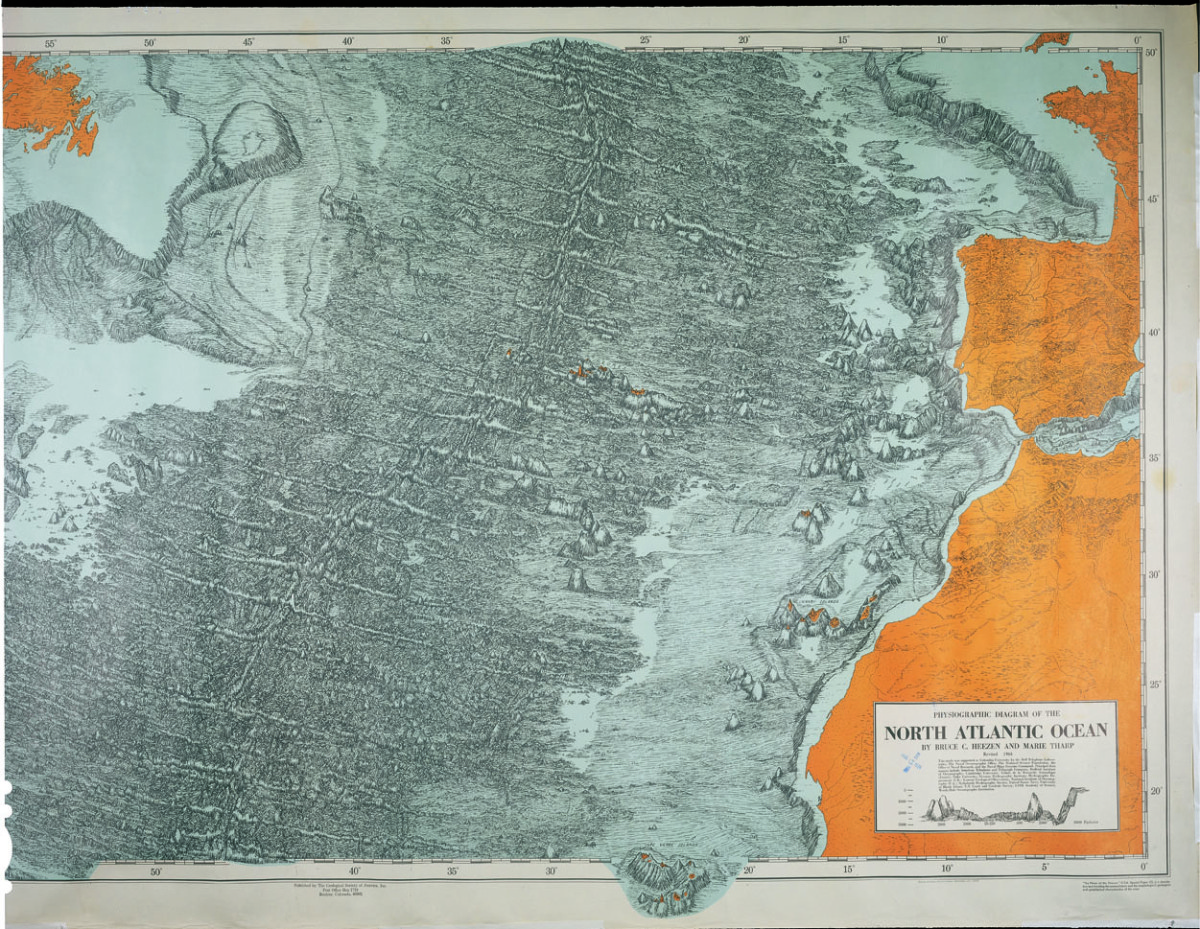
Physiographic diagram of the northern part of the Atlantic Ocean.
This map was published in the September 1957 issue of the Bell System Technical Journal and accompanied the article "Oceanographic information for engineering submarine cable systems," written by Bruce Heezen and C.H. Elmendorf.
With the publication of this map, scientists could, for the first time, look at a wide swath of the ocean floor.
This allowed them to begin to formulate the theories which led to the Earth science revolution of the 1960s.
Note the legend at bottom center. Like sea monsters or mermaids on maps of old, this legend covers up a portion of the ocean floor for which Marie and Bruce had little data.
Note the legend at bottom center. Like sea monsters or mermaids on maps of old, this legend covers up a portion of the ocean floor for which Marie and Bruce had little data.
Many scientists remained unconvinced of the rift's existence until the 1959 International Oceanographic Congress in New York, where Jacques Cousteau screened a film of the rift valley he'd collected while crossing the Atlantic to attend the conference.
After seeing such concrete proof, using Marie's hand-drawn, bird's-eye-view physiographic diagrams as the foundation for their work, scientists began writing the papers that would cause a paradigm shift in Earth science.
These papers from the 1960s, mostly by scientists from the United States, Great Britain, and Canada, are now considered the seminal papers of plate tectonics.
The theories they espoused wouldn't have been possible without Marie's maps, a fact that was quickly forgotten in all of the revolutionary excitement.
The plate tectonics revolution was over by the 1970s, and the public interest that it had sparked fell off as a result.
National Geographic wasn't interested in the map that would bring all of Marie and Bruce's work from the 50s and 60s together on one sheet, so the team turned to the U.S. Office of Naval Research. And in the summer of 1977, just weeks after they received printer's proofs of the World Ocean Floor Panorama, Bruce Heezen died of a heart attack while on a research expedition in a submarine off the coast of Iceland.
Marie never completed another mapping project again, and even today, scientists estimate that only about 10-15 percent of the ocean has been mapped in any detail, making Marie and her maps as relevant today as they've ever been.
Links :
- Earth Institute Colombia Univ : Remembered: Marie Tharp, Pioneering Mapmaker of the Ocean Floor
Tuesday, August 28, 2012
Satellites show sea ice in Arctic is at a record low

Images from NASA show the extent of ice covering the Arctic Ocean in 1979 and this month, representing a decline of over 40 percent, researchers say.
(see slideshow)
From NYT
The amount of sea ice in the Arctic has fallen to the lowest level on record, a confirmation of the drastic warming in the region and a likely harbinger of larger changes to come.
Satellites tracking the extent of the sea ice found over the weekend that it covered about 1.58 million square miles, or less than 30 percent of the Arctic Ocean’s surface, scientists said.
That is only slightly below the previous record low, set in 2007, but with weeks still to go in the summer melting season, it is clear that the record will be beaten by a wide margin.

A ship belonging to Greenpeace in the Arctic Ocean last year.
Measurements show that sea ice now covers less than 30 percent of the ocean’s surface.
The National Snow and Ice Data Center, a government-sponsored research agency in Boulder, Colo., announced the findings on Monday in collaboration with NASA.
The amount of sea ice in the summer has declined more than 40 percent since satellite tracking began in the late 1970s, a trend that most scientists believe is primarily a consequence of the human release of greenhouse gases.
“It’s hard even for people like me to believe, to see that climate change is actually doing what our worst fears dictated,” said Jennifer A. Francis, a Rutgers University scientist who studies the effect of sea ice on weather patterns.
“It’s starting to give me chills, to tell you the truth.”
Scientific forecasts based on computer modeling have long suggested that a time will come when the Arctic will be completely free of ice in the summer, perhaps by the middle of the century.
This year’s prodigious melting is lending credibility to more pessimistic analyses that that moment may come much sooner, perhaps by the end of this decade.
“It’s an example of how uncertainty is not our friend when it comes to climate-change risk,” said Michael E. Mann, a climate scientist at Pennsylvania State University.
“In this case, the models were almost certainly too conservative in the changes they were projecting, probably because of important missing physics.”
Experts say that a powerful storm in the Arctic this month almost certainly contributed to the record by breaking up ice.
But the record low would not have occurred, they say, if the ice had not been steadily contracting for the past several decades.
The pace of that decline seems to be accelerating.
But scientists are somewhat cautious in their predictions, given that sea ice is prone to natural variability.
They have only a 33-year record of careful satellite observations, and before that, only sketchy data from maps and other historical sources.
By itself, the melting of sea ice does not raise global sea levels, because the floating ice is already displacing its weight in seawater.
But the sharp warming that is causing the sea ice to melt also threatens land ice, notably the Greenland ice sheet, which is melting at an increasing rate.
Melting land ice does raise sea levels.
Already, the reduction in sea ice is altering weather patterns in the Arctic region, and perhaps beyond.
It is putting stress on the ecology of the region and causing rapid erosion of shorelines that are now exposed to more vigorous waves.
The melting does, however, offer some potential benefits, including new shipping routes and easier access to oil and other mineral deposits.
A rush is on to stake claims and begin mineral exploration in the Arctic.
The average temperature of the region is rising more than twice as fast as that of the earth as a whole, confirming a prediction first made in 1896: that increasing levels of carbon dioxide from the burning of fossil fuels would have an especially large impact in the Arctic.
One reason is that the white surface of the ice reflects a great deal of sunlight back to space, but the darker water and land exposed when the ice melts absorb more heat from the sun, which in turns leads to additional melting, more sunlight absorption and so on — a feedback loop that scientists call Arctic amplification.
Dr. Francis is one of a small group of climate scientists who argue that the decline of sea ice is already having consequences for weather in the Northern Hemisphere’s middle latitudes, including in the United States.
She has published research suggesting that air circulation patterns are being altered in a way that favors more extremes, like heat waves and droughts.
Such ideas are not considered proven, but they are getting more attention as the weather careers from one extreme to another.
Every year, the surface of the Arctic Ocean freezes during the long, dark winter, with the extent of sea ice usually peaking in March.
Until recent decades, a high proportion of the ice was thick enough to survive the summer.
But scientists say the warming trend has reduced the ice to just a shell in many places.
The means it can melt easily in the round-the-clock sunshine that strikes the highest latitudes in summer.
Said Walt Meier, a top scientist at the snow and ice center, “Parts of the Arctic have become like a giant Slushee this time of year.”
Links :
- NYTimes : Arctic sea ice hits new and early summer low for satellite era
- LATimes : No ice in Barrow, Alaska : Arctic ice shrinks to record low
- WP : Arctic sea ice hits record low, scientists say
- TheGuardian : Along with the Arctic ice, the rich world's smugness will mel
- The Arctic Institute : Where did all the ice go? Arctic ice extent reaches new record low
- Arctic.io Observations : daily NASA Arctic mosaic images
Monday, August 27, 2012
NIWA survey reveals deep water canyons off Otago coast (NZ)
Survey coverage of part of the Otago canyon complex offshore East Coast, South Island extending from Waitaki Canyon in the north to Hoopers Canyon in the south.
Image is a sun-illuminated digital elevation model.
Depth range 100m (red) to 2000m (purple).
>>> geolocalization with the Marine GeoGarage <<<
>>> geolocalization with the Marine GeoGarage <<<
From Stuff.co.nz
The first detailed map of part of the Great South Basin provides clues to the area's seafloor life, along with data that could be useful in any exploration of the area for petroleum.
Niwa research ship Tangaroa mapped a 16,000sq km area off the Otago coast last month.

Detail of the survey coverage of the Otago canyon complex.
Niwa said the Great South Basin had not been mapped in detail before.
The survey provided new information about geological processes in the region, as well as clues about the types of seafloor life that might live there.

Niwa geologist Dr Helen Neil said the intricate map showed the detail of many near-shore canyons along the eastern South Island continental slope.
They formed a set of tributaries sending sediment to the deep sea.
“It gives us a far greater idea of the structure of the Otago canyon complex. This entire system has a really long history," she said.

Hauraki Gulf Bathymetry
>>> geolocalization with the Marine GeoGarage <<<
>>> geolocalization with the Marine GeoGarage <<<
The map can also help with the development of a biodiversity assessment of the area that could be used to establish an environmental baseline, evaluate the potential environmental effects of any oil drilling, and help establish environmental guidelines specific to the area.
“We know something about the animals that live in the shallow areas of the canyons, but we don’t know what is in the really deep parts, particularly in the trough where oil drilling may occur in the future,” Niwa seabed ecologist Dr Ashley Rowden said.
Previous sampling of the shallower areas at the heads of the canyons, down to about 200 metres, had provided information about the make up of the seafloor communities in those areas, which included worms, crabs and fish.
The maps also showed pock marks - about 20 metres deep and 200 metres in diameter - along the margin at depths of between 550 metres and 875 metres.
That was the typical depth for methane seepage.
The marks formed when gas or fluid was released.
If methane was still seeping out of those areas they could support particular types of communities where micro-organisms generated energy from the gas.
Another group of organisms, such as clams and tubeworms, kept those micro-organisms inside them. Dr Neil said canyons in the area mapped reached depths of around 750 metres, around 5km to 15km along their length.
They extended in the North, Central and South channels which ultimately merged to form Bounty Channel, which runs through the Bounty Trough.
The trough formed when the Chatham Rise to the north and the Campbell Plateau to the south pulled apart in a tectonic rift about 55 to 60 million years ago.
Since that time some form of channel in the area had been feeding sediment from the land to the deep sea.
The depression was now more than 1000km long and several hundred kilometres wide, Dr Neil said.
Layers of sediment were laid down when big mixtures of material came down the canyon system and overflowed it.
Such events happened repeatedly, although the amount of time between events varied.
Sediment was not being distributed now in the way it had been in the past as the sea level was higher and New Zealand did not have an aggressive glacial environment.
There was also less erosion from the Southern Alps.
Most of the sediment that did come down was trapped in lakes, Dr Neil said.
Canyon, channel, fan systems were important sources of information about climatic events, oceanographic changes, and events onshore.
The sedimentary record that accumulated in those systems could give important insights into major tectonic, climatic and sea level changes of the past.
In the wider Bounty Trough region some research had been done looking through sediments, either physically by taking sediment cores, or by taking a seismic record penetrating through the seafloor.
In the newly mapped area maybe only four or five sites had been sampled, and that was purely for exploratory geology, not for biodiversity, Dr Neil said.
Using the map the seabed could be divided into different types of area, such as channels, flats and slopes, which provided target areas to sample.
Representative areas could then be sampled to find out what organisms were present.
Niwa said data from the survey could also support petroleum exploration of the area.
Links :
- FIS : NIWA undertakes sea floor mapping survey
Sunday, August 26, 2012
Oceans, into the Blue
From BBC
As an air-breathing animal, the human is not built to survive in water.
But people have found ways to live an almost aquatic life so they can exploit the sea's riches.
From a 'shark-whisperer' in the Pacific to Brazilian fishermen collaborating with dolphins to catch mullet, this journey into the blue reveals astonishing tales of ingenuity and bravery.
Daredevil Galician barnacle-collectors defy death on the rocks for a catch worth £200 per kilo.
Daredevil Galician barnacle-collectors defy death on the rocks for a catch worth £200 per kilo.
In Indonesia an epic whale-hunt, using traditional hand-made boats and harpoons, brings in a sperm whale.
The Bajau 'sea Gypsies' of the Sulu Sea spend so much time on water they get 'land sick' when they set foot on the land!
We dive 40 metres down to the dangerous world of the Pa-aling fishermen, where dozens of young men, breathing air through a tangled web of pipes attached to a diesel engine, capture thousands of fish in a vast net.
We dive 40 metres down to the dangerous world of the Pa-aling fishermen, where dozens of young men, breathing air through a tangled web of pipes attached to a diesel engine, capture thousands of fish in a vast net.
We see how surfing has its origins in the ancient beliefs of the ocean-loving Polynesians, and we join a Borneo free-diving spear-fisherman on a breath-taking journey 20 metres down in search of supper.
Subscribe to:
Posts (Atom)