Friday, February 16, 2024

Scientists say hurricanes are growing so powerful that we need to add a Category 6. Here's what that would look like.


3D rendering of Category 4 hurricane near the US State of Louisiana.

From Business Insider by
  • Scientists argue that we need to add a Category 6 to the Hurricane Wind scale.
  • Category 6 hurricanes would describe storms with wind speeds of at least 192 mph.
  • Such a storm would be a "major disaster" if it made landfall over a populated area.

Climate change is driving up more than just Earth's temperature.
It's making hurricanes more intense, too, which should make us revisit how we categorize these destructive storms to better warn people at risk in the future, researchers reported in a new study.

The researchers recommend adding a Category 6 to the Saffir-Simpson Hurricane Wind Scale, which currently ranks powerful tropical storms based on wind speed starting at Category 1 (74 to 95 mph) up to Category 5 (157 mph or higher).

The "or higher" for Category 5 storms is where scientists take issue.
Samantha Lee/Business Insider

"The open endedness of the 5th category of the Saffir–Simpson hurricane wind scale becomes increasingly problematic for conveying wind risk in a warming world," researchers reported in the study, published Monday in the peer-reviewed journal Proceedings of the National Academy of Sciences.

To remedy this, authors Michael Wehner and James Kossin, propose adding another category. Category 6 would refer to hurricanes with sustained wind speeds of at least 192 mph — about the speed that NASCAR drivers go.

High winds can snap trees in half and turn buildings to rubble.
Jan Pleiter/Getty Images

A strong hurricane with 192 mph winds — which would qualify as a Category 6 — isn't unheard of. In fact, since 2013, five storms have reached or surpassed that, including Hurricane Patricia, Typhoon Haiyan, and Typhoon Meranti, the researchers reported.

And as global temperatures rise, so does the risk of these powerful storms.
What a Category 6 hurricane would look like

Storms tend to weaken as they reach landfall, which makes the risk of a Category 6 striking a major city like New York minuscule, Wehner told Business Insider over email.
"However, the risk of a Cat 6 in the Gulf of Mexico and in the Caribbean is currently not negligible," he said.
"Such a storm would be a major disaster if it were to make landfall in a populated area, even after it weakened somewhat," Wehner added.

Take Typhoon Haiyan.

Typhoon Haiyan intensified as it made landfall over the Philippines.
FrankRamspott/Getty Images

When it first made landfall in 2013 over Samar, an island in the Philippines, the Joint Typhoon Warning Center clocked its windspeed at 196 mph, one of the highest windspeeds ever recordedfor a storm over land.
Winds were so intense they swept away government-designed storm shelters.
Giant waves produced a storm surge 15 feet to 18 feet, which swept ashore killing thousands.
In total, an estimated 6,300 people died and another 4 million were left homeless. Damage costs were an estimated $13 billion.

Typhoon Haiya was so powerful it washed a ship ashore. NOEL CELIS/Getty Images

Typhoon Haiyan is considered an anomaly, but if climate change continues to drive up global temperature, storms like these may become more common across the globe.

In the Atlantic where hurricanes that threaten the US East Coast form, odds of a Category 6 increase once "global warming reaches 3 degrees Celsius above preindustrial levels," Wehner told BI.
"We are currently around 1.2 or 1.3 degrees Celsius," he added.
So there's still time, but if we continue to pollute at the rate we're going, the future looks dark and stormy.

Links :

Thursday, February 15, 2024

This 16th-century map is teeming with sea monsters. Most are based on a real mammal.

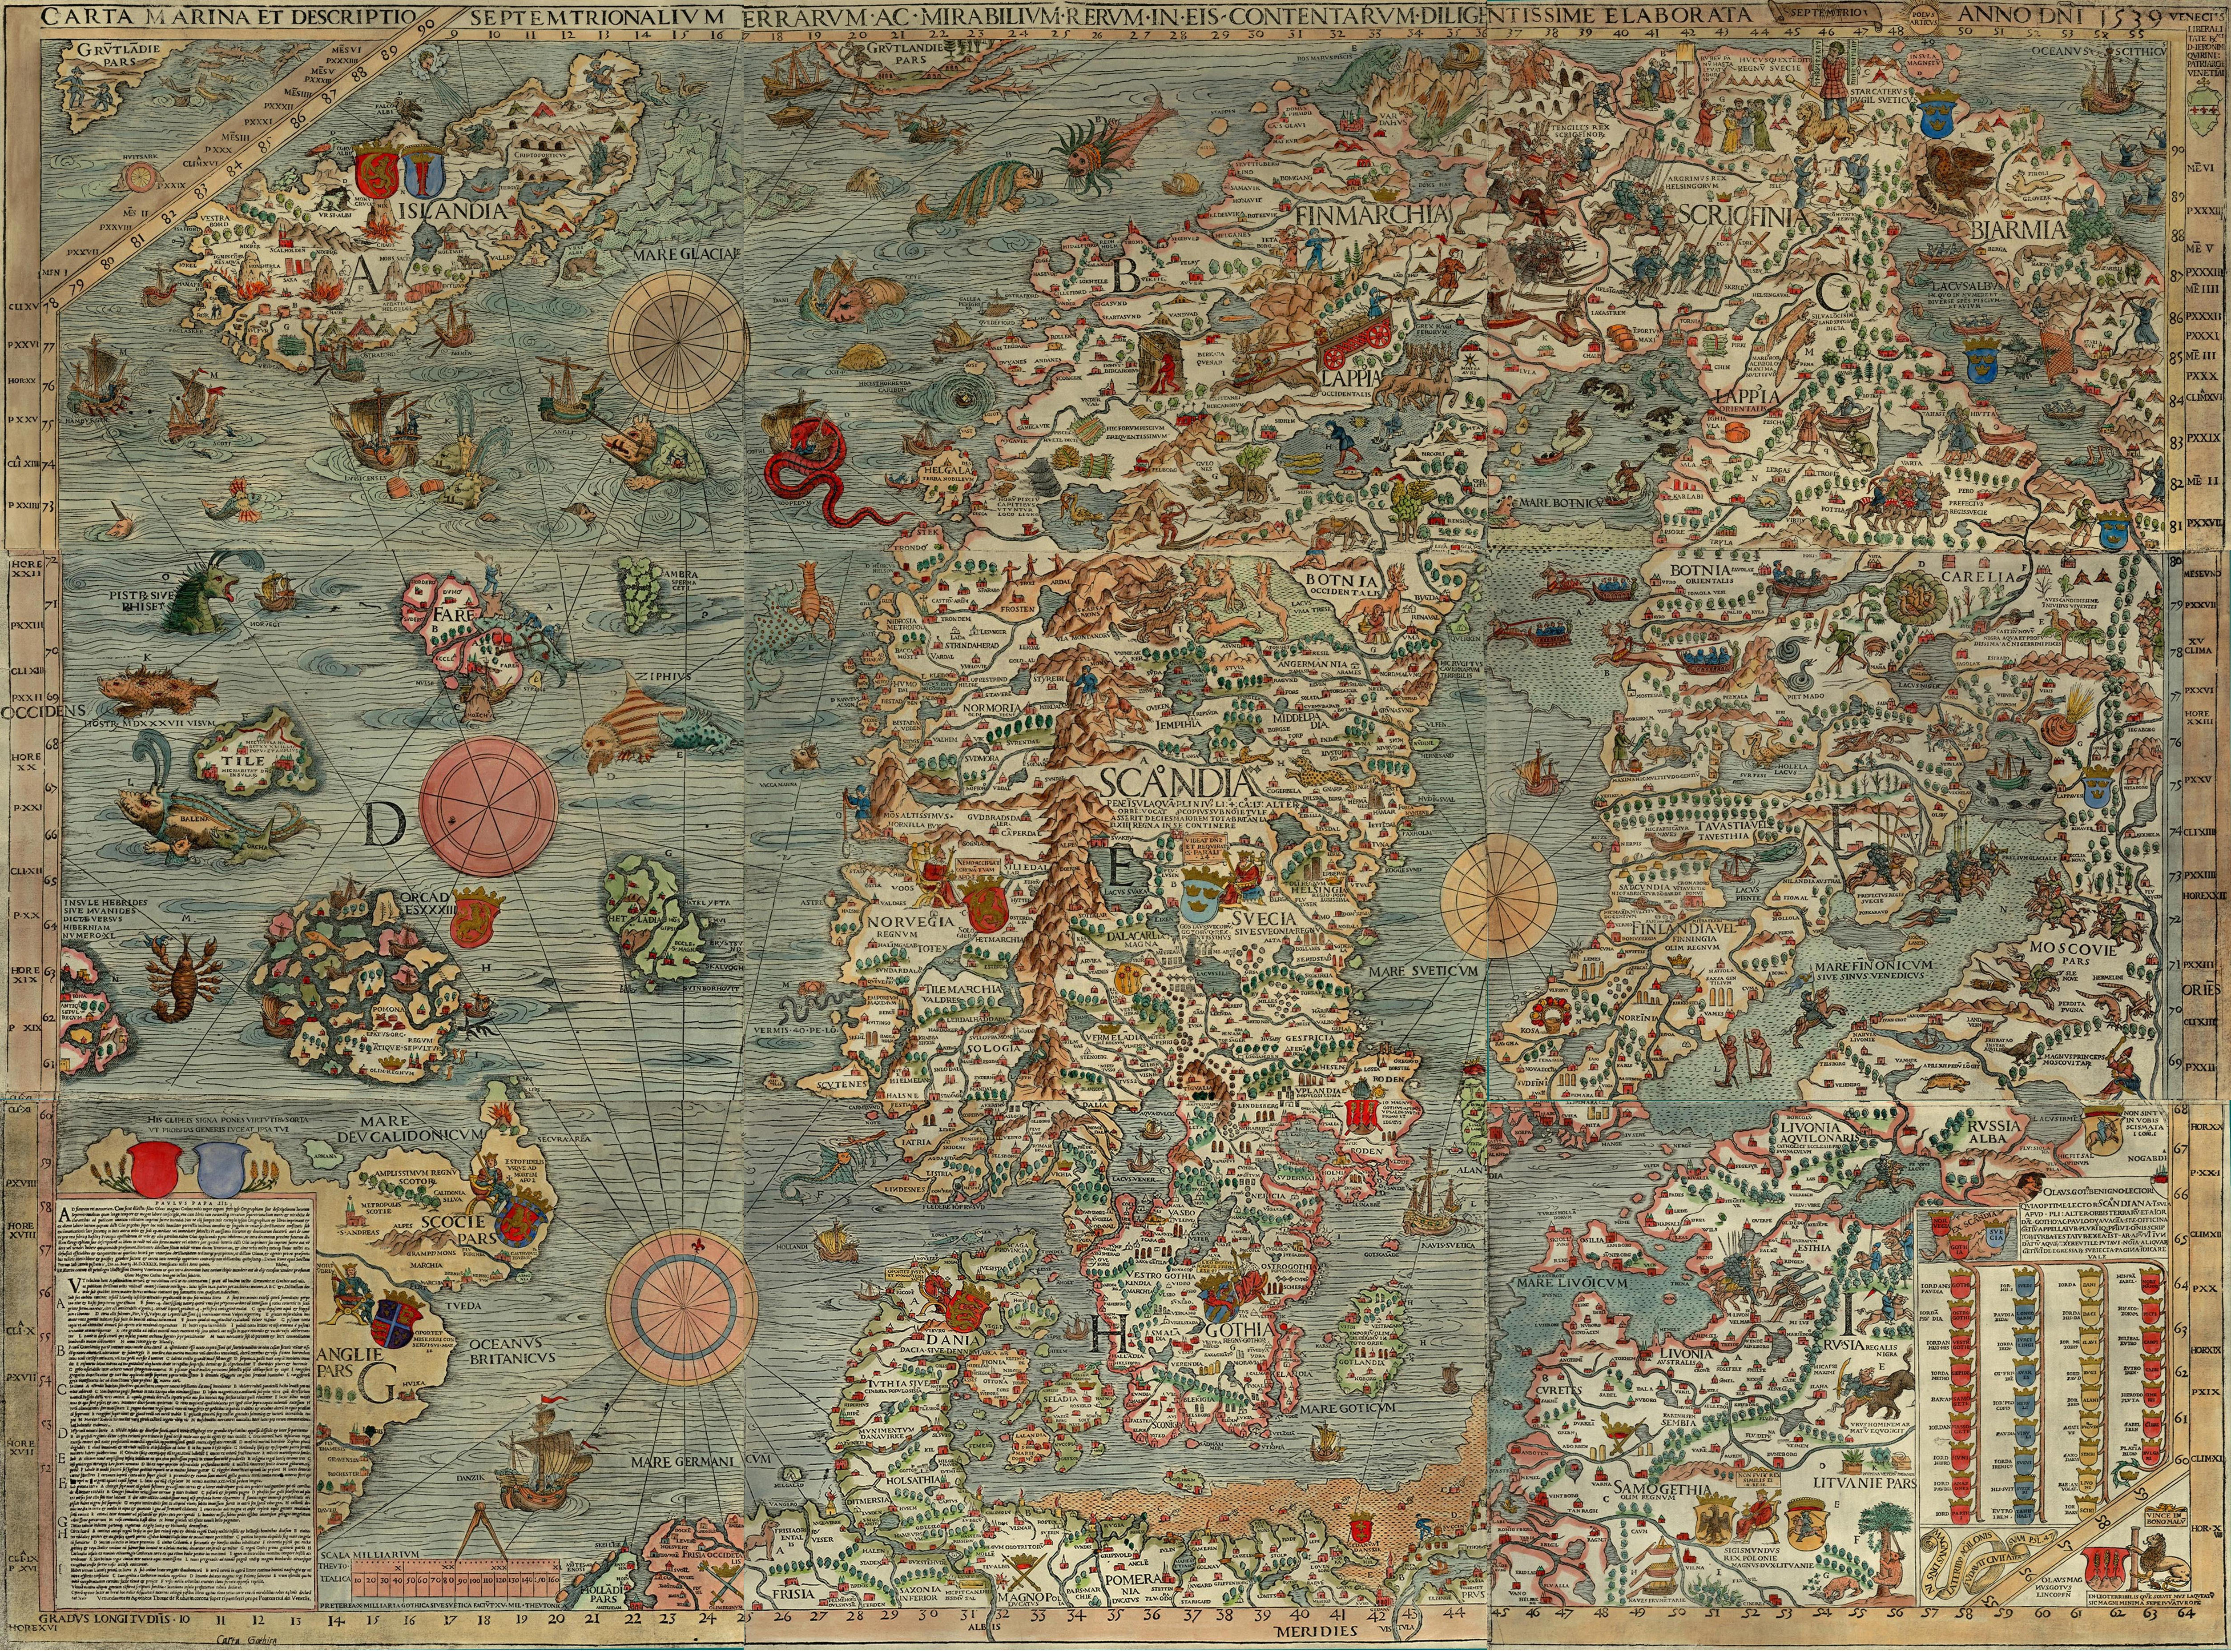
The original "Carta Marina" was 23 square feet.
Unlike other maps at the time, the sea creatures cartographer Olaus Magnus added were not to fill up space—they were warnings.
MAP BY OLAUS MAGNUS

From National Geographic by Emilie Lucchesi

Off the coast of Norway, a giant serpent with a dragon-like head wraps itself around a helpless ship.
Near the Faroe Islands, a mammoth monster clutches a seal in its pointed beak.
And by the coast of Scotland, a gigantic lobster pinches a flailing man in its claw.

These are images detailed on the “Carta Marina”, a map from the late 1530s that served as an authority to cartographers, authors, and scholars studying the European seas.
The map dominated for the next five decades, but it took another century for experts to acknowledge some depictions weren’t realistic—and it took until the early 1700s for new maps to exclude certain monsters.

“A lot of the images seem quite fantastic.
It would be easy to imagine the cartographer invented them on the spot,” says Chet Van Duzer, cartographic historian and author of Sea Monsters on Medieval and Renaissance Maps.

The “Carta Marina” was created by Olaus Magnus, a Swedish archbishop.
He did invent the appearances of some of his sea monsters—most of which are what we’d now recognize as whales.
However, Van Duzer says many of his monsters were copied from illustrated encyclopedias.
Some of these illustrated works were based on descriptions dating back to Pliny the Elder’s Natural History from the first century.

Magnus’s map was one of the first geographic representations of Europe, and it came at a time when people were curious about science and discovery yet still holding onto fantastical beliefs about the natural world.
People believed in beasts they had never seen, like dragons and sea serpents, and Van Duzer says Magnus’s authority, combined with a respect for the printed word, made even the wildest rendering of a whale seem realistic.

The making of a map


Magnus’s map was massive.
The original was 23 square feet, and it depicted a squashed yet detailed portrait of Northern Europe.
This includes what is now Denmark, Estonia, Finland, Iceland, Latvia, Lithuania, Norway, Sweden, and the northernmost parts of the British Isles.

Born in Sweden in 1490, Magnus came from a privileged background and attended university in Germany.
The Reformation forced Magnus to move to Italy, where the Carta Marina was born.
Named archbishop in exile, Magnus toiled over his map for 12 years until it was printed in 1539.

The map was not wholly separate from his career and education.
Some of the monsters Magnus depicted date back to the Old Testament, like the sea orm—then known as the leviathan, which shows up in Psalms, the Book of Job and the Book of Isiah.
In The Underworld: Journeys to the Depths of the Oceans, Susan Casey writes that he filtered the map through the lens of the church’s teachings.

She adds that Magnus’s timing was perfect.
Europe had entered the Age of Discovery and the expansion of printed materials brought fantastical ideas to an audience eager for more.
A century had passed since the printing press was invented, but few Europeans could read—Magnus’s map didn’t require reading skills and it gave images to monsters that people would’ve known about from the Bible or oral legend.

 Magnus wrote in his 1555 book that pristers were 200-feet long with broad, forked tails and finned feet, with faces resembling warthogs and dual blow-holes on the top of their heads.
MAP BY OLAUS MAGNUS
 

It’s possible sea orms were really giant squids, or pinnipeds, like seals or sea lions.
Others argue orms were sharks, whales, or oarfish.
MAP BY OLAUS MAGNUS

In the Carta Marina, sea monsters weren’t just decorative adornments, as they were in other maps throughout the Renaissance.
In some instances, Van Duzer says they warned of dreaded monsters in dangerous waters.
All together, they reflected a larger anxiety at the time about the dangers of maritime travel.

Their worries weren’t without justification.
In Scurvy: How a Surgeon, a Mariner, and a Gentleman Solved the Greatest Medical Mystery of the Age of Sail, Stephen R.
Brown writes the mortality rate on long-distance voyages in the 1500s was 50 percent—from scurvy alone.
Accidents, drowning, and infectious disease meant that many people who went to sea were buried at sea.
The ocean was a dangerous place, and Magnus’s map reflected both a fear of the unknown and a desire to tame it.

Sea orms


Near the coast of Norway, Magnus depicts a bright-red sea serpent attacking a ship that tilts as though it’s being taken under.

The sea orm was partly based on lore, including Biblical references to a serpent-like sea creature.
It was also based on descriptions that Magnus collected from sailors who described a massive monster near the Norwegian coast.
They claimed the orm was a 200-foot snake (about the size of five city buses) that was 20 feet thick (about the height of a subway tunnel).

Nineteenth century scientists tried to identify what the sea orm might have been in real life, says Joseph Nigg, author of Sea Monsters: The Lore and Legacy of Olaus Magnus’s Marine Map.
It’s possible the creatures were giant squids, or pinnipeds, like seals or sea lions.
Others argue orms were sharks, whales, or oarfish.

In his 1555 book History of the Northern Peoples, Magnus wrote the sea orm could raise its head next to a ship and pluck an unwitting sailor off the deck.
He also wrote the orm could slither on land to devour livestock or slip into the water to prey on marine life.

Other historians and cartographers replicated the sea orm in their work well into the 1700s, Nigg says.

Pristers

The sea monsters on the “Carta Marina” were universally mean spirited and seemingly determined to hurt any human they encountered.
Pristers, in particular, were dangerously aggressive.
Magnus wrote in his 1555 book they were 200-feet long with broad, forked tails and finned feet, with faces resembling warthogs and dual blow-holes on the top of their heads.

Van Duzer says this and most other sea creatures on the “Carta Marina” are based on descriptions of whales.
Whales were well-known to people, but they would have seen them only at the surface of the ocean, he says.
The map also depicts a beached whale being processed by people for its meat and bones.

Magnus wrote that pristers could smack down a ship with their tails, or they could sink a ship simply by heaving themselves onto the deck.

Magnus included information on how to protect against the beasts on the Carta Marina, Van Duzer says.
Near the coast of Iceland, two pristers charge toward a ship.
“On the very back of the ship, you see a guy standing.
You might imagine he’s holding a gun, but it’s actually a trumpet,” he says.
“Magnus wrote that one of the few ways to scare away a sea monster was blowing a trumpet.”

Other cartographers agreed, and Nigg says they copied Magnus’s prister onto their own maps for decades.

Island whales

According to the “Carta Marina”, the waters between Norway and Iceland were profoundly dangerous.
Off the coast of Norway, Magnus depicts the treacherous Moskstraumen, which is a real and still exists today.
Between the sea orm and the pristers, Magnus placed the island whale, a ruthlessly deceiving beast.

The island whale came from millennia-old lore that dates to Alexander the Great’s Letter to Aristotle around A.D. 300.
The ancient story told of two sailors who rested at what they thought was an island.
They came ashore, made a camp and then lit a fire.
That’s when their troubles began.

“It turns out it wasn’t an island, but a whale.
The whale felt the fire, plunged into the ocean deep and took the men with it,” Van Duzer says.

On the “Carta Marina,” the island whale resembles a cross between a stegosaurus and a rhinoceros, but was likely just a whale we’d be familiar with today.
Van Duzer says people at the time were more apt to believe in what they read, if they could read.
“There was a lot of respect for the printed word and the images that accompanied them,” he says.

Certain monsters, like the sea orm, took more than a century to debunk as myth.
Many other monsters faded from maps in the next century as cartographers were able to incorporate more realistic images of marine life onto their maps.
 
Links :

Wednesday, February 14, 2024

How NASA, NOAA and AI might save the internet from devastating solar storms


A June 2013 solar flare on the left side of the sun, which later sent a coronal mass ejection out into space.
NASA/GODDARD/SDO


From NextGov by John Breeden II


Coronal mass ejections that can occur during the solar maximum are electrically charged, meaning they can easily destroy electrical and computer equipment.

If you are reading this article on the Nextgov/FCW website, then the good news is that the internet has not been destroyed by a powerful solar storm.
But the bad news is that devastating space weather is still in the forecast for us and could be arriving any time over the next couple of years.

On the one hand, the scientific community is excited about the approaching solar maximum — the point when the sun’s solar activity is greatest — during which time certain solar activities, as well as events like auroras, will be more easily observable.
NASA, for example, has declared a Heliophysics Big Year starting in October and running until December 2024.
Over the course of the big year, the agency will sponsor a variety of activities, from sun watching parties to citizen science events, designed to take advantage of the increased sun activity in order to learn more about our home star.

 NASA’s Solar Dynamics Observatory captured this image of a solar flare – as seen in the bright flash on the lower right – on Feb. 9, 2024.
The image shows a subset of extreme ultraviolet light that highlights the extremely hot material in flares, and which is colorized in teal.
Credit: NASA/SDO
 
 
But there is a big potential downside to solar maximums too.
During solar maximums, the possibility of large geomagnetic storms increases.
During those storms, plumes of superheated plasma gas can be ejected from the sun with such force that they can soar across 93 million miles of space and strike Earth.
And because coronal mass ejections are electrically charged, they can easily destroy electrical and computer equipment, even on a large scale.
Thankfully, they are rare occurrences, but they do happen.

One of the most well-known solar storm events happened during a solar maximum back in 1859.
Known as the Carrigan Event, the coronal mass ejection struck Earth at a time when electrical and communications equipment were still in their infancy.
And even so, it caused a lot of damage.
Almost the entire telegraph network in the United States and Europe experienced blackouts.
Meanwhile, telegraph operators reported getting shocked by their equipment, or that the paper used by their machines would sometimes burst into flames.
Some clever telegraph operators removed the batteries from their devices, which were being destroyed by the electrically charged plasma, and were able to send and receive messages using only the power generated by the event itself.

Needless to say, the effects of such an event today, now that the world is fully wired and powered, would be much more devastating.
Imagine if an entire section of the world experienced a months-long blackout, or if our computer networks and the internet suddenly stopped working.
It’s kind of a nightmare scenario that few people or countries are prepared to deal with.

There is no guarantee that the upcoming solar maximum will produce a violent solar storm or a coronal mass ejection event.
Even the normal 11-year cycle of sun intensity is not always predicted accurately.
Sometimes it happens after nine years, and sometimes there are up to 14 years between cycles.
Scientists are also not always right when predicting the intensity of the events and the resulting storms.
Back in 2010, the government was warning that the next solar maximum, expected in 2013, could be devastating.
That event did not happen until the following year, in 2014, and turned out to be one of the weakest on record.
Realistically, nobody really knows if the pending solar maximum will be a big one, but the possibility that it could be huge is certainly looming.

NASA 
 
Earth’s defenses against solar storms

There is not much of anything that we humans can do to prevent solar storms or even shield our planet from their effects.
However, with enough warning, power grids and computer equipment could be shut down and protected from the worst effects of an event, only powered back up once the storm has passed.
But for that, we need a good early warning system.

NASA and the National Oceanic and Atmospheric Administration's Space Weather Prediction Center used to rely mostly on a single satellite for solar storm warnings: the Advanced Composition Explorer, or ACE.
However, following the thankfully mild solar maximum of 2014, the age of the ACE satellite started to become a concern, since it was over 10-years past its operational lifespan at that point.
It was given backup in the form of the new DSCOVR Deep Space Climate Observatory satellite in 2015 which now handles the bulk of those prediction duties, although ACE is still used for support activities.

ACE and DSCOVER together watch for corona injections and can provide warnings of approaching solar storms up to an hour before they strike Earth.
That is not a lot of time, but if critical infrastructure providers are ready for the warnings — which they might be as the new solar maximum ramps up — it could be enough time to at least power down some of the grids.
Even so, a little more time between the warnings and a solar storm’s impact would be helpful.

For that, artificial intelligence might be able to offer a helping hand.
A group called the Frontier Development Lab, which is a public-private partnership that includes NASA, the U.S. Geological Survey and the Department of Energy, have been tasking AI with trying to predict pending solar storms before they happen.

According to the team working on the project, the AI was fed data from four previous solar exploration missions — ACE, Wind, IMP-8 and Geotail — as well as information from ground stations around the world that recorded solar storms and events.
The AI was tasked with analyzing the conditions on the sun leading up to a solar storm in order to predict future ones.

And by all accounts, the AI was extremely successful at that task.
It is now able to accurately predict solar storms up to 30 minutes before they even happen, with forecasts updated every minute until the expected storm occurs.

“With this AI, it is now possible to make rapid and accurate global predictions and informed decisions in the event of a solar storm, thereby minimizing — or even preventing — devastation to modern society,” said Vishal Upendran of the Inter-University Center for Astronomy and Astrophysics in India.
Upendran is the lead author of a paper detailing the AI-based project which was recently published in the Space Weather journal.

The code used for the space weather prediction project was made using all open source assets, which Upendran says will allow critical infrastructure providers to modify and integrate it into their individual operations.

While there is not yet any actual defense against solar storms and coronal mass ejections like the one that plagued the telegraph network back in 1859, the new network of satellites backed up by the AI space weather prediction system should at least give us a bit of a warning before a new storm strikes.
With that, even if the pending 2024 or 2025 solar maximum produces a devastating solar storm, the event will at least be survivable and somewhat mitigatable, as opposed to a global catastrophe that strikes, quite literally, out of the clear blue sky.

Links :

Tuesday, February 13, 2024

The Houthis’ next target may be underwater

 
An aerial view shows the Bab el-Mandeb Strait, a sea route connecting the Indian Ocean and the Mediterranean Sea via the Suez Canal.
An aerial view shows the Bab el-Mandeb Strait, a sea route connecting the Indian Ocean and Mediterranean Sea via the Suez Canal, on Oct. 22, 2022.
GALLO IMAGES/ORBITAL HORIZON/COPERNICUS SENTINEL DATA 2021

From Foreign Policy by Keith Johnson

Cutting or damaging subsea cables could disrupt data and financial communications between Europe and Asia.

In the midst of the 12-week campaign by Iran-backed Houthi militants in Yemen to disrupt the critical shipping corridor of the Red Sea, a new worry is creeping in: that the Houthis may target the bevy of subsea cables that carry nearly all the data and financial communications between Europe and Asia.

So far, most of the concern about the Houthi campaign has understandably focused on its disruptive impact on commercial shipping and energy flows through the key chokepoint between the Suez Canal and the Indian Ocean.
But this new concern underscores the way in which subsea infrastructure—and its potential vulnerability—is becoming a critical feature in the global security seascape.

In late December, an account linked to Houthi militants posted on Telegram what appeared to be threats against the dozen-odd fiber-optic cables that squeeze through the Bab el-Mandeb Strait west of Yemen.
The nebulous threats were echoed and amplified by accounts linked to other Iran-backed militants, including Hezbollah, according to the Middle East Media Research Institute.

In recent years, key infrastructure on the seafloor has become part of the gray-zone battleground, with Russian “ghost ships” spooking neighbors in the Baltic and North seas.
More than a year ago, the Nord Stream 1 gas pipeline between Russia and Germany was mysteriously blown up (while Nord Stream 2 was damaged), and last fall, energy and data links in the eastern Baltic were also mysteriously damaged.
Similar episodes have plagued data connections in the Mediterranean.

On December 24, 2023, a Telegram channel affiliated with Yemen's Iran-backed Ansar Allah Movement (the Houthis) shared a map of networks of submarine communications cables in the Mediterranean Sea, the Red Sea, the Arabian Sea, and the Persian Gulf.
The map was accompanied by an implied threat: "There are maps of international cables connecting all regions of the world through the sea. It seems that Yemen is in a strategic location, as internet lines that connect entire continents – not only countries – pass near it."
courtesy of MEMRI 
 
Subsea cables are packed densely together at Bab al-Mandeb (the Gate of Tears) off the Yemeni coastline.
 
While the vague threats to submarine cables in the Red Sea have not so far led to any incidents, the centrality of their target is clear—there are few other ways to move the massive amounts of data and money between Europe and Asia than by relying on a bundle of fiber-optic cables that snake through the very area where the Houthis are most active.

“Well over 99 percent of intercontinental communications go over subsea cables—that’s not just internet, that’s financial transactions, interbank transfers.
A lot of defense departments rely on cables as well,” said Timothy Stronge, vice president of research at TeleGeography, a telecoms market research company. 
“Pretty much anything you can imagine for international communications touches undersea cables. In terms of the Red Sea, it’s pretty critical for connecting Europe to Asia.”

Threats aside, the first big question is whether the Houthis actually have the capability to damage the submarine cables, which are usually well embedded in the seafloor; most of the Houthi attacks so far have come from firing missiles and launching drones at commercial vessels (and U.S. and U.K. naval ships) in the area.

“I can’t see any part of the Houthi arsenal actually being dangerous for the subsea cables,” said Bruce Jones of the Brookings Institution, who has written extensively about the importance of submarine cables. 
“If you actually want to damage these things, you’re going to have to get subsea.”

The Houthis, though, are backed and armed by Iran and used by Tehran as one of its regional proxies to attack Western and Gulf interests.
Even if the Houthis themselves may lack the capability, Jones said, Iran might be a different story, especially as tensions between the United States and Iran escalate.

“The question becomes, do the Iranians have the capability, and would the Iranians take that step? I think that is the thing to watch for—if this escalates farther and we really get into a U.S.-Iran slogging match … then you could question whether the Iranians have that capability,” he said.

That said, there are potentially low-tech ways to damage some undersea cables, especially in locations where they are laid in shallower waters.
About two-thirds of all incidents involving maritime cables involve human accident, Stronge said, usually from fishing trawlers or commercial vessels dragging their anchors on the seafloor.
Experts said such an approach could conceivably give the Houthis the ability to partially damage at least some of the submarine cables.

Normally, that wouldn’t be a huge problem: The United States and most other nations keep cable-repair ships on retainer to patch any disruptions to the vital undersea data links.
But due to the Houthis’ ongoing harassment campaign in the Red Sea itself, it simply wouldn’t be possible for repair ships to spend several days stationary trying to repair a damaged cable.
In that sense, the submarine threat could dovetail with the surface disruption they are already causing.

Still, though, the big difference between undersea energy infrastructure, like the Nord Stream pipelines or the Baltic connectors, and the data links is that there are a lot more alternatives for moving virtual traffic than oil or gas.

Key Shipping Chokepoints in the Red Sea Region


A map shows major chokepoints in trade routes in the Red Sea area.
The Suez Canal, Bab el-Mandeb Strait, and the Strait of Hormuz are labeled.
Yemen is shaded in darker color.

“Individually, a cable is extremely vulnerable, but collectively there’s a lot of resiliency built into the system,” Stronge said. 
“It would be extremely difficult to completely disconnect a well-connected country. It would require a very sophisticated and coordinated attack to take them out all at the same time.”

The bigger issue is the growing realization among defense planners and security analysts of the importance and vulnerability of the huge subsea infrastructure system around the world.
Oil and gas pipelines have proliferated, and subsea data links have grown by leaps and bounds in recent years and are poised for even more spectacular growth this year and next to keep up with the exponential demand for digital transmission.

Weaponizing the seafloor is not entirely novel: The British cut German submarine telegraph cables at the very start of World War I to isolate Berlin from the world, and seabed sonar in the Greenland-Iceland-U.K. gap became a fixture in the Cold War.
But the growing importance of subsea infrastructure to the global economy is forcing a rethink of the traditional naval mission of protecting sea lines of communication.
 
Links :

Monday, February 12, 2024

Atlantic Ocean is headed for a tipping point − once melting glaciers shut down the Gulf Stream, we would see extreme climate change within decades, study shows


Too much fresh water from Greenland’s ice sheet can slow the Atlantic Ocean’s circulation.
Paul Souders/Stone via Getty Images


From The Conversation by René van Westen / Henk A. Dijkstra / Michael Kliphuis


Superstorms, abrupt climate shifts and New York City frozen in ice.
That’s how the blockbuster Hollywood movie “The Day After Tomorrow” depicted an abrupt shutdown of the Atlantic Ocean’s circulation and the catastrophic consequences.

While Hollywood’s vision was over the top, the 2004 movie raised a serious question: If global warming shuts down the Atlantic Meridional Overturning Circulation, which is crucial for carrying heat from the tropics to the northern latitudes, how abrupt and severe would the climate changes be?

Twenty years after the movie’s release, we know a lot more about the Atlantic Ocean’s circulation.
Instruments deployed in the ocean starting in 2004 show that the Atlantic Ocean circulation has observably slowed over the past two decades, possibly to its weakest state in almost a millennium.
Studies also suggest that the circulation has reached a dangerous tipping point in the past that sent it into a precipitous, unstoppable decline, and that it could hit that tipping point again as the planet warms and glaciers and ice sheets melt.

In a new study using the latest generation of Earth’s climate models, we simulated the flow of fresh water until the ocean circulation reached that tipping point.

The results showed that the circulation could fully shut down within a century of hitting the tipping point, and that it’s headed in that direction.
If that happened, average temperatures would drop by several degrees in North America, parts of Asia and Europe, and people would see severe and cascading consequences around the world.

We also discovered a physics-based early warning signal that can alert the world when the Atlantic Ocean circulation is nearing its tipping point.

The ocean’s conveyor belt

Ocean currents are driven by winds, tides and water density differences.

In the Atlantic Ocean circulation, the relatively warm and salty surface water near the equator flows toward Greenland.
During its journey it crosses the Caribbean Sea, loops up into the Gulf of Mexico, and then flows along the U.S.
East Coast before crossing the Atlantic.


How the Atlantic Ocean circulation changes as it slows.
IPCC 6th Assessment Report


This current, also known as the Gulf Stream, brings heat to Europe.
As it flows northward and cools, the water mass becomes heavier.
By the time it reaches Greenland, it starts to sink and flow southward.
The sinking of water near Greenland pulls water from elsewhere in the Atlantic Ocean and the cycle repeats, like a conveyor belt.

Too much fresh water from melting glaciers and the Greenland ice sheet can dilute the saltiness of the water, preventing it from sinking, and weaken this ocean conveyor belt.
A weaker conveyor belt transports less heat northward and also enables less heavy water to reach Greenland, which further weakens the conveyor belt’s strength.
Once it reaches the tipping point, it shuts down quickly.

What happens to the climate at the tipping point?

The existence of a tipping point was first noticed in an overly simplified model of the Atlantic Ocean circulation in the early 1960s.
Today’s more detailed climate models indicate a continued slowing of the conveyor belt’s strength under climate change.
However, an abrupt shutdown of the Atlantic Ocean circulation appeared to be absent in these climate models.
How the ocean conveyor belt works.

This is where our study comes in.
We performed an experiment with a detailed climate model to find the tipping point for an abrupt shutdown by slowly increasing the input of fresh water.

We found that once it reaches the tipping point, the conveyor belt shuts down within 100 years.
The heat transport toward the north is strongly reduced, leading to abrupt climate shifts.
 
The result: Dangerous cold in the North

Regions that are influenced by the Gulf Stream receive substantially less heatwhen the circulation stops.
This cools the North American and European continents by a few degrees.

The European climate is much more influenced by the Gulf Stream than other regions.
In our experiment, that meant parts of the continent warmed at more than 5 degrees Fahrenheit (3 degrees Celsius) per decade – far faster than today’s global warming of about 0.36 F (0.2 C) per decade.
We found that parts of Norway would experience temperature drops of more than 36 F (20 C).
On the other hand, regions in the Southern Hemisphere would warm by a few degrees.

 
The annual mean temperature changes after the conveyor belt stops reflect an extreme temperature drop in northern Europe in particular.

These temperature changes develop over about 100 years.
That might seem like a long time, but on typical climate time scales, it is abrupt.

The conveyor belt shutting down would also affect sea level and precipitation patterns, which can push other ecosystems closer to their tipping points.
For example, the Amazon rainforest is vulnerable to declining precipitation.
If its forest ecosystem turned to grassland, the transition would release carbon to the atmosphere and result in the loss of a valuable carbon sink, further accelerating climate change.

The Atlantic circulation has slowed significantly in the distant past.
During glacial periods when ice sheets that covered large parts of the planet were melting, the influx of fresh water slowed the Atlantic circulation, triggering huge climate fluctuations.
 
So, when will we see this tipping point?

The big question – when will the Atlantic circulation reach a tipping point – remains unanswered.
Observations don’t go back far enough to provide a clear result.
While a recent study suggested that the conveyor belt is rapidly approaching its tipping point, possibly within a few years, these statistical analyses made several assumptions that give rise to uncertainty.

Instead, we were able to develop a physics-based and observable early warning signal involving the salinity transport at the southern boundary of the Atlantic Ocean.
Once a threshold is reached, the tipping point is likely to follow in one to four decades.

 
A climate model experiment shows how quickly the AMOC slows once it reaches a tipping point with a threshold of fresh water entering the ocean.
How soon that will happen remains an open question.
René M. van Westen


The climate impacts from our study underline the severity of such an abrupt conveyor belt collapse.
The temperature, sea level and precipitation changes will severely affect society, and the climate shifts are unstoppable on human time scales.

It might seem counterintuitive to worry about extreme cold as the planet warms, but if the main Atlantic Ocean circulation shuts down from too much meltwater pouring in, that’s the risk ahead.

Links :

Sunday, February 11, 2024

The ocean is deeper than you think. We need better maps.


Our maps of the ocean are surprisingly bad!
On Google Maps it looks like we know so much… but we know less about the ocean floor than we do the surface of Mars.

And that’s a big problem, because we are using the ocean all the time: We’re laying internet cables across it, we fight wars in it, we search it during a crisis - like the imploded OceanGate Titan submersible or the missing Malaysia Airlines Flight 370.
 
 
71% of the surface of the Earth is water! And yet we have a surprisingly limited view of what’s below it.
But that’s also understandable.
Because cartographically speaking, water sucks.
For Mars or Earth’s surface, we can take pictures.
But light doesn’t get to the ocean floor, so we need other ways to see it.

The good news is, we’re developing that tech right now, and an international group called Seabed 2030 is working to piece together a better map.
There is a terrifying, incredible, alien world on our own planet, and we’re FINALLY using technology to see it more clearly.
 
In this episode of Huge If True, I dive deep - with help from my friend and fellow video journalist @johnnyharris - to show you how we’re mapping the ocean, the surprising things we’ve discovered in the depths, and why this new technology could be… huge if true :) 
 
Chapters:  
00:00 How bad are our ocean maps?  
01:40 How deep is the ocean?  
03:05 What is the deepest part of the ocean? 
04:04 The craziest method to map the ocean  
06:20 How does sonar work?  
07:31 What did the first ocean maps look like?  
09:30 How do we map the ocean now?  
10:30 What is Seabed 2030?  
11:40 How do we use underwater robots?  
12:27 Concerns with mapping the deep ocean  
13:11 Why deep ocean mapping is huge if true
 
Links :