Originally built for the Cold War, this 108-metre engineering oddity is being refitted for the 21st Century.
Daniel Pembrey explores the strangely significant world of Flip.
From BoatInternational What a ride that was,” says Ed Childers on a bright, breezy San Diego day.
The sunglasses and intervening half-century can’t conceal his recalled amazement.
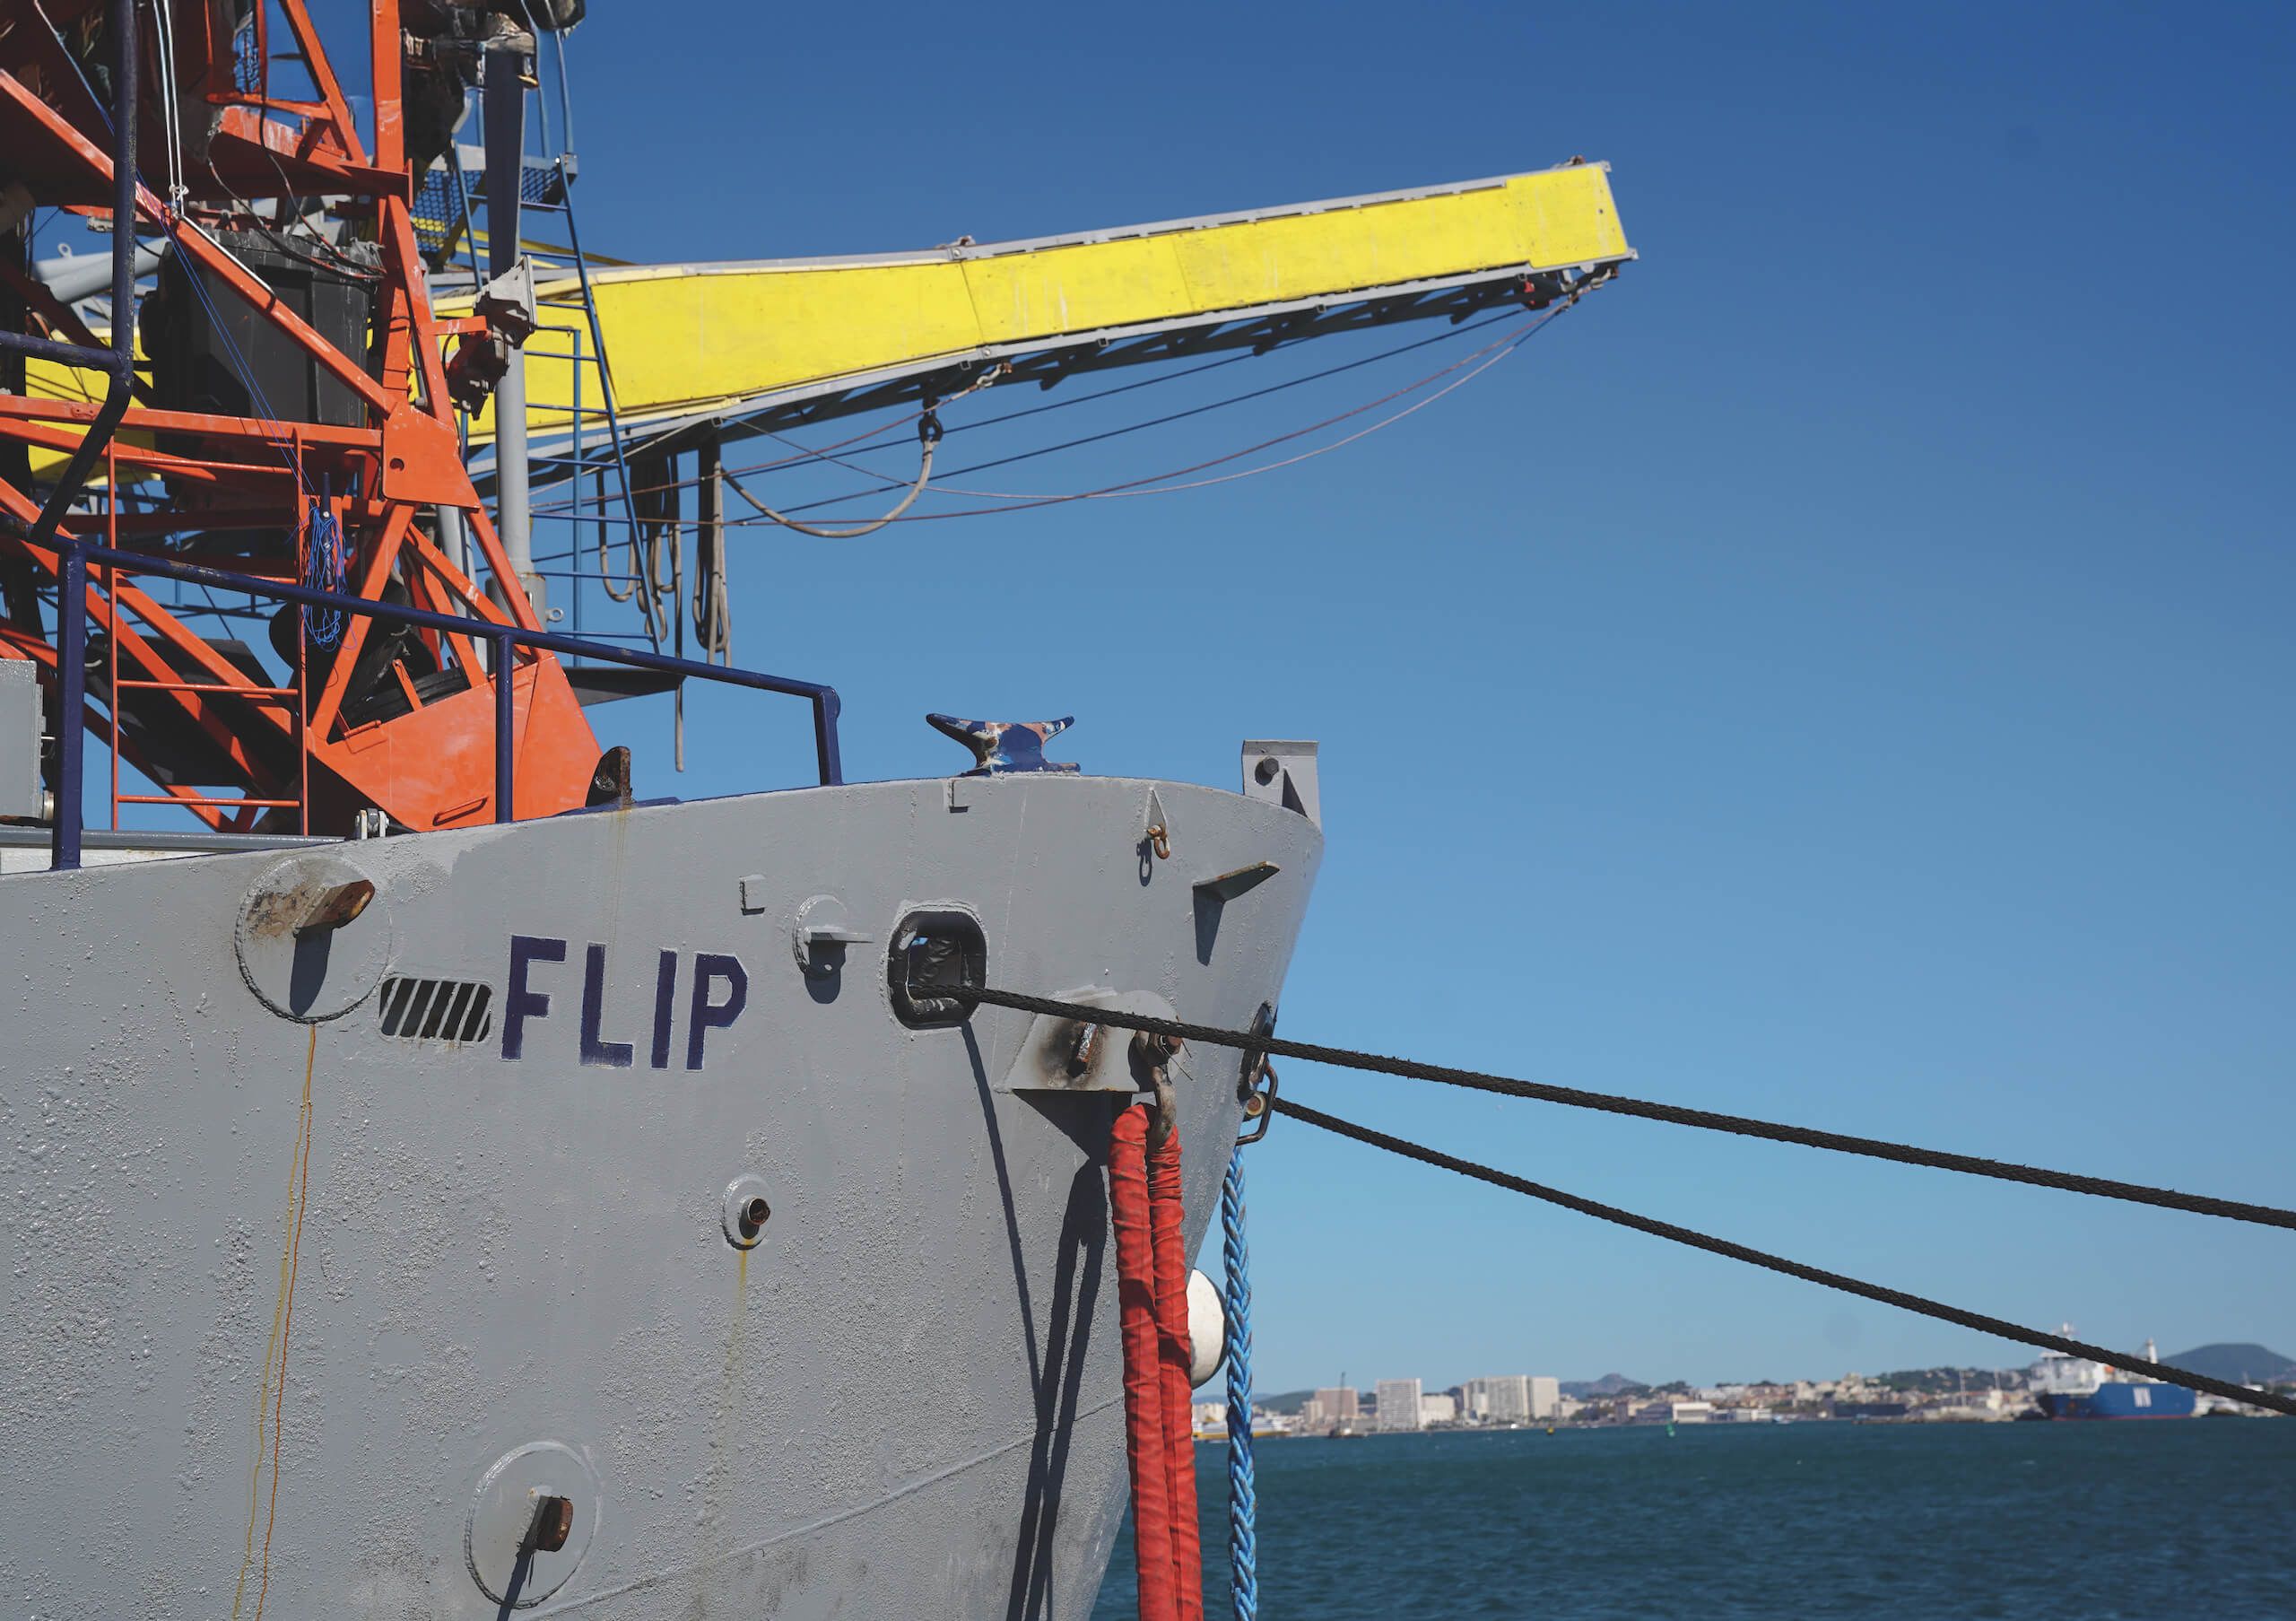
Childers was the original engineer and shipmate aboard 108-metre R/P FLIP (floating instrument platform), which would sink its stern, pointing its bow skyward.
It launched off the US West Coast in June 1962 and the name said it all: “Once you hit that ‘point of no return’, as it leaned over, it whipped around,” Childers says, rotating his hand.
“I made 57 revolutions, but I’ve never seen one FLIP the same.”
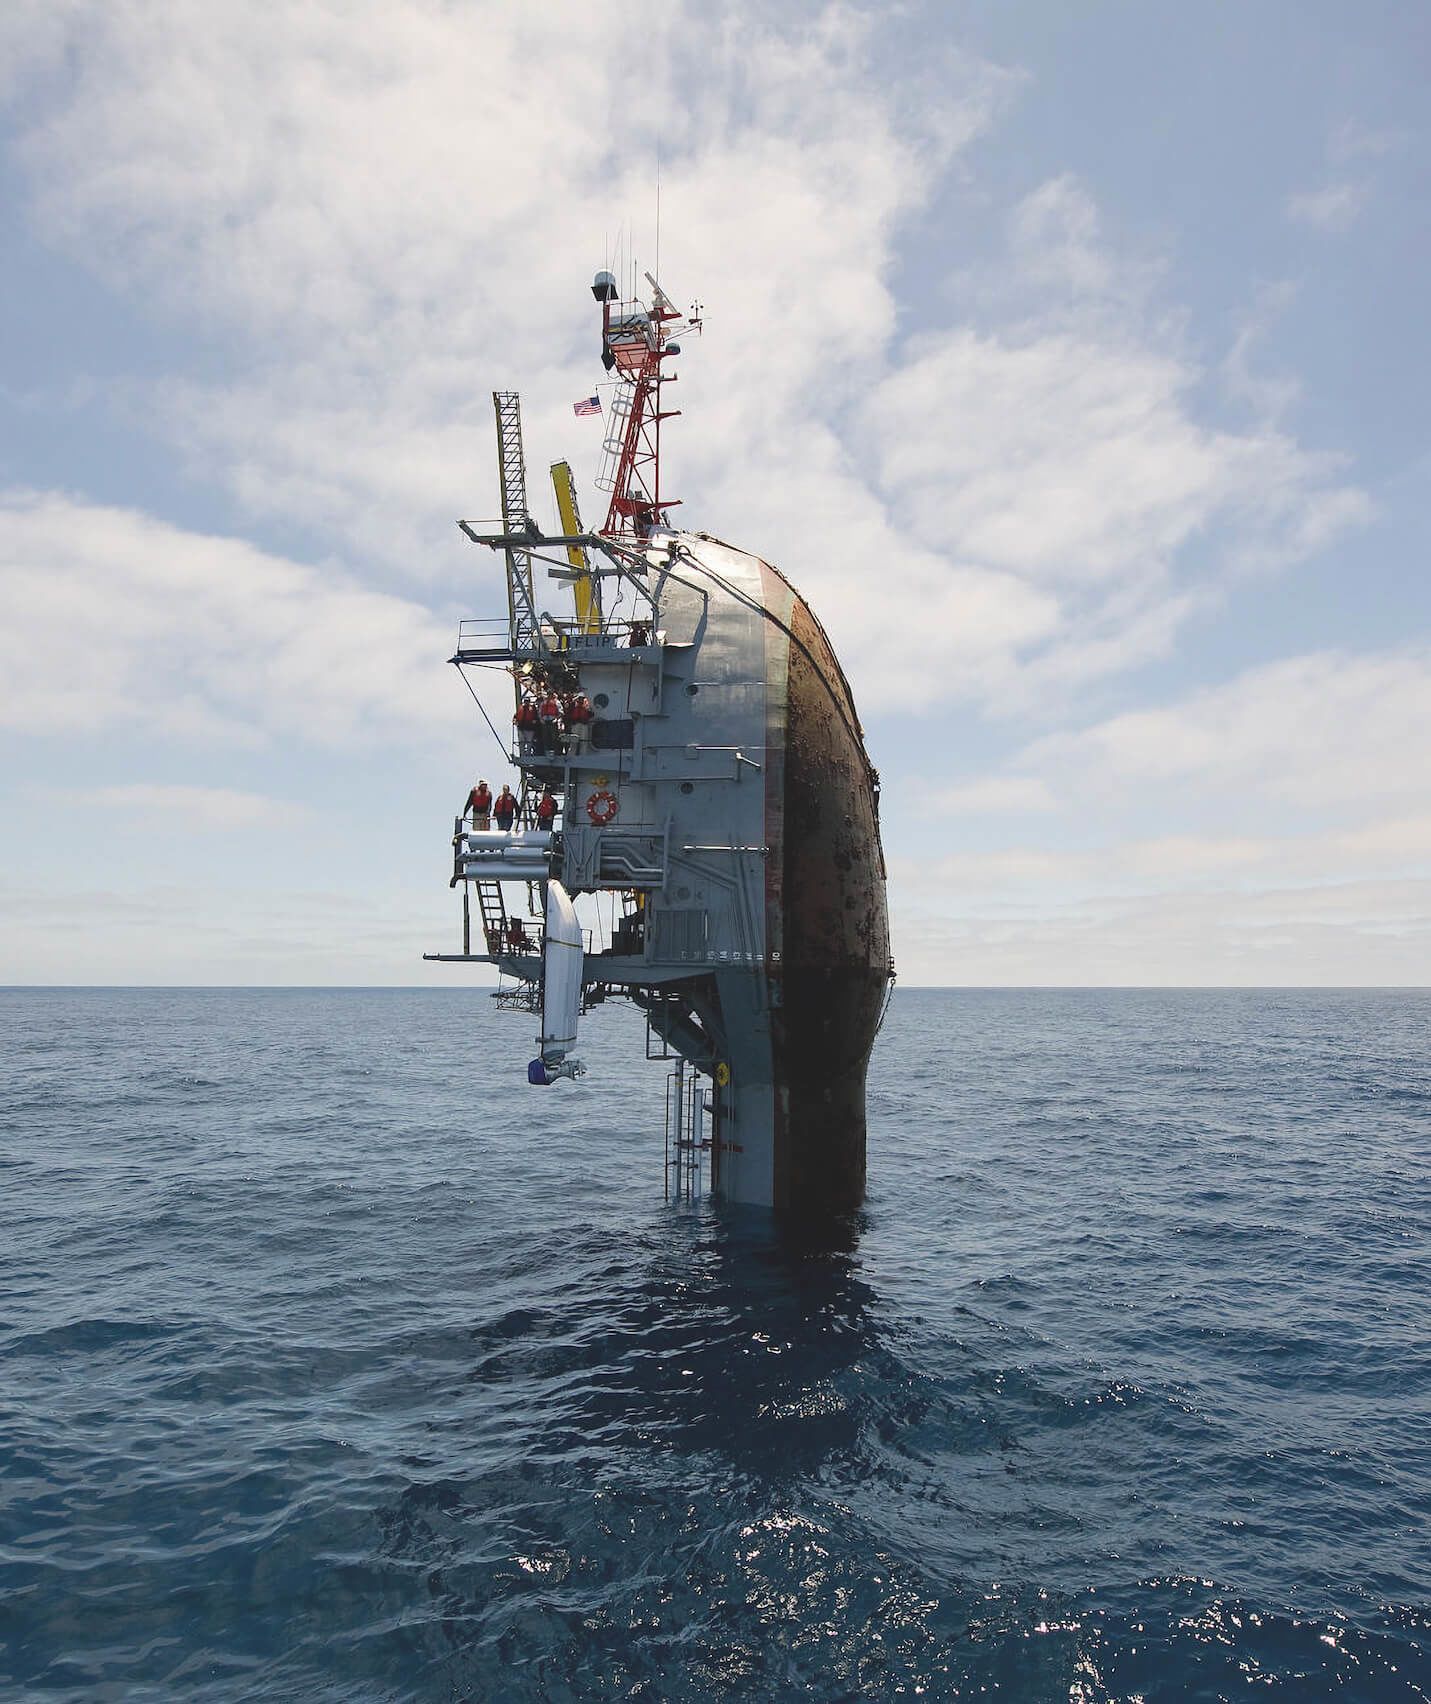
In its vertical position, FLIP was an unusually stable open-water research laboratory.
It was not a ship as it had no propulsion system of its own (it had to be towed into position), yet film footage of its signature manoeuvre evokes the memorable scene on Titanic where passengers clung to the stern railing, high in the air.
The twist was that FLIP’s bow remained in this position, its topmost part coming to rest 17 metres above sea level (in calm conditions).
Pjf Military Collection Alamy Stock Photo
What in the world brought this behemoth into being?
The answer, in the Cold War, was sound.
In human history, few extinction dangers have been more clear or present than the Cuban Missile Crisis of 1962, where Russia and the US came within minutes of launching nuclear warheads at each another.
Russia put nuclear missiles on Cuba, 145 kilometres from Florida, which the US Navy then blockaded, opening up a narrow de-escalation path.
Key was an ability to identify and neutralise enemy submarines (force them to surface, that time), and central to this was accuracy of the sonar bearing.
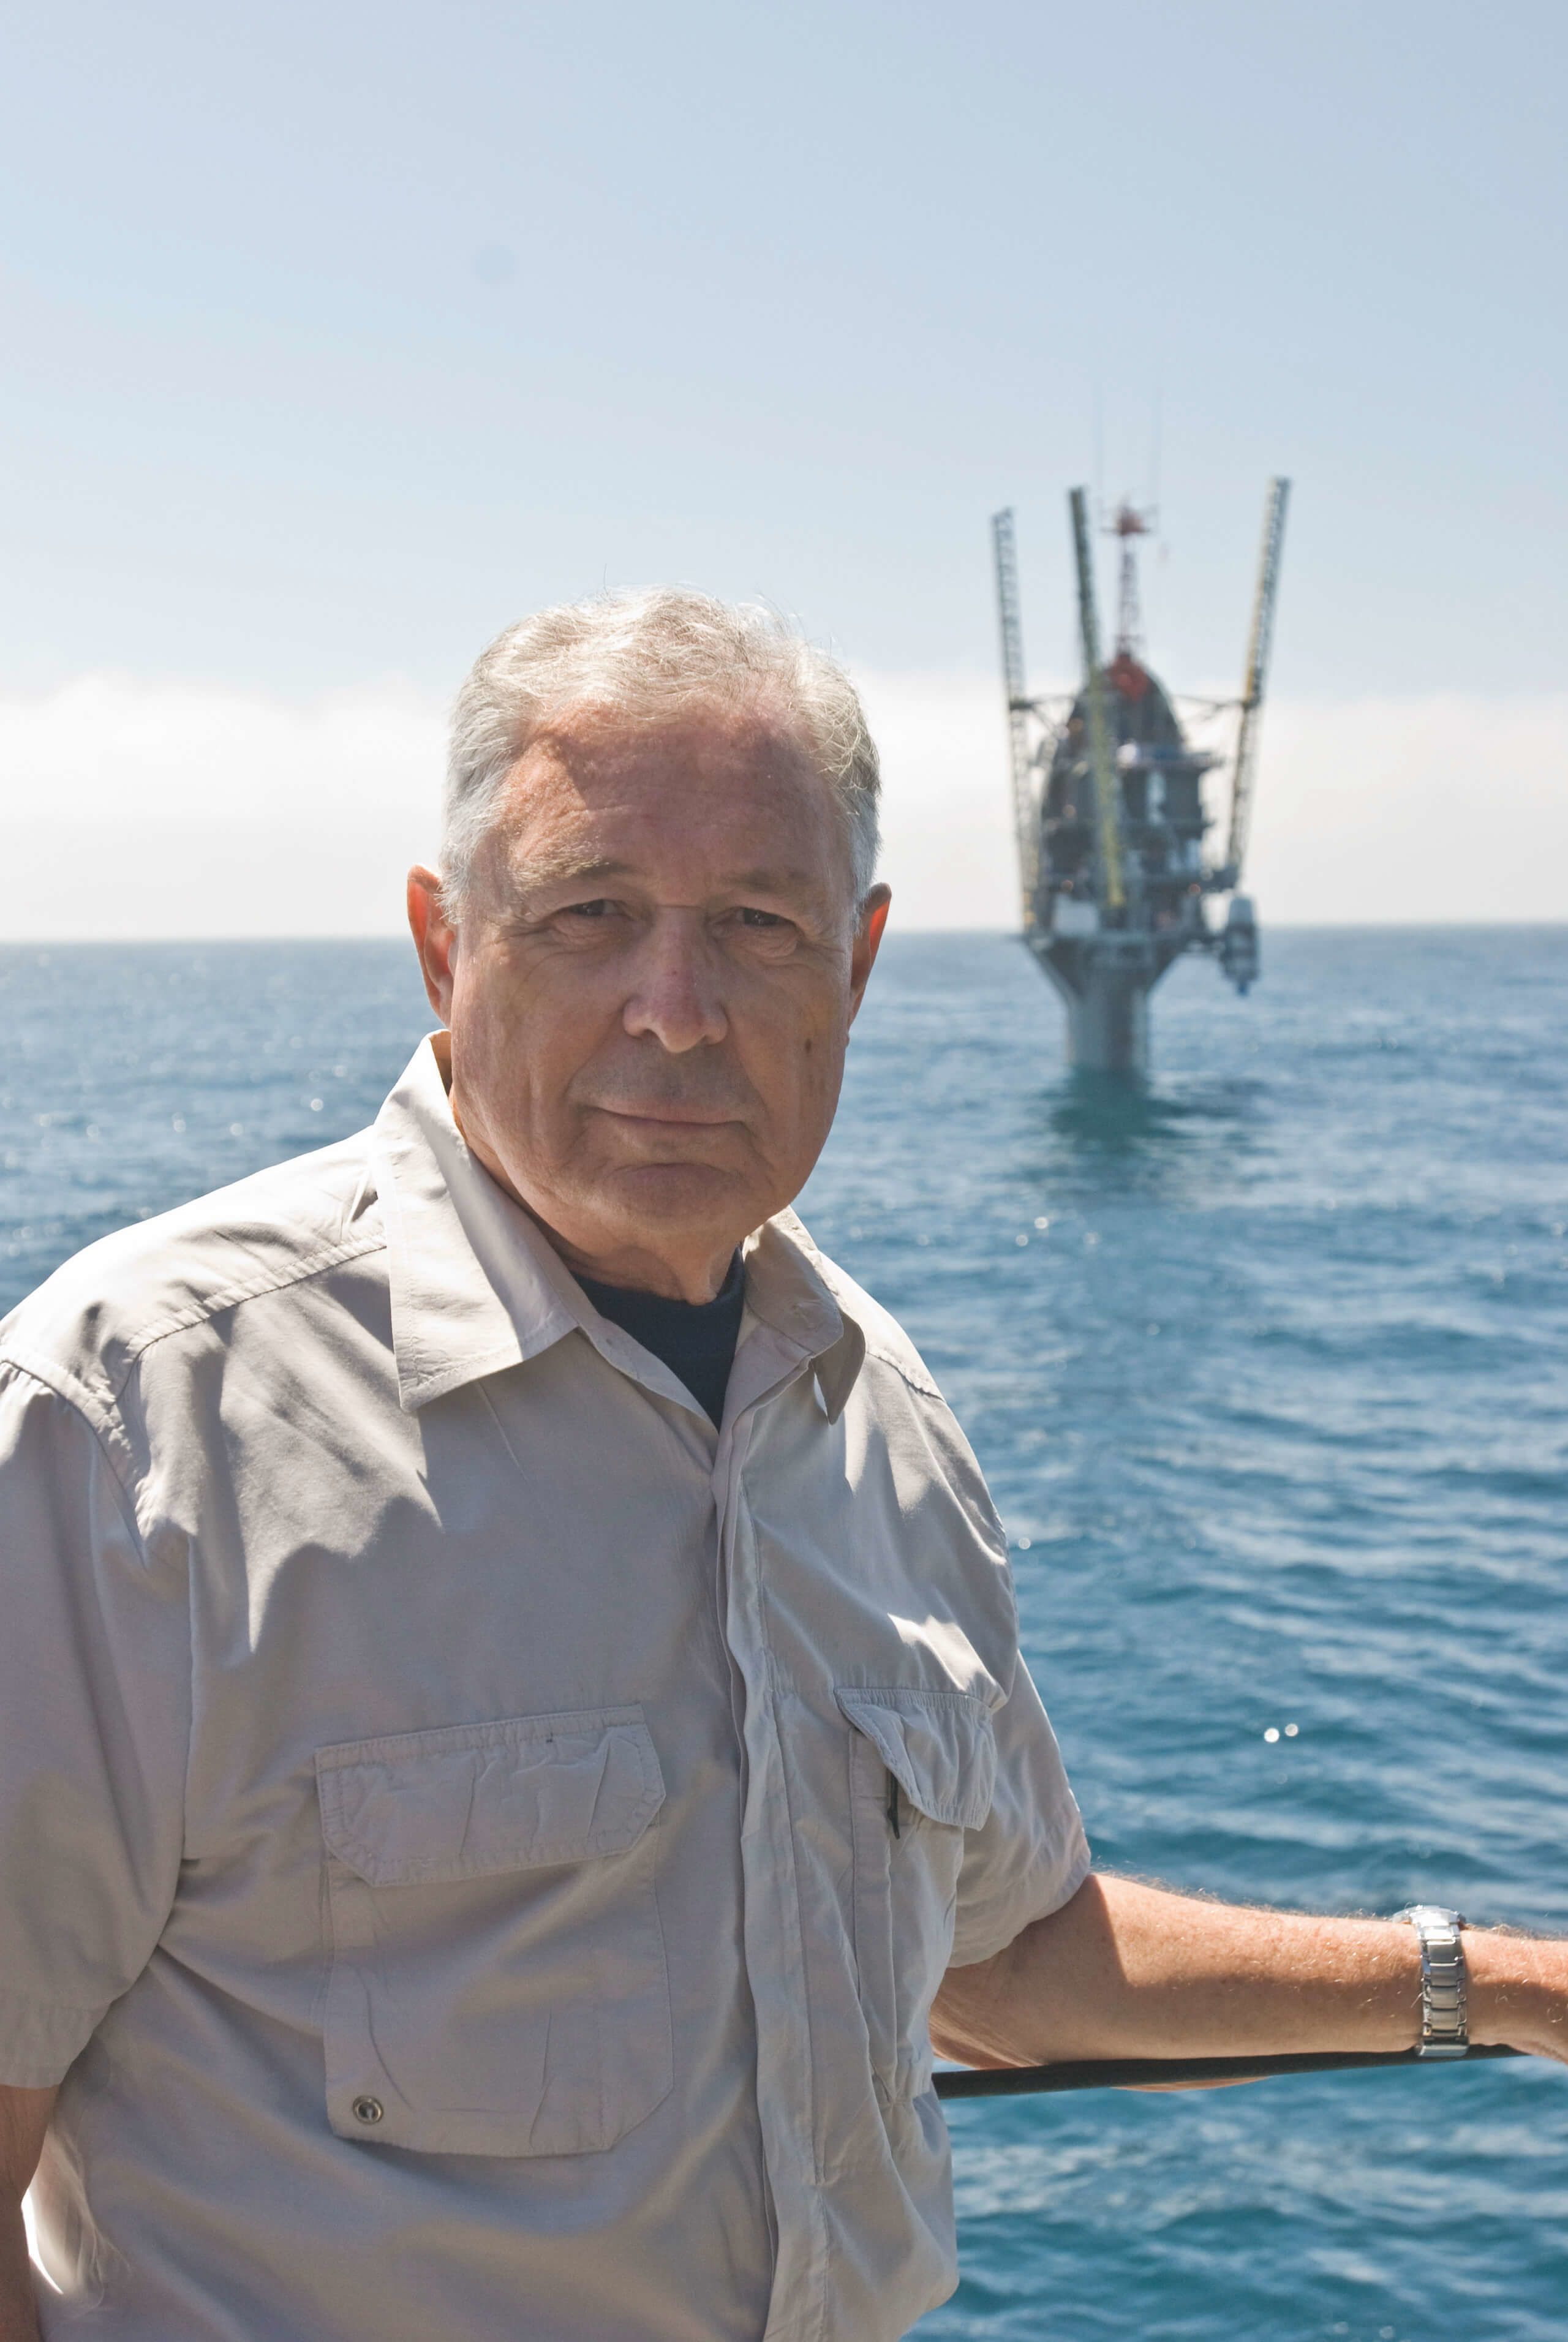
Bill Gaines, now 88, began his career as a sonarman aboard the USS Nautilus SSN 571, the world’s first nuclear-powered submarine.
“Picture those Cold War submarine movies, The Hunt for Red October and all that: I’m the one seated with headphones, listening for acoustic sounds of approaching possibly hostile submarines.”
He would become a US Navy Captain and go on to manage FLIP in 1993 at the Marine Physical Laboratory in San Diego’s Scripps Institution of Oceanography, but in 1962, it was the study of underwater acoustics that FLIP was built for.
“Dr Allyn Vine, the brilliant scientist working with the US Navy, noted how the humble navy mop floated stably in choppy water.
So was born this idea of upending a submarine.”
“Entering the 1960s, the US Navy needed a way to accurately measure underwater sound wave bearings,” Gaines says.
“Conventional ships and subs heave and yaw in open water, making it hard to get a good bearing on sound sources.
Try looking through a periscope and you’ll see.
Well, Dr Allyn Vine, the brilliant scientist working with the US Navy, noted how the humble navy mop floated stably in choppy water.
So was born this idea of upending a submarine.
The design, engineered by [naval architect] Larry Glosten in Seattle, resembled the Louisville slugger baseball bat in profile.”
SCRIPPS INSTITUTION OF OCEANOGRAPHY
William Gaines in 2009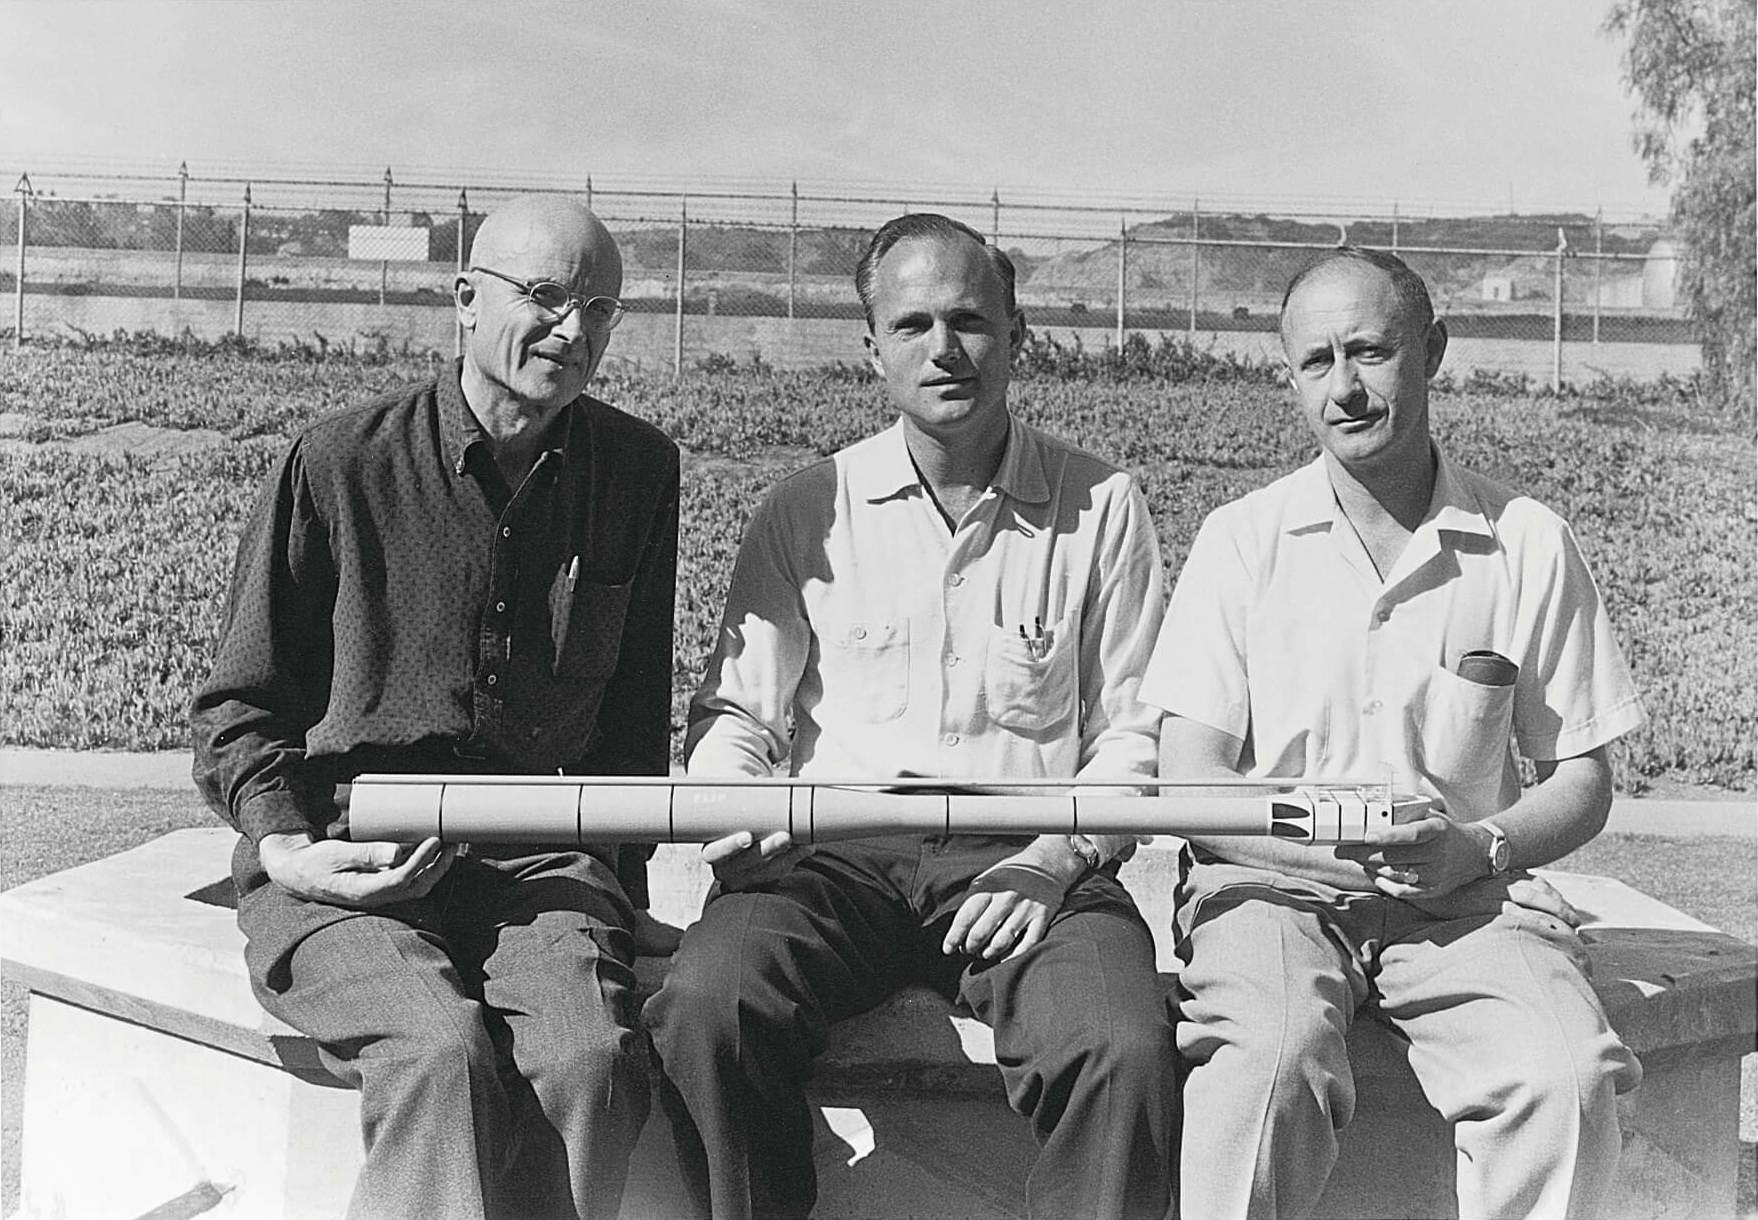 SCRIPPS INSTITUTION OF OCEANOGRAPHY FLIP designers Philip Rudnick, Fred Fisher and Fred Spiess with the first model made from a Louisville Slugger baseball bat
 The builder was Gunderson Brothers in Oregon, who reportedly built it for around $500,000 – just $5 million (£3.7m) today.
Various configurations of ballast tanks were tested in model form.
The final configuration produced a flipping sequence that lasted 20 minutes, but left most of the “verticalisation” until the last 90 to 60 seconds: slow, slow, slow, then fast – jarringly so, as Childers recalled.
Walls and bulwarks turned into floors.
Everything needed to have been arranged in duplicate – sinks, heads et al – or gimbal-mounted to rotate through 90 degrees, as with the generators, galley equipment and bunks.
A lurching, dream-like quality of eerie duality pervaded life aboard, and not just because of the upended doors and shower stalls, now suspended halfway up walls.
When “flipped”, crew members were confined to the bow, or upper section as it became, above sea level (with the exception of one small bunkroom below the water line).
For such a long – rather, tall – structure, it was surprisingly cramped and claustrophobic.
With its submerged mass, FLIP was unnaturally stable, too, even on high seas.
Childers recalled six-metre swells in which FLIP heaved just centimetres.
The crew would look out from upper deck platforms, drinking coffee, as waves crashed over the bows of large support vessels.
The platform felt as steady as a real island, but if waves became sufficiently big, there’d be nowhere (aboard) left to go; no give.

With its submerged mass, flip was unnaturally stable, even on high seas
SCRIPPS INSTITUTION OF OCEANOGRAPHY
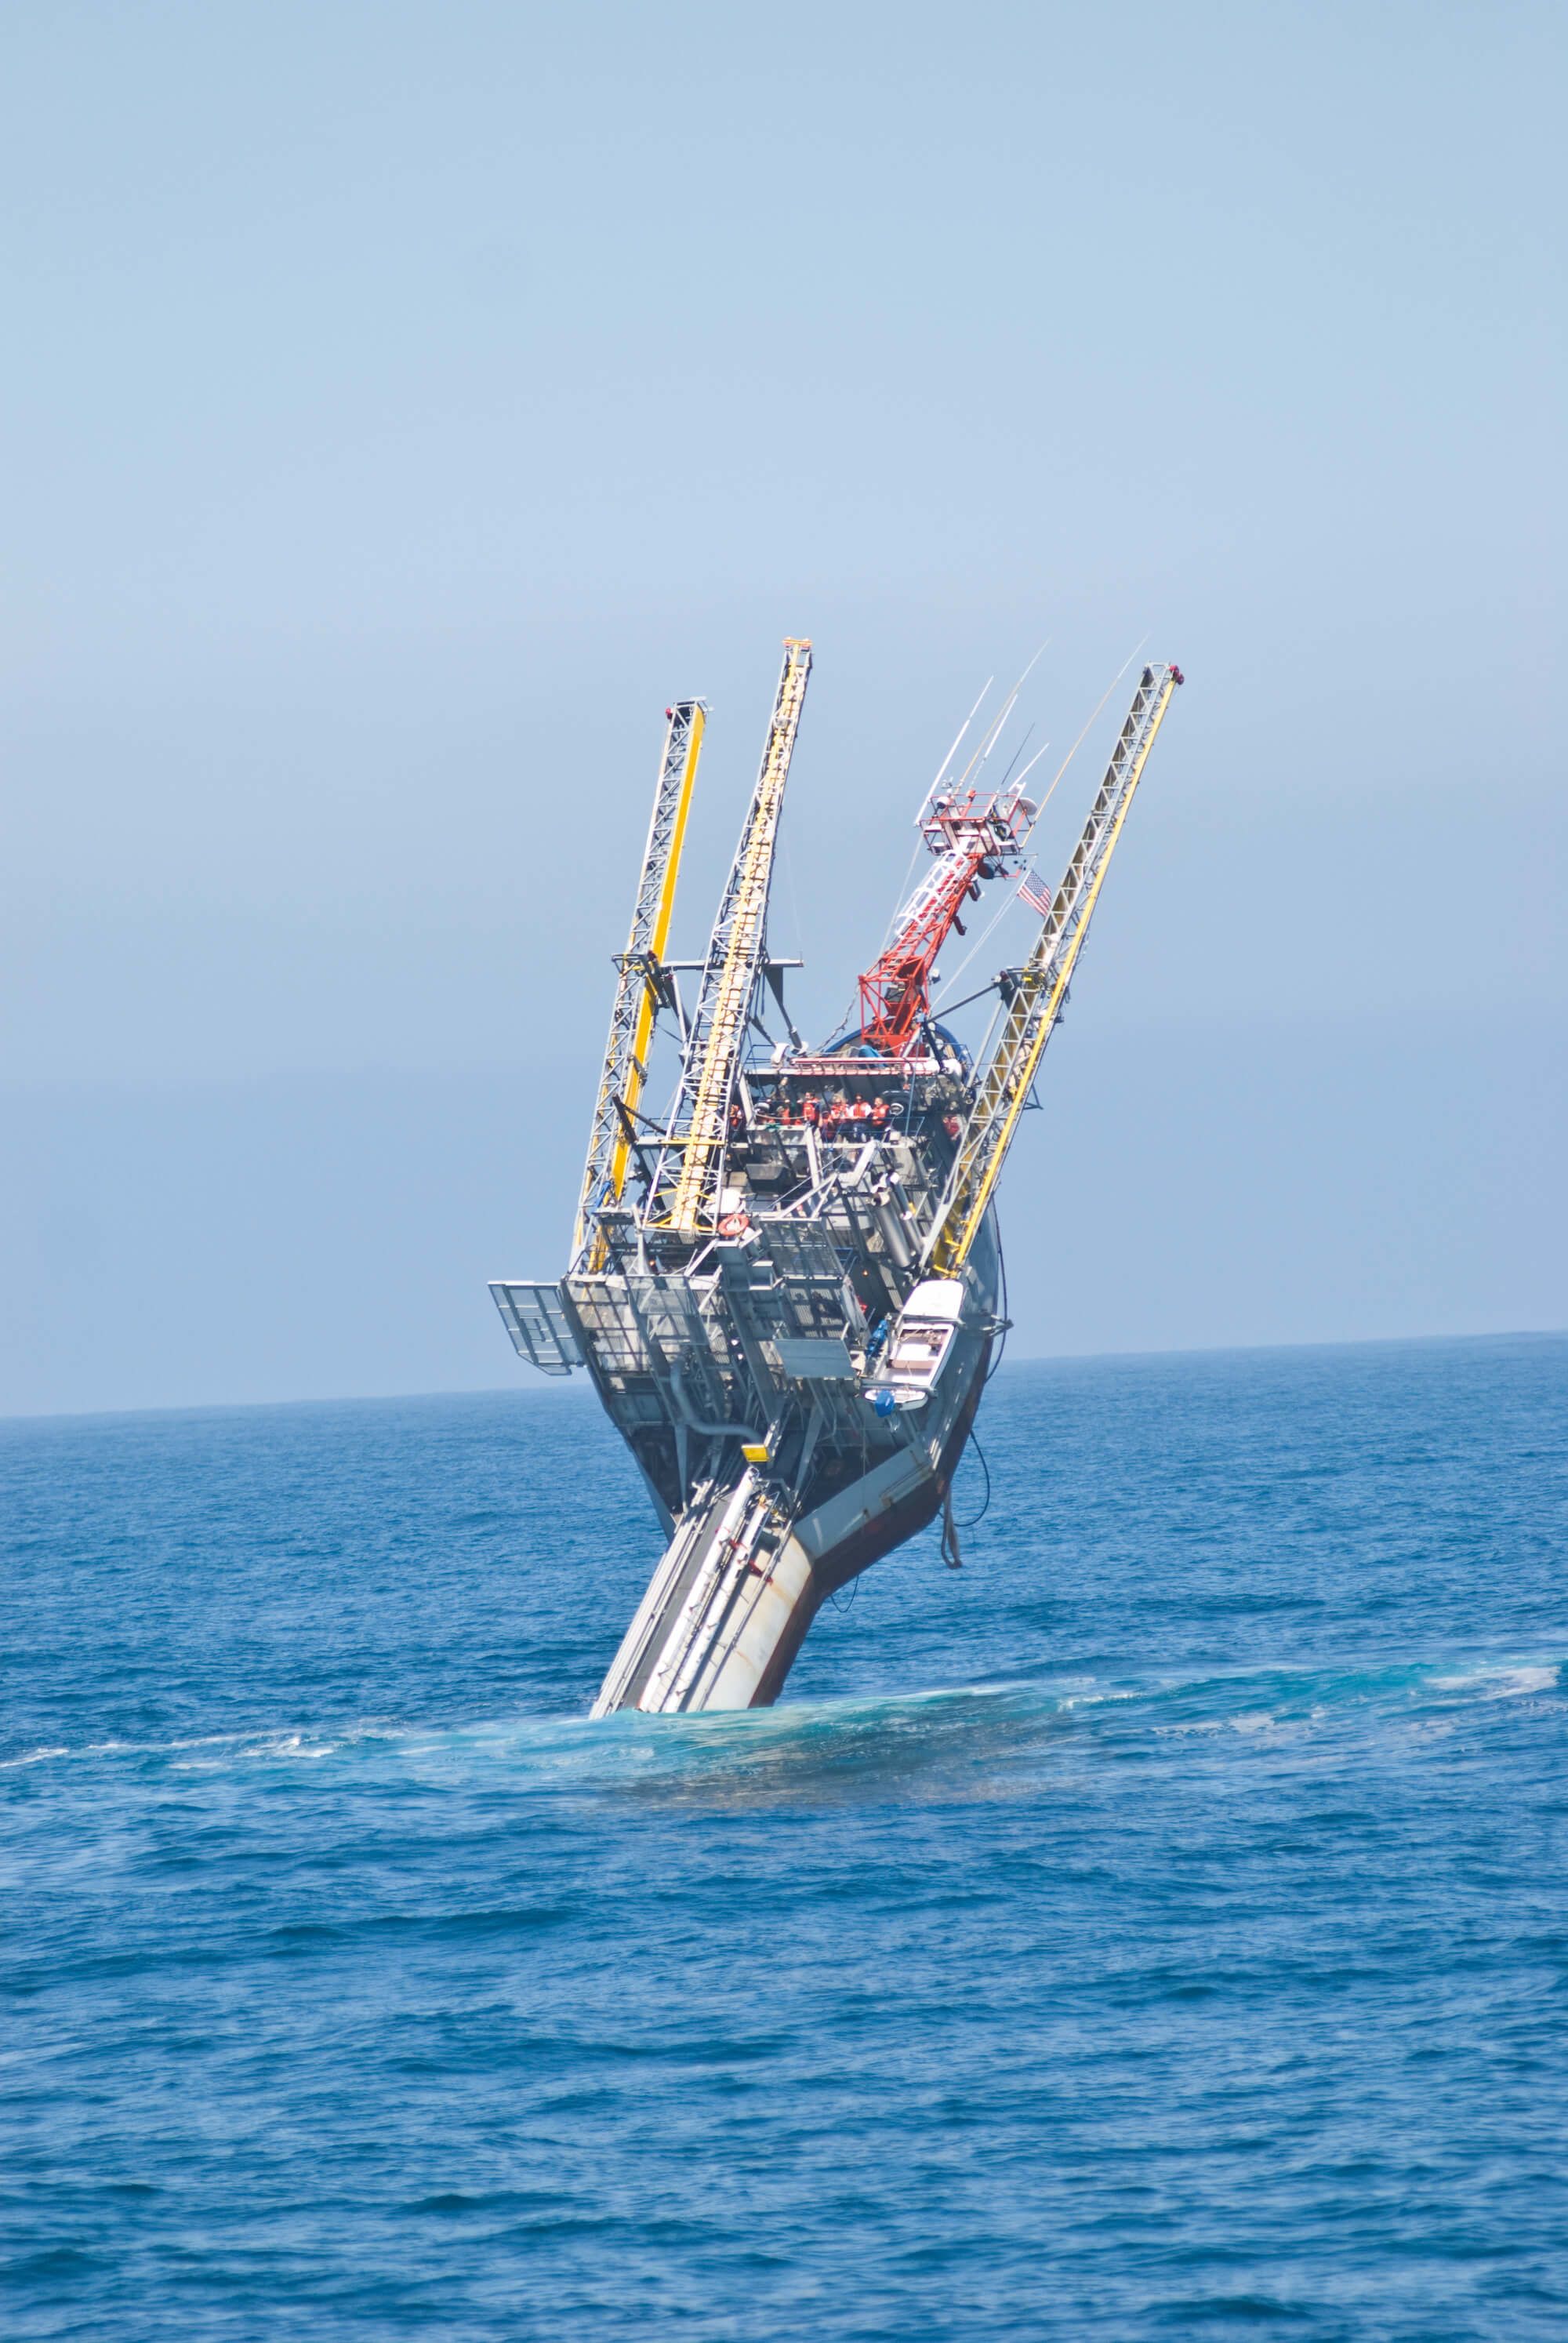
After partially flooding its ballast tanks, FLIP tilts vertically, leaving 17m visible above the water as it turns stern-first into the sea.
Late on December 1, 1969, near the Hawaiian Islands, FLIP’s crew stared out as 25-metre blue water swells – generated by a stationary storm 2,400 kilometres away – crested to within a metre of the very top platform, to which they’d retreated.
They’d lost electrical power and a big chiller box of food that had been swept overboard.
Past a certain point of submersion, FLIP’s buoyancy would be compromised.
The ship they were operating with was there beside them, waiting; they only had to reach it.
Deep blue waves the size of office blocks rose, and rose, seemingly unstoppably; almost freezing at their peaks – merely shedding chilling spindrift there – before sinking; sucking down the salted air with them.
All the crew managed to step off as the waves peaked
except Ben Parker, the much-liked chef.
He hesitated just long enough to fall the full distance into a wave trough with a disconcertingly faraway splash.
Thankfully, he made it back to the ship.
Even among smaller, gentler waves, embarking or disembarking this way demanded agility, timing and nerve.
It could all too easily require taking a shower with clothes still on, to get rid of the salt.
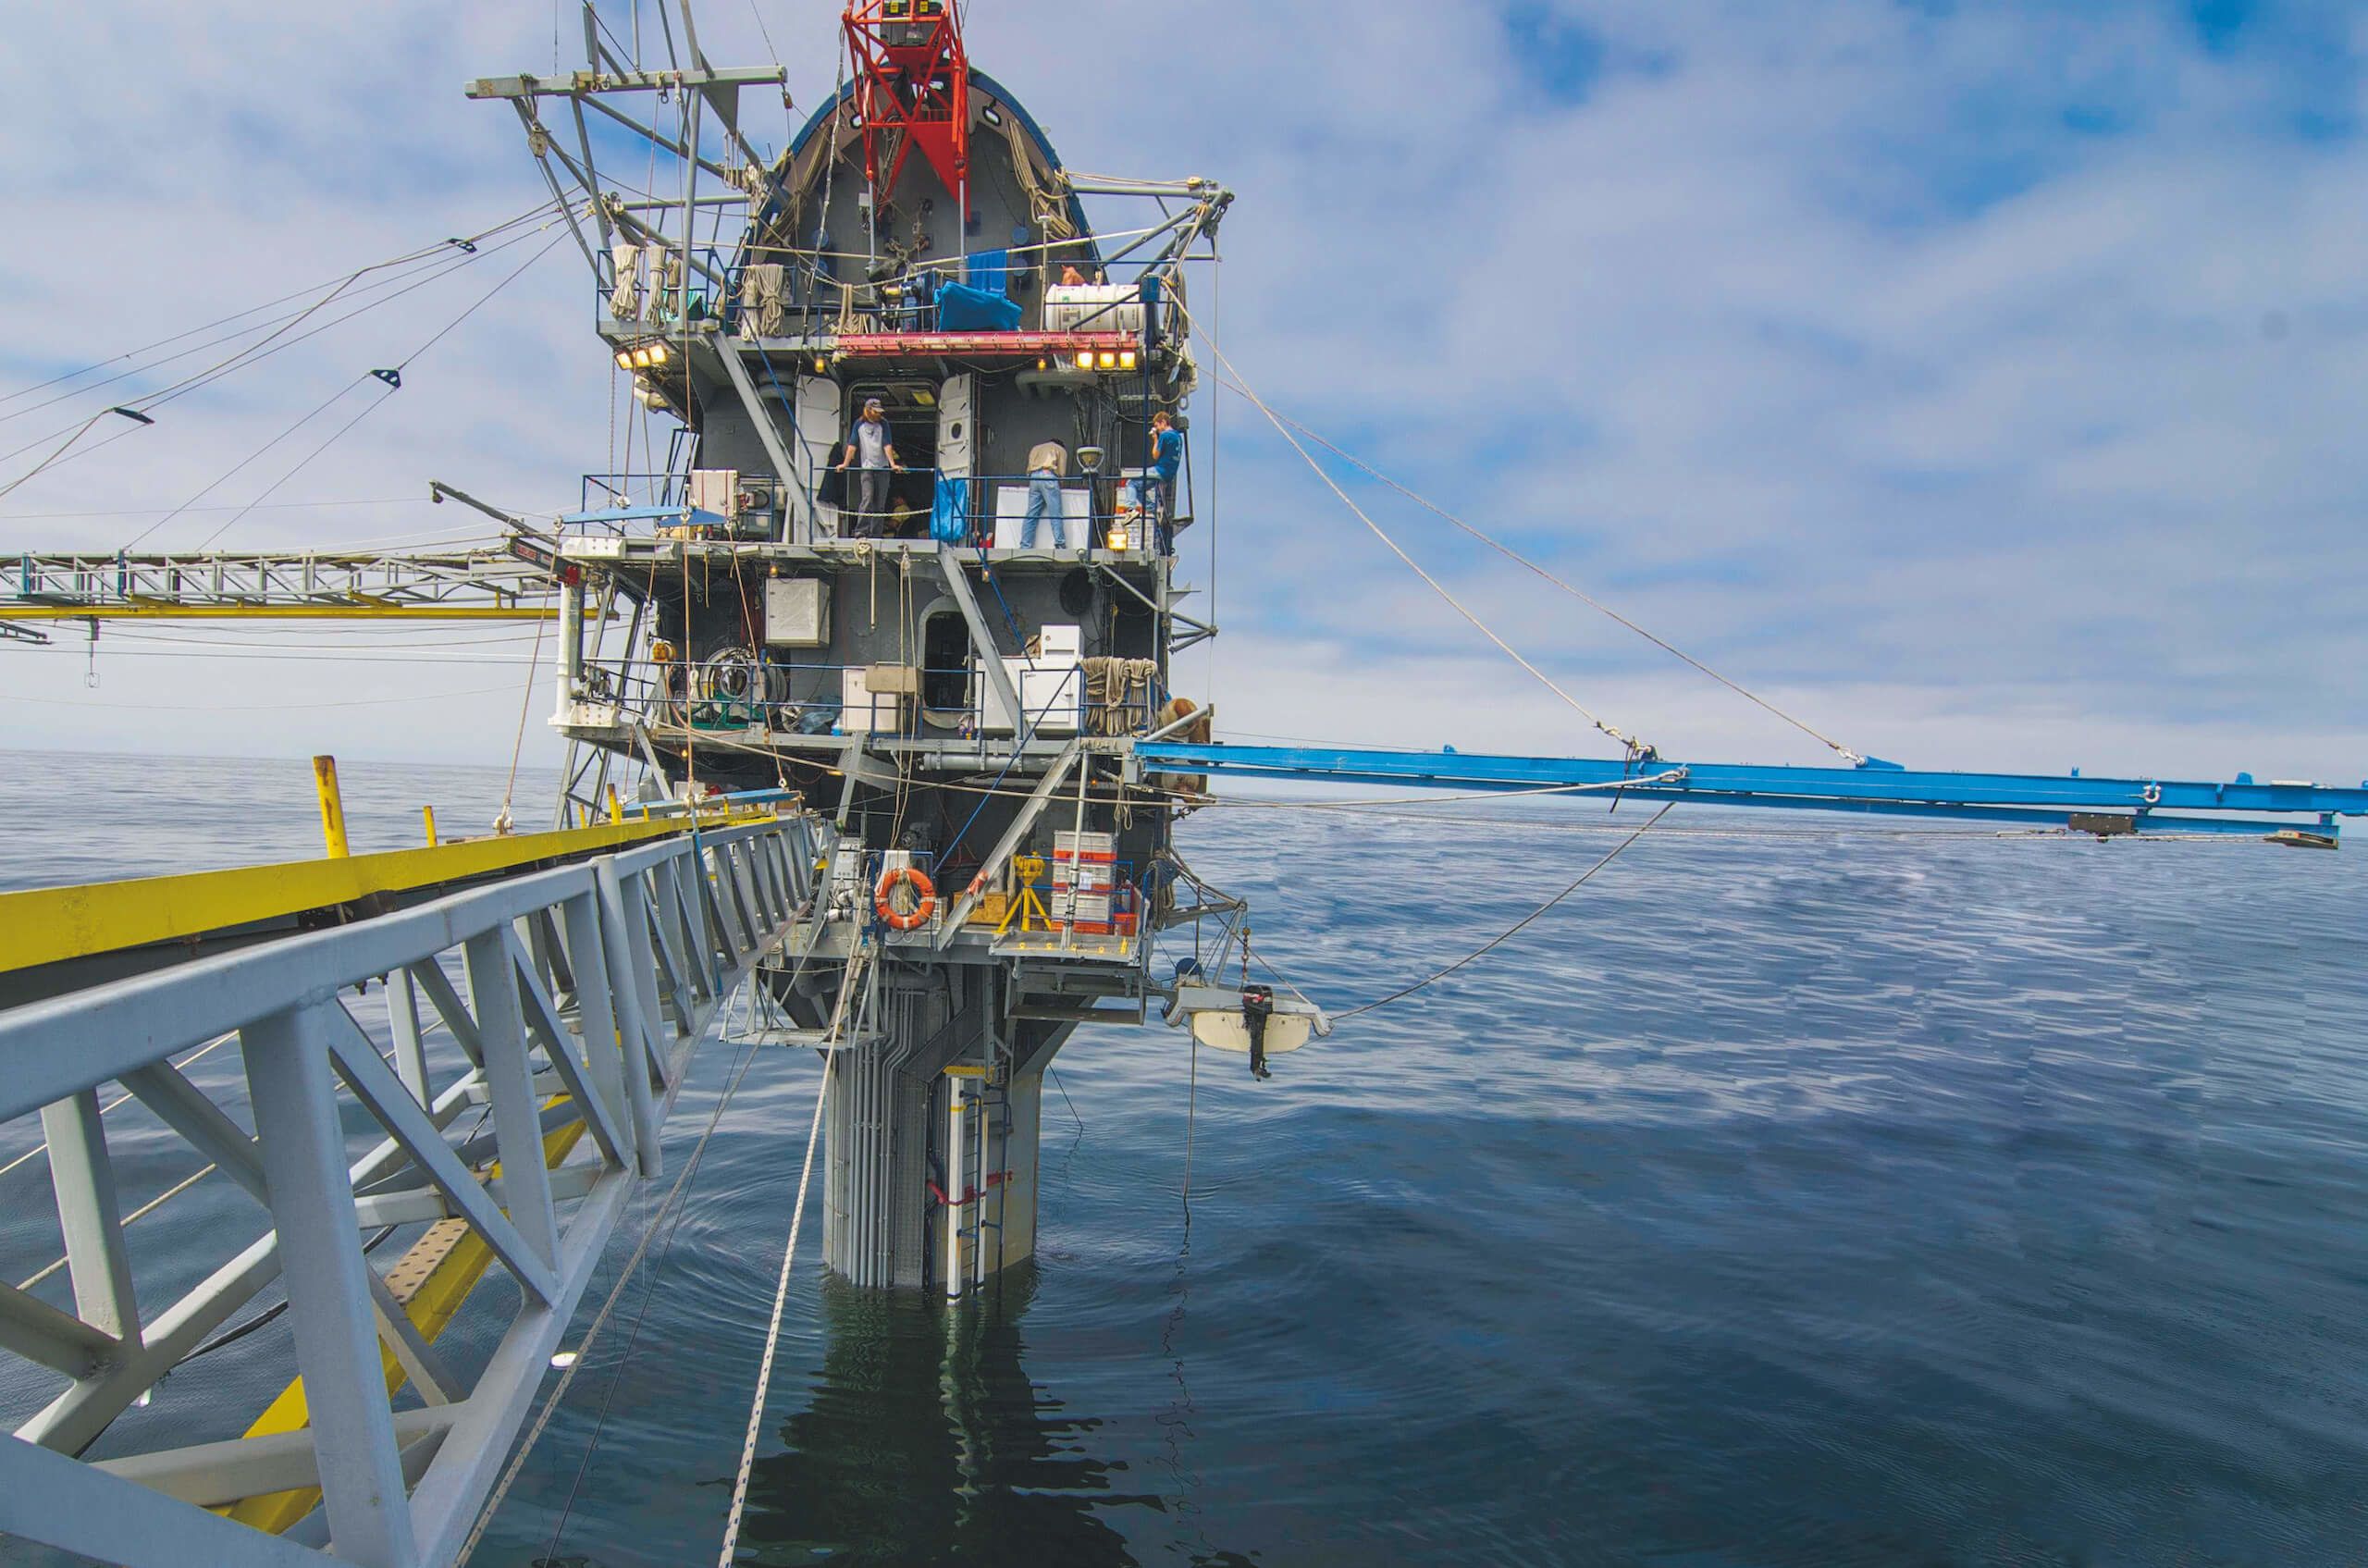
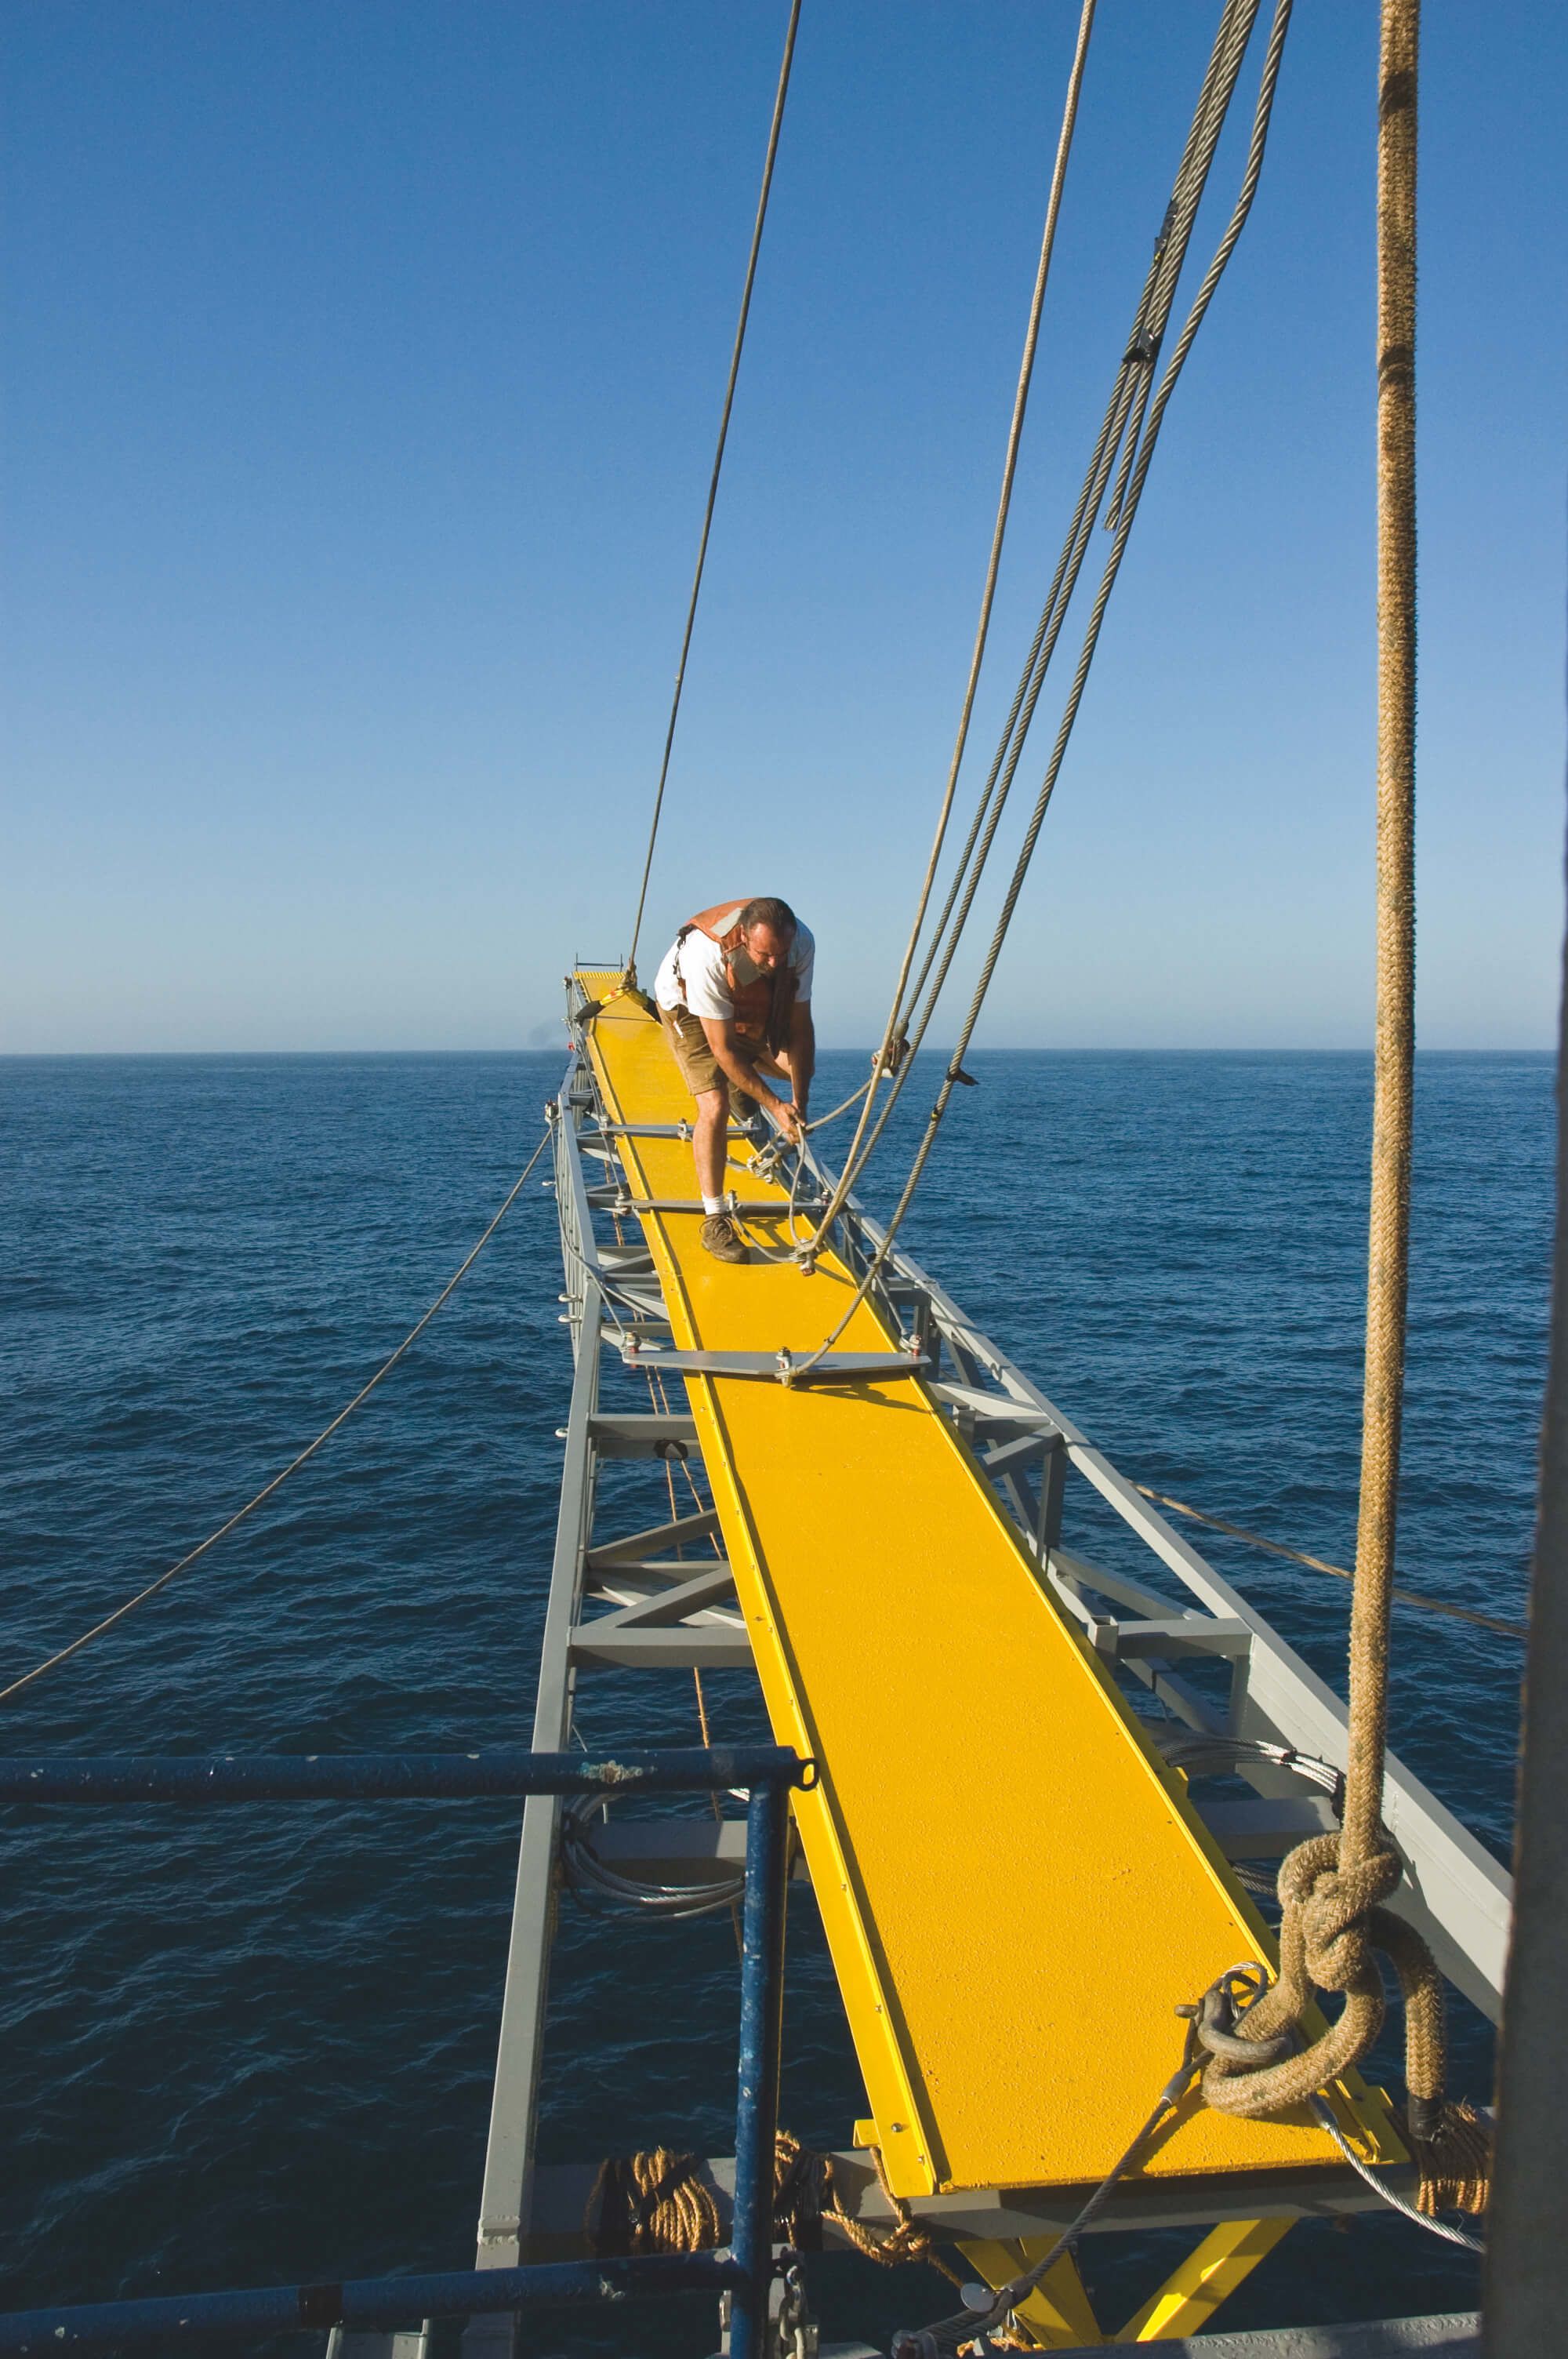 FLIP has 18-metre-long boom arms that spread out over the water surface
The core reason for FLIP was the submarine-launched rocket (SUBROC) programme.
It was a long-range – 50-kilometre – weapon for time-urgent submarine targets – “greater range and speed than the conventional torpedoes of that era,” Gaines says.
A rocket would launch from a torpedo tube towards the surface and would fly through the air on a predetermined ballistic trajectory.
At a given point, a re-entry vehicle would separate, drop back into the water and sink, detonating near its target.
A direct hit was not necessary to destroy the enemy submarine, but accuracy remained imperative: the re-entry vehicle was to carry a tactical nuclear warhead.
The challenge lay in both detecting and tracking the hostile submarine, at long range, and getting the right bearing for the ballistic trajectory.
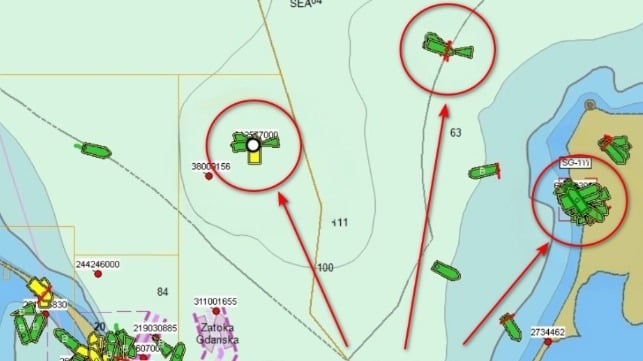
To accurately measure underwater sound, a laser, mounted on FLIP above water, obtained fixes on submerged objects marked out by reflector poles also protruding above the water line.
These distant objects emitted sound.
FLIP’s extraordinary stability, mid-ocean, made this arrangement a consistently reliable test for accuracy of bearing.
Helpful too was the absence of a propulsion system: there was almost no interference when it came to the sound measurement.
The diesel generators delivering power to FLIP were sound- insulated and housed above the water line.
Its 18-metre-long boom arms spread out over the water’s surface, looking like the wings of a low-flying plane, holding instruments away from its body, further lessening interference.
Long arrays of sensors would hang from its base, plumbing the influence of water temperature and pressure on sound at greater depths.
Its 18-metre-long boom arms spread out over the water’s surface, looking like the wings of a low-flying plane

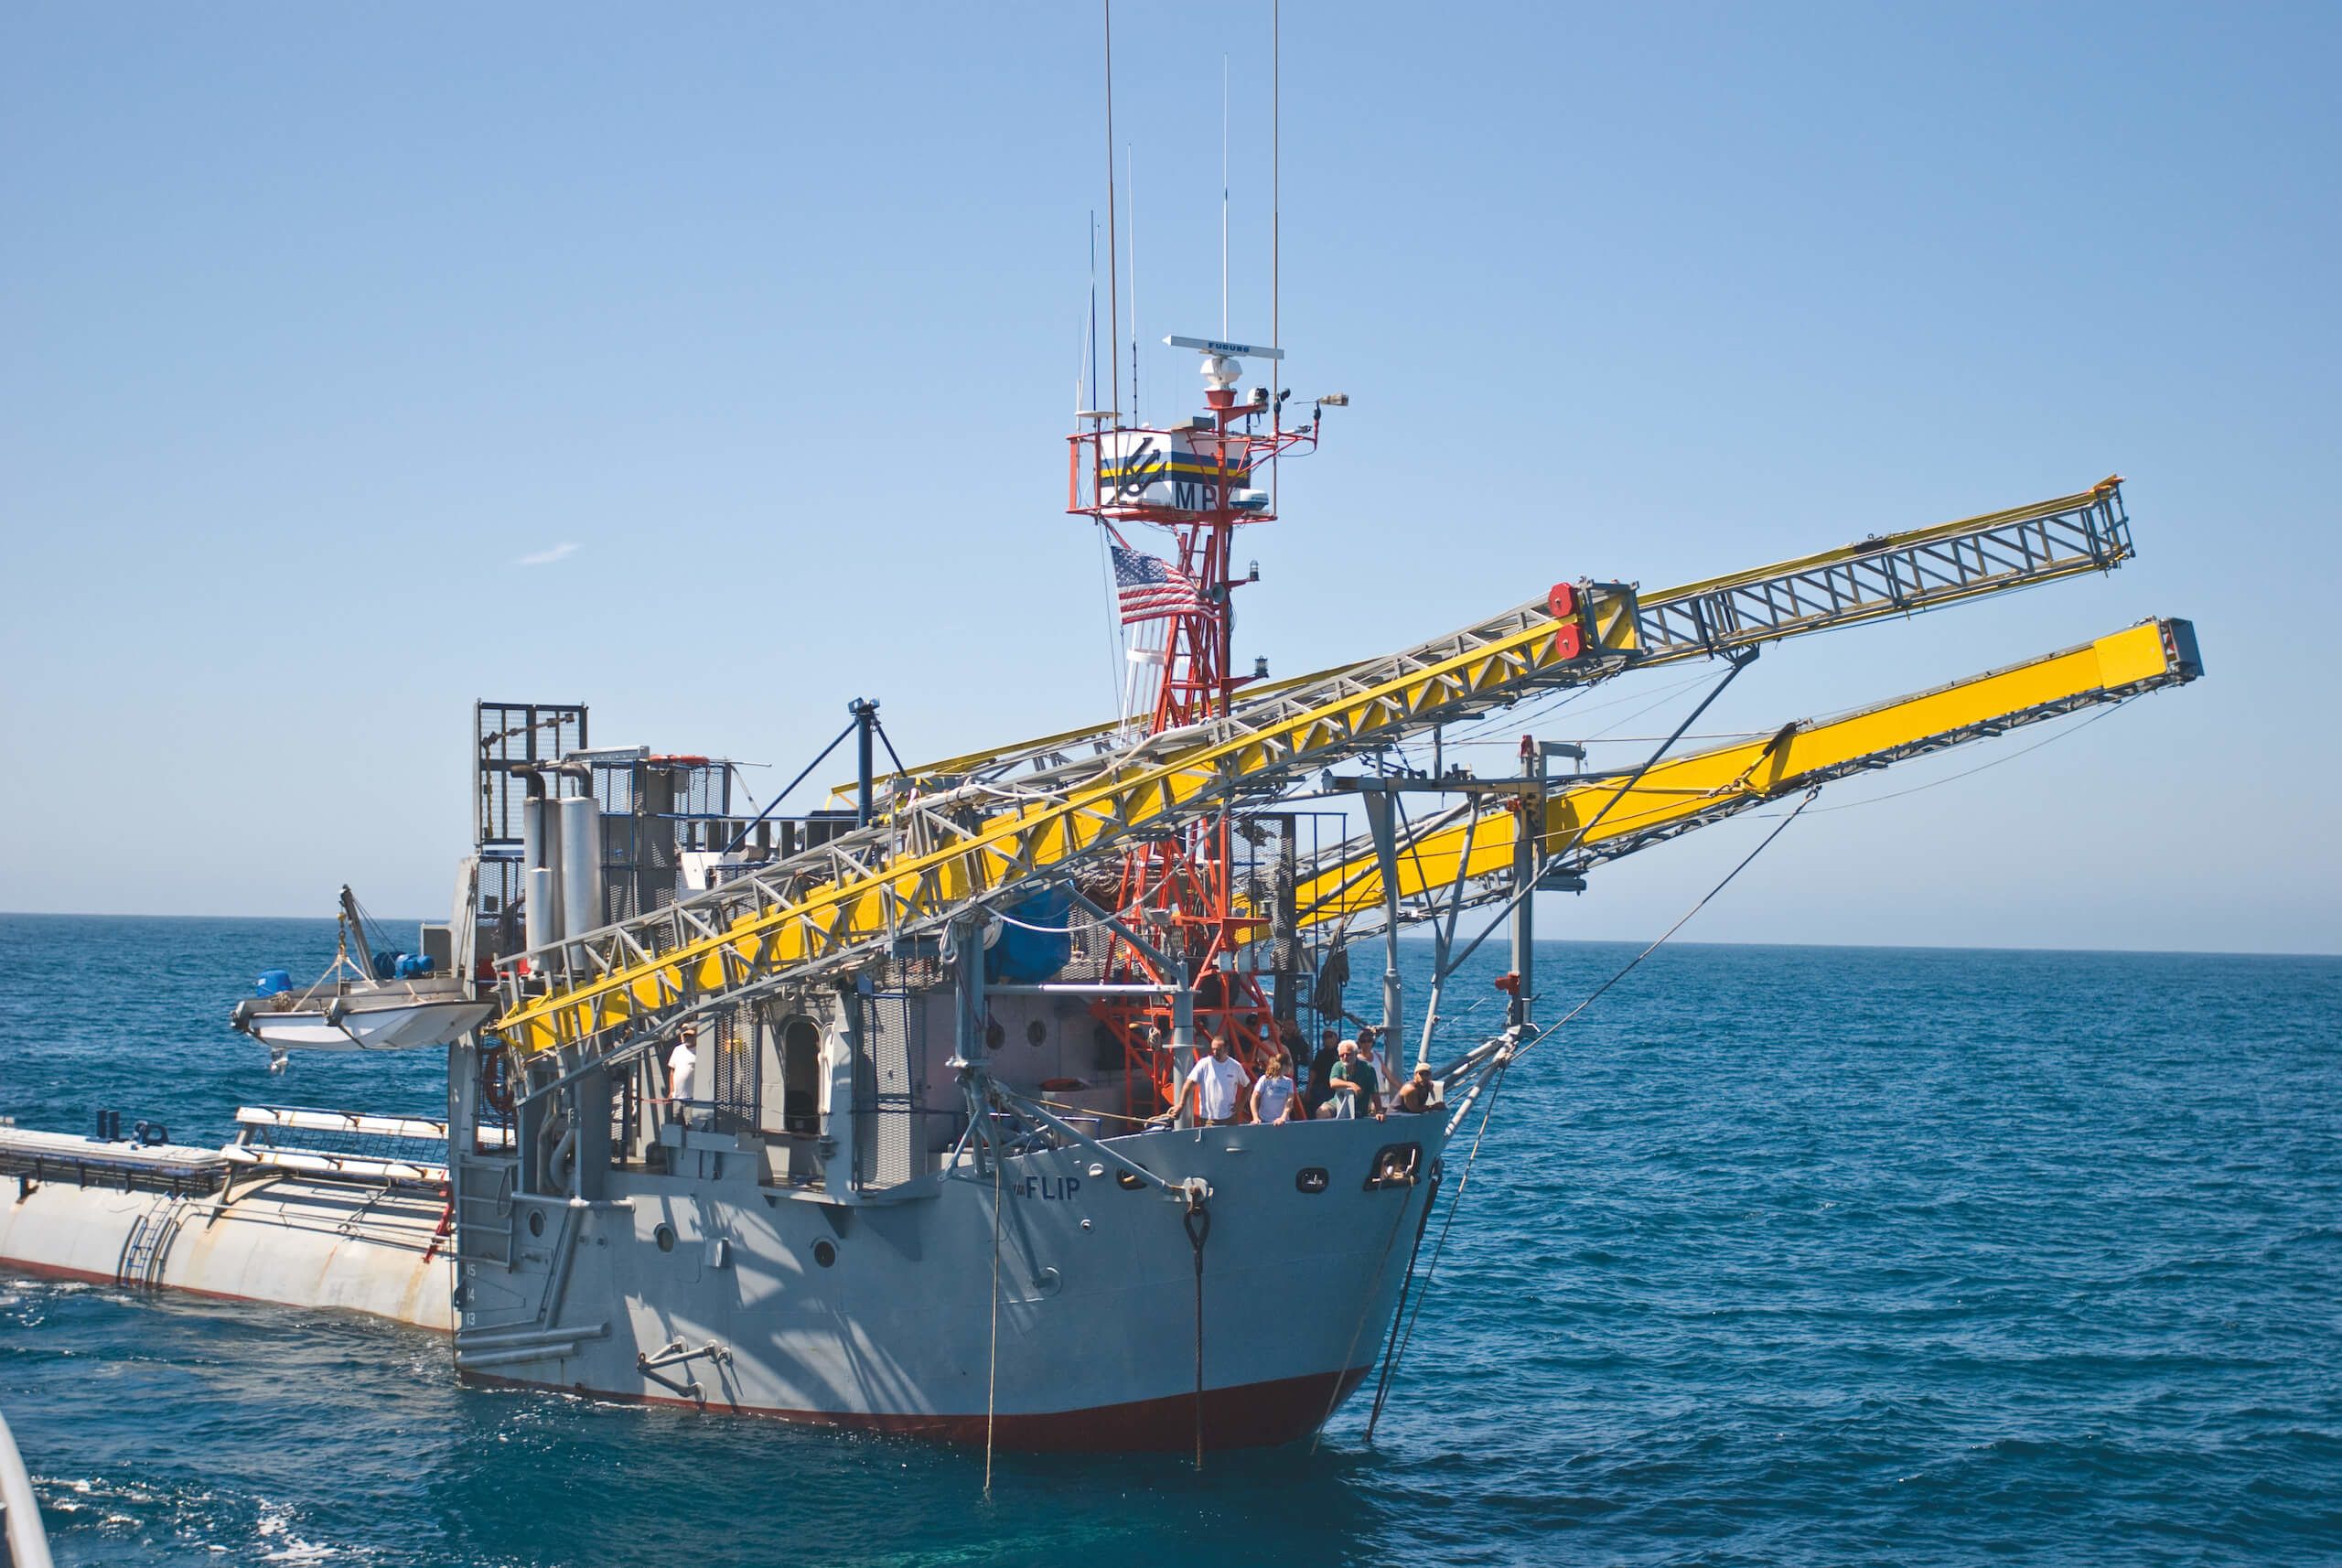
FLIP before the transition begins
Image courtesy of Scripps Oceanography
SUBROC went the way of the Cold War, yet FLIP remained in service.
Acoustic research remained its USP, with missions widening to include marine mammal and meteorological studies.
However, US Navy funding was no longer a given, and things didn’t always go according to plan.
“One time we went down to the Gulf of California in Mexico to study whales,” recalls John Hildebrand, a professor of oceanography at the Scripps Institution in San Diego.
“FLIP would set down a three-point mooring to prevent it from drifting in the currents.”
The three “legs” were in fact 10 tonnes of anchor chain with 3.8-centimetre powerbraid nylon line able to withstand 32,000 kilograms of pressure.
“The trick was to put down the first ‘leg’ up-current,” says Hildebrand.
“On this occasion, the currents were strong enough that, having put down the first leg, FLIP began listing at a 45-degree angle.
The tension was so great that there was no way to release it in the normal way, so our captain, Tom Golfinos, ventured out in a dinghy to cut the nylon line by sawing through it from beneath.
We were afraid the released line would whiplash and take him out.”
Hildebrand hereby surfaces another risk on FLIP: the precise sequence of steps needed to “blow” the ballast tanks and de-flip it to horizontal.
Get these wrong, and the rotational tendencies could land it back on the surface with its hull facing up – “turned turtle”.
“It had a real spin when it flipped and unflipped,” says Hildebrand.
“Tom[Golfinos] knew the steps; the rest of us didn’t. There were instructions written down, but do you really want to be trying them out for the first time in those sorts of currents?”
"It had a real spin when it flipped and un-flipped.
Tom knew the steps; the rest of us didn’t"
Scripps institution of oceanography
FLIP provided unique benefits to Hildebrand too, though.
Just like with SUBROC, the ability to synchronise sight and sound was key.
“There was a mast at the top we could climb and get over a hundred feet [30 metres] above the water, with unobstructed 360-degree views.
There were also long ladders up and down FLIP; it was like staying in a tree house.” It served as an attractor pole for smaller fish, drawing in whales.
“We could watch blue and fin whales break the surface to blow and breathe, all the while listening in to their sound.
That was a first – realising, say, ‘There’s the whale that just broke its song, to take that breath’.” As Hildebrand clarifies, “Nowhere else could offer this co-ordination of species identification, recorded sound and observed behaviour.
Blue and fin whales are, respectively, the largest and second-largest animals ever to have lived, including dinosaurs.
We began to learn how males would use songs to communicate with fellow whales.
Males sing, females don’t; broadcasting such a powerful sound announces your position to enemies.
It’s all about convincing other whales that you have some characteristic, by seeking to project it.”
"It had been ridden hard and put away wet....
During my first survey of FLIP, I was truly shocked to discover the rust that the seawater had caused in those ballast tanks."
The challenge lay in FLIP not being designed for decades of use.
It had been built fast with the fierce urgency of a singular Cold War mission.
“To use a Western phrase, it had been ridden hard and put away wet,” says Gaines.
“By the time I arrived, it had been in continuous service for more than 30 years.
During my first survey of FLIP, I was truly shocked to discover the rust that the seawater had caused in those ballast tanks.”
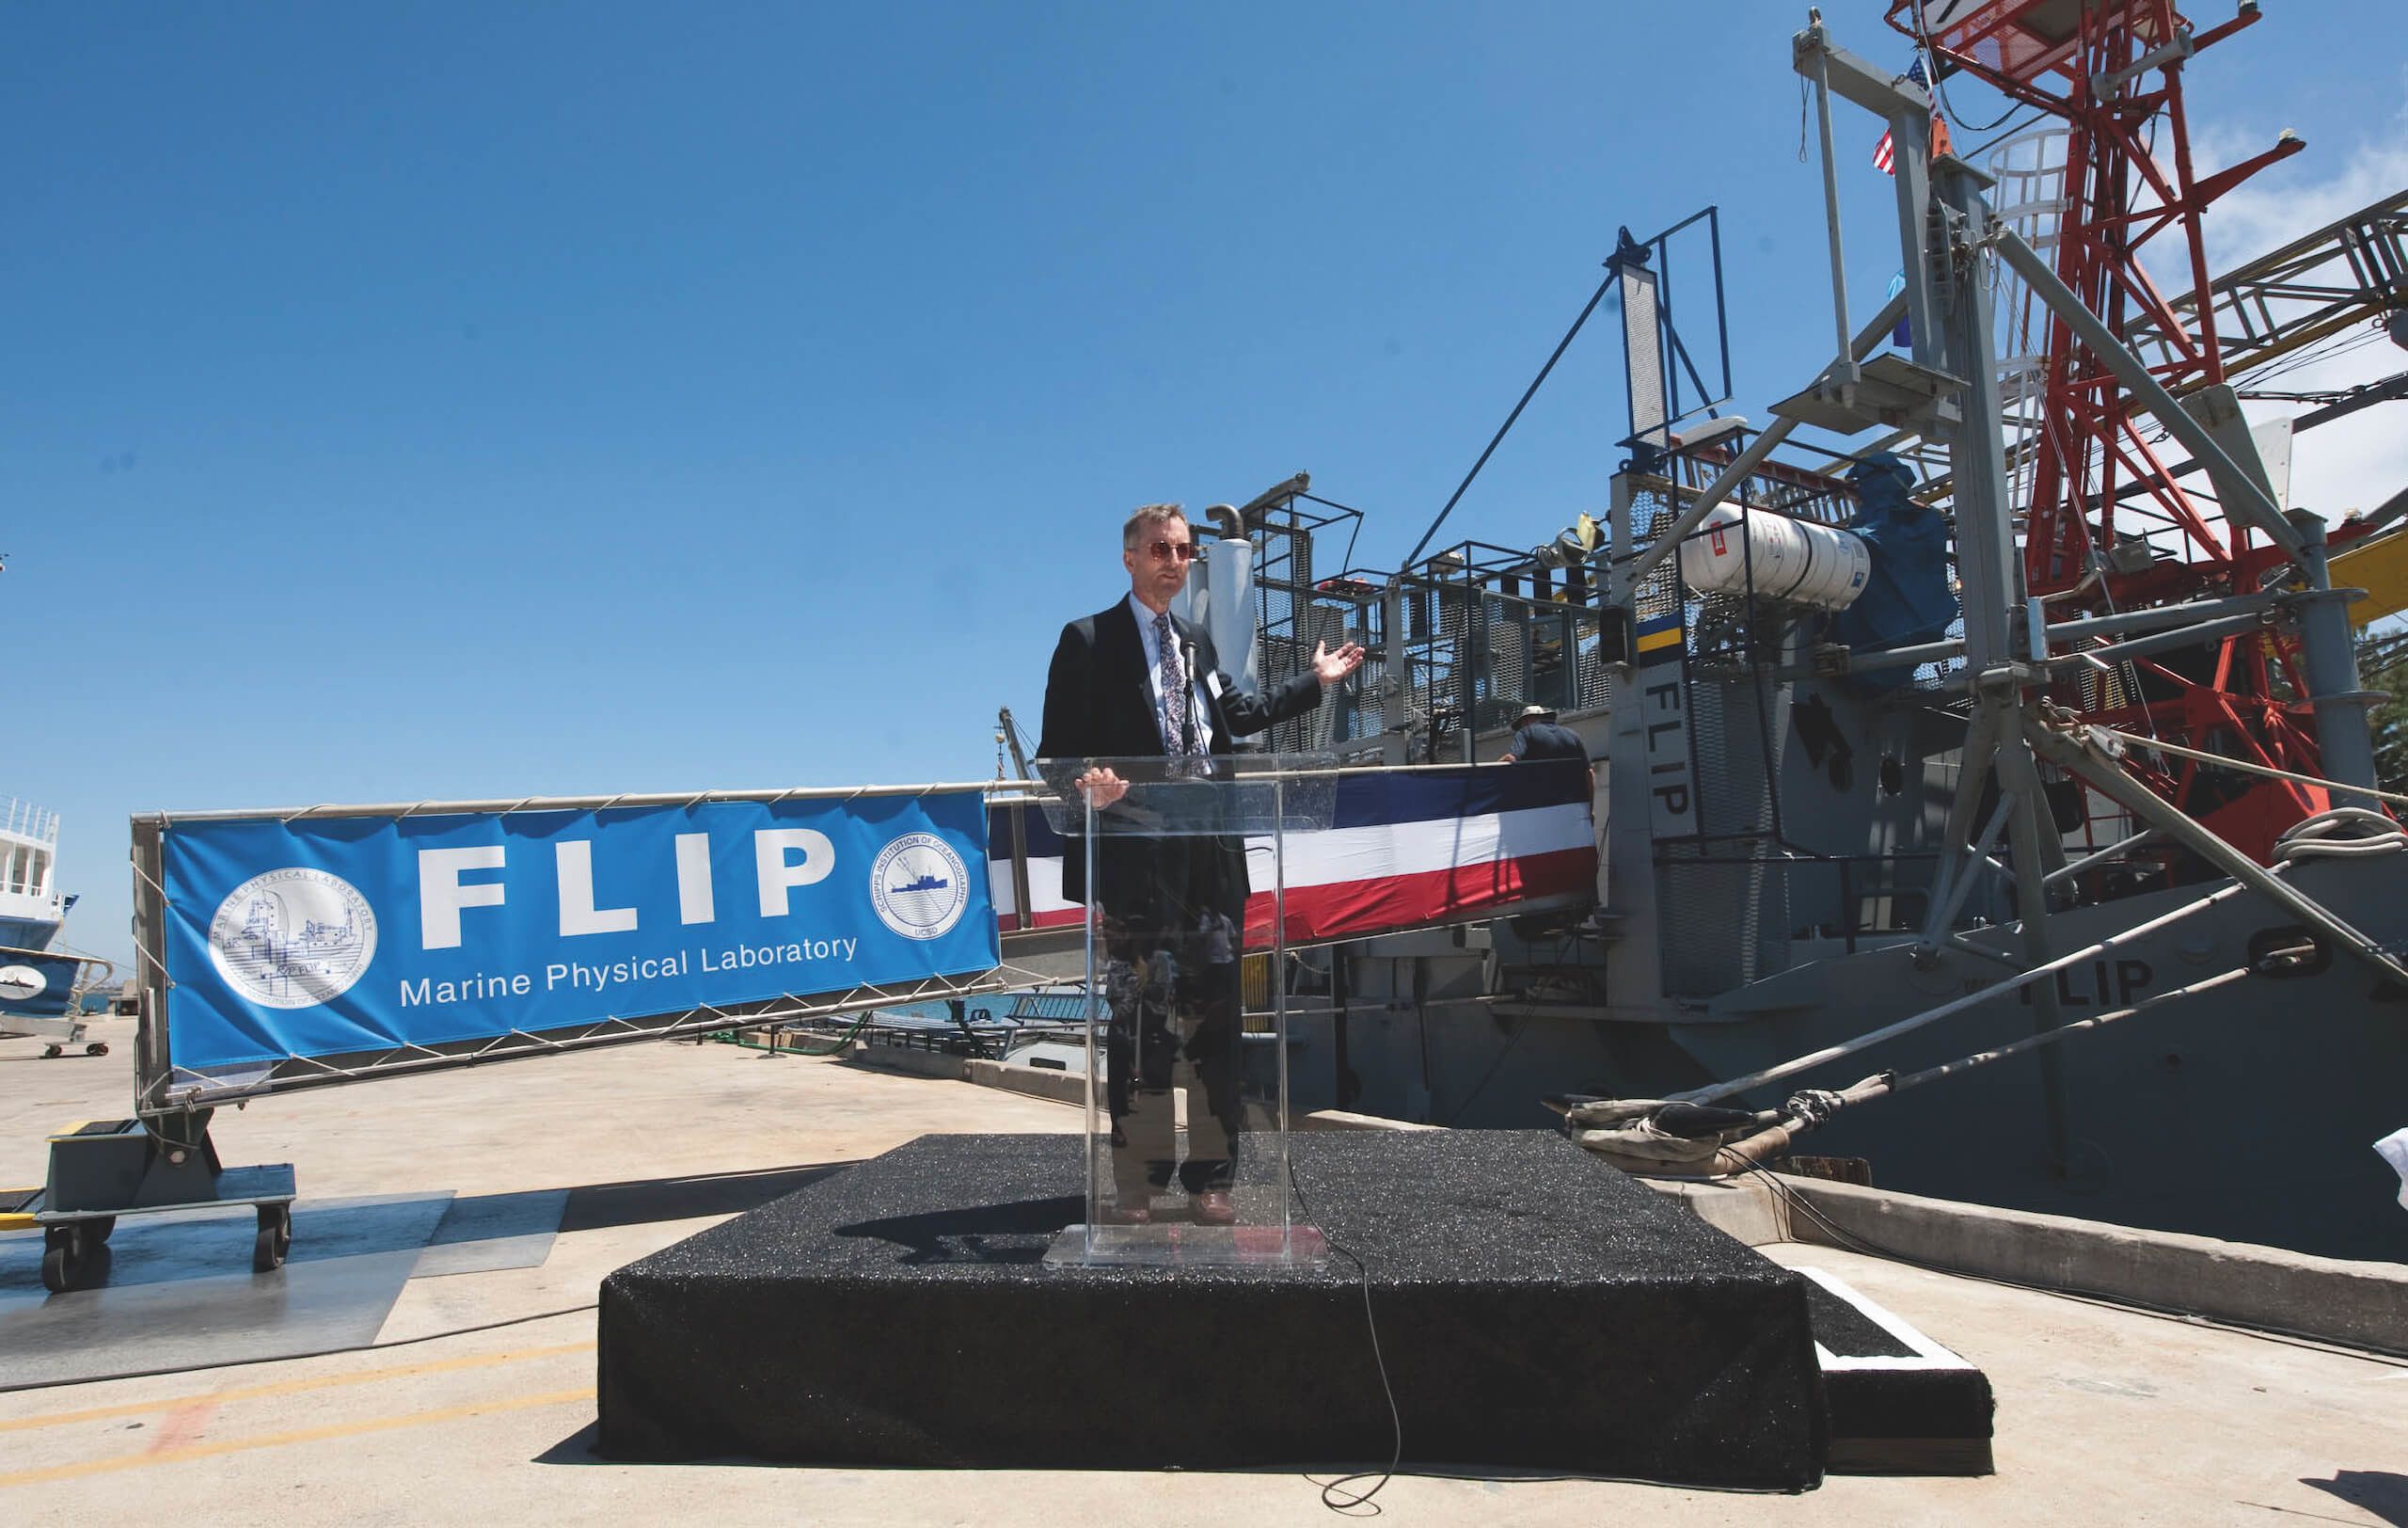
Dr Frank Herr of the Office of Naval Research Ocean Battlespace Sensing Department at FLIP’s 50th anniversary.
Z2A Collection Alamy Stock Photo
FLIP could not have wished for a better custodian than Gaines.
Steeped in the folkways and thinking of the Navy, he knew how to manage FLIP’s budget wisely.
There was no cost-cutting Elon Musk (then) that Gaines could be likened to; instead, he’d earned the ironic nickname Wild Bill.
“Yes, I was prudent,” he says with a laugh.
“I liked to stay on top of things.
We had a cook, Tony Parra, who’d also been on the USS Gudgeon SS 567 submarine that I’d captained.
I found out FLIP was using its limited funds to feed the crew when in port.
Tony was feeding them very well, too.
This was not authorised expenditure, so sadly I had to put a stop to that, though Tony still had a job when FLIP went to sea.”
In 1995, Gaines secured the $2 million funding needed to refurbish FLIP.
“It was a lot of money at that time,” he says (almost as much as the 1962 construction budget adjusted for inflation).
“That looked to be its last major overhaul. FLIP was riding into the sunset.”
One reason for predicting FLIP’s demise was that it couldn’t go very far north.
The US Navy knew then how strategic the Arctic would become.
Glosten Associates, the Seattle naval architects who’d engineered FLIP, pointed to the risk of wave periods longer than 17 seconds: these might induce a “resonant heave response” whereby the platform’s heave would get out of phase with the waves, potentially causing it to plunge.
“Northern latitudes typically have higher waves with longer periods than the lower, tropical latitudes,” says Bill Hurley, then Glosten’s president – although he adds that a 17-second period can also be associated with large swells at lower latitudes, like those near Hawaii in 1969.
Separately, the 4140 high-strength steel used for FLIP’s construction was not suitable for low temperatures.
Hurley recalls that, back in the 1980s, the Scripps Institution had explored building a bigger, more capable “FLIP II” with larger cabins and an elevator, but that pencilled out at $18 to $22 million: $46 to $56 million now.
As it turned out, FLIP held on for two more decades, completing its final mission in 2017.
Qing Wang, a professor of meteorology at the Naval Postgraduate School in Monterey (US), led the final, 10-person, 30-day scientific mission off California.
Helium canisters festooned FLIP.
The team sent up 180 weather balloons, but their main focus lay closer to the waves.
“The exchange of moisture and energy between the ocean’s surface and the atmosphere just above it is crucial not only for weather forecasting but also for how radar moves through the air over the ocean’s surface,” says Wang.
“Plus there is the CO2 issue – the role our oceans play in absorbing emissions.”
For the last mission, all three booms were out (including the nose or “Pinocchio”).
From them hung 50 to 100 instruments measuring air pressure, wind speed, temperature and moisture in myriad ways.
FLIP’s ability to minimise interference with these variables was useful.
“The value of a stable research platform was never in doubt,” says Gaines, “but there’s a reason why no successor FLIP was built: being non-propelled, it was dependent on a support vessel to tow it and install the moorings, then recover the moorings after the mission, and the costs of these are exorbitant.
Much of the oceanographic research that FLIP came to support could be accomplished in computer labs by students.” That trend was only going one way with AI and increased computing power.
FLIP was decommissioned in 2023 and consigned to a floating scrapyard in Ensenada, Mexico.
This is where the story itself flips.
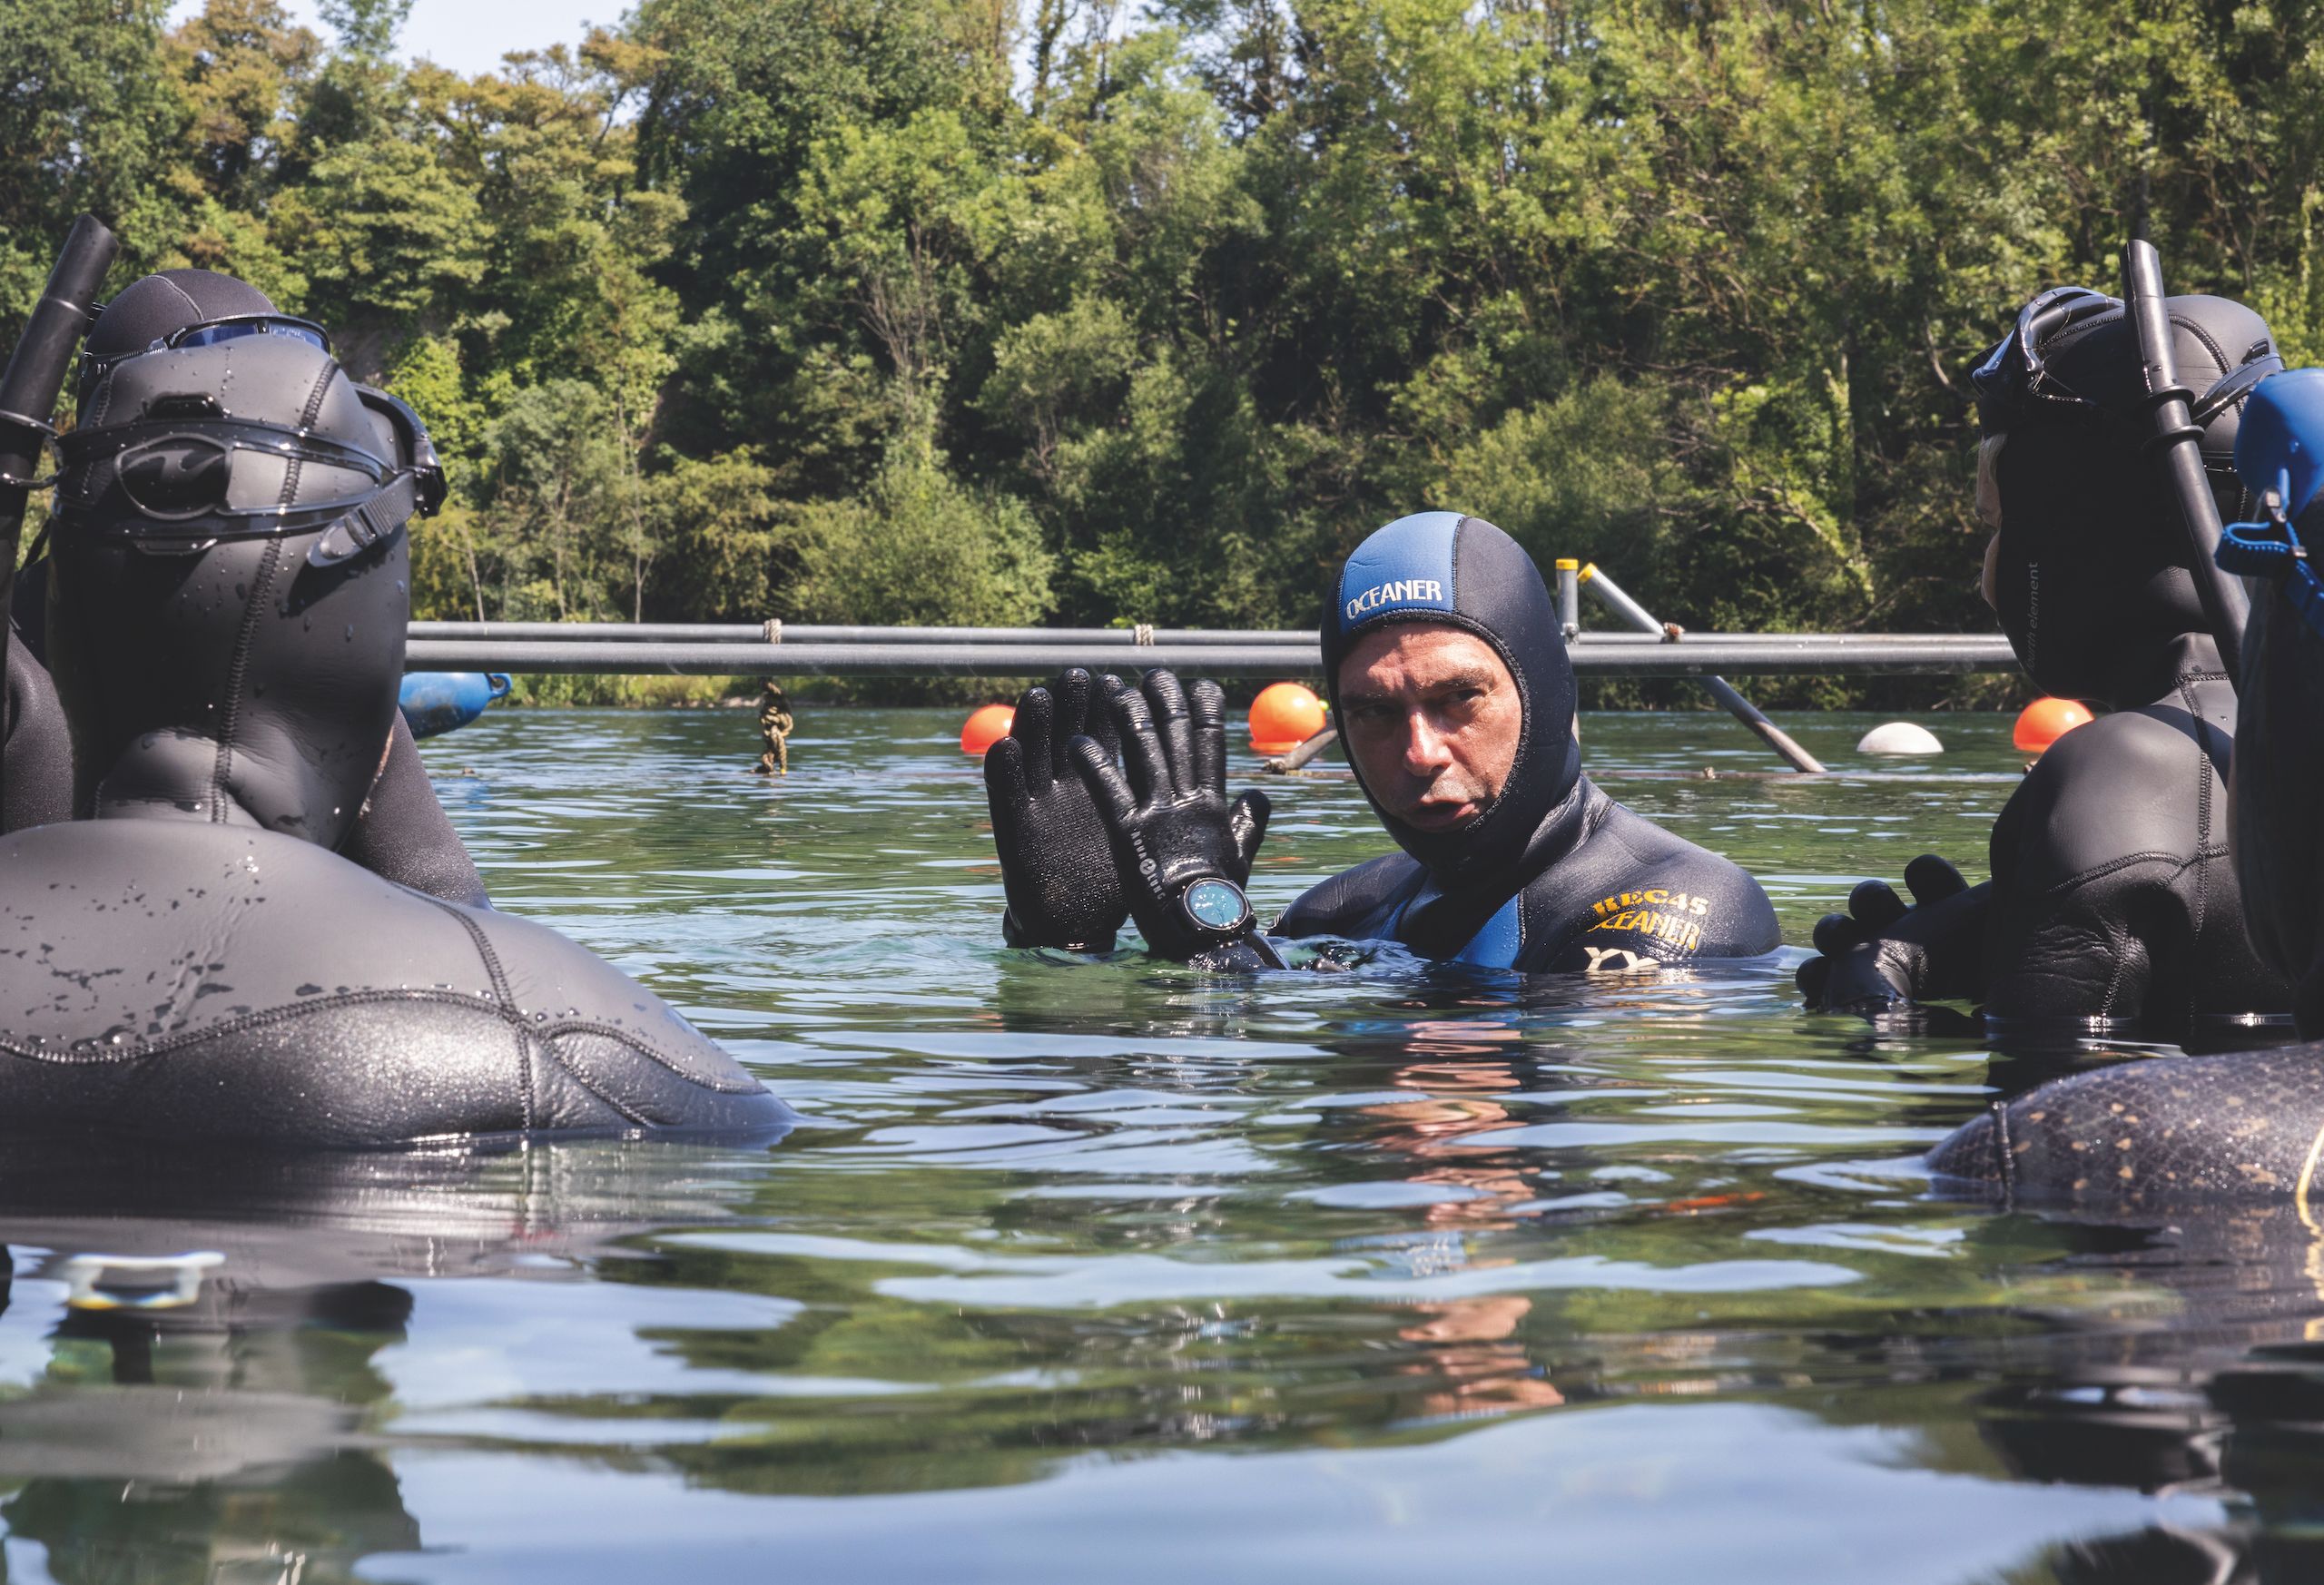
Monitoring FLIP from afar was DEEP, a UK-based company seeking to create undersea habitats akin to the International Space Station – only, for “aquanauts” at the bottom of ocean.
DEEP had in fact envisaged creating its own giant spar buoy, inspired by FLIP and featuring a deep airlock for divers.
It now picked up FLIP for a fraction of the inflation-adjusted, 1962 construction cost.
Added to that cost, though, was the expense of craning the 700-tonne behemoth onto a heavy lift vessel, piloting it through the Panama Canal and crossing the Atlantic to MB92’s yard in France, where FLIP is now being renovated – with a budget surely running into the tens of millions.
The new FLIP will have big windows, fuel cells that can provide fully renewable energy, plus more room for scientific equipment, which may include autonomous undersea vehicles.
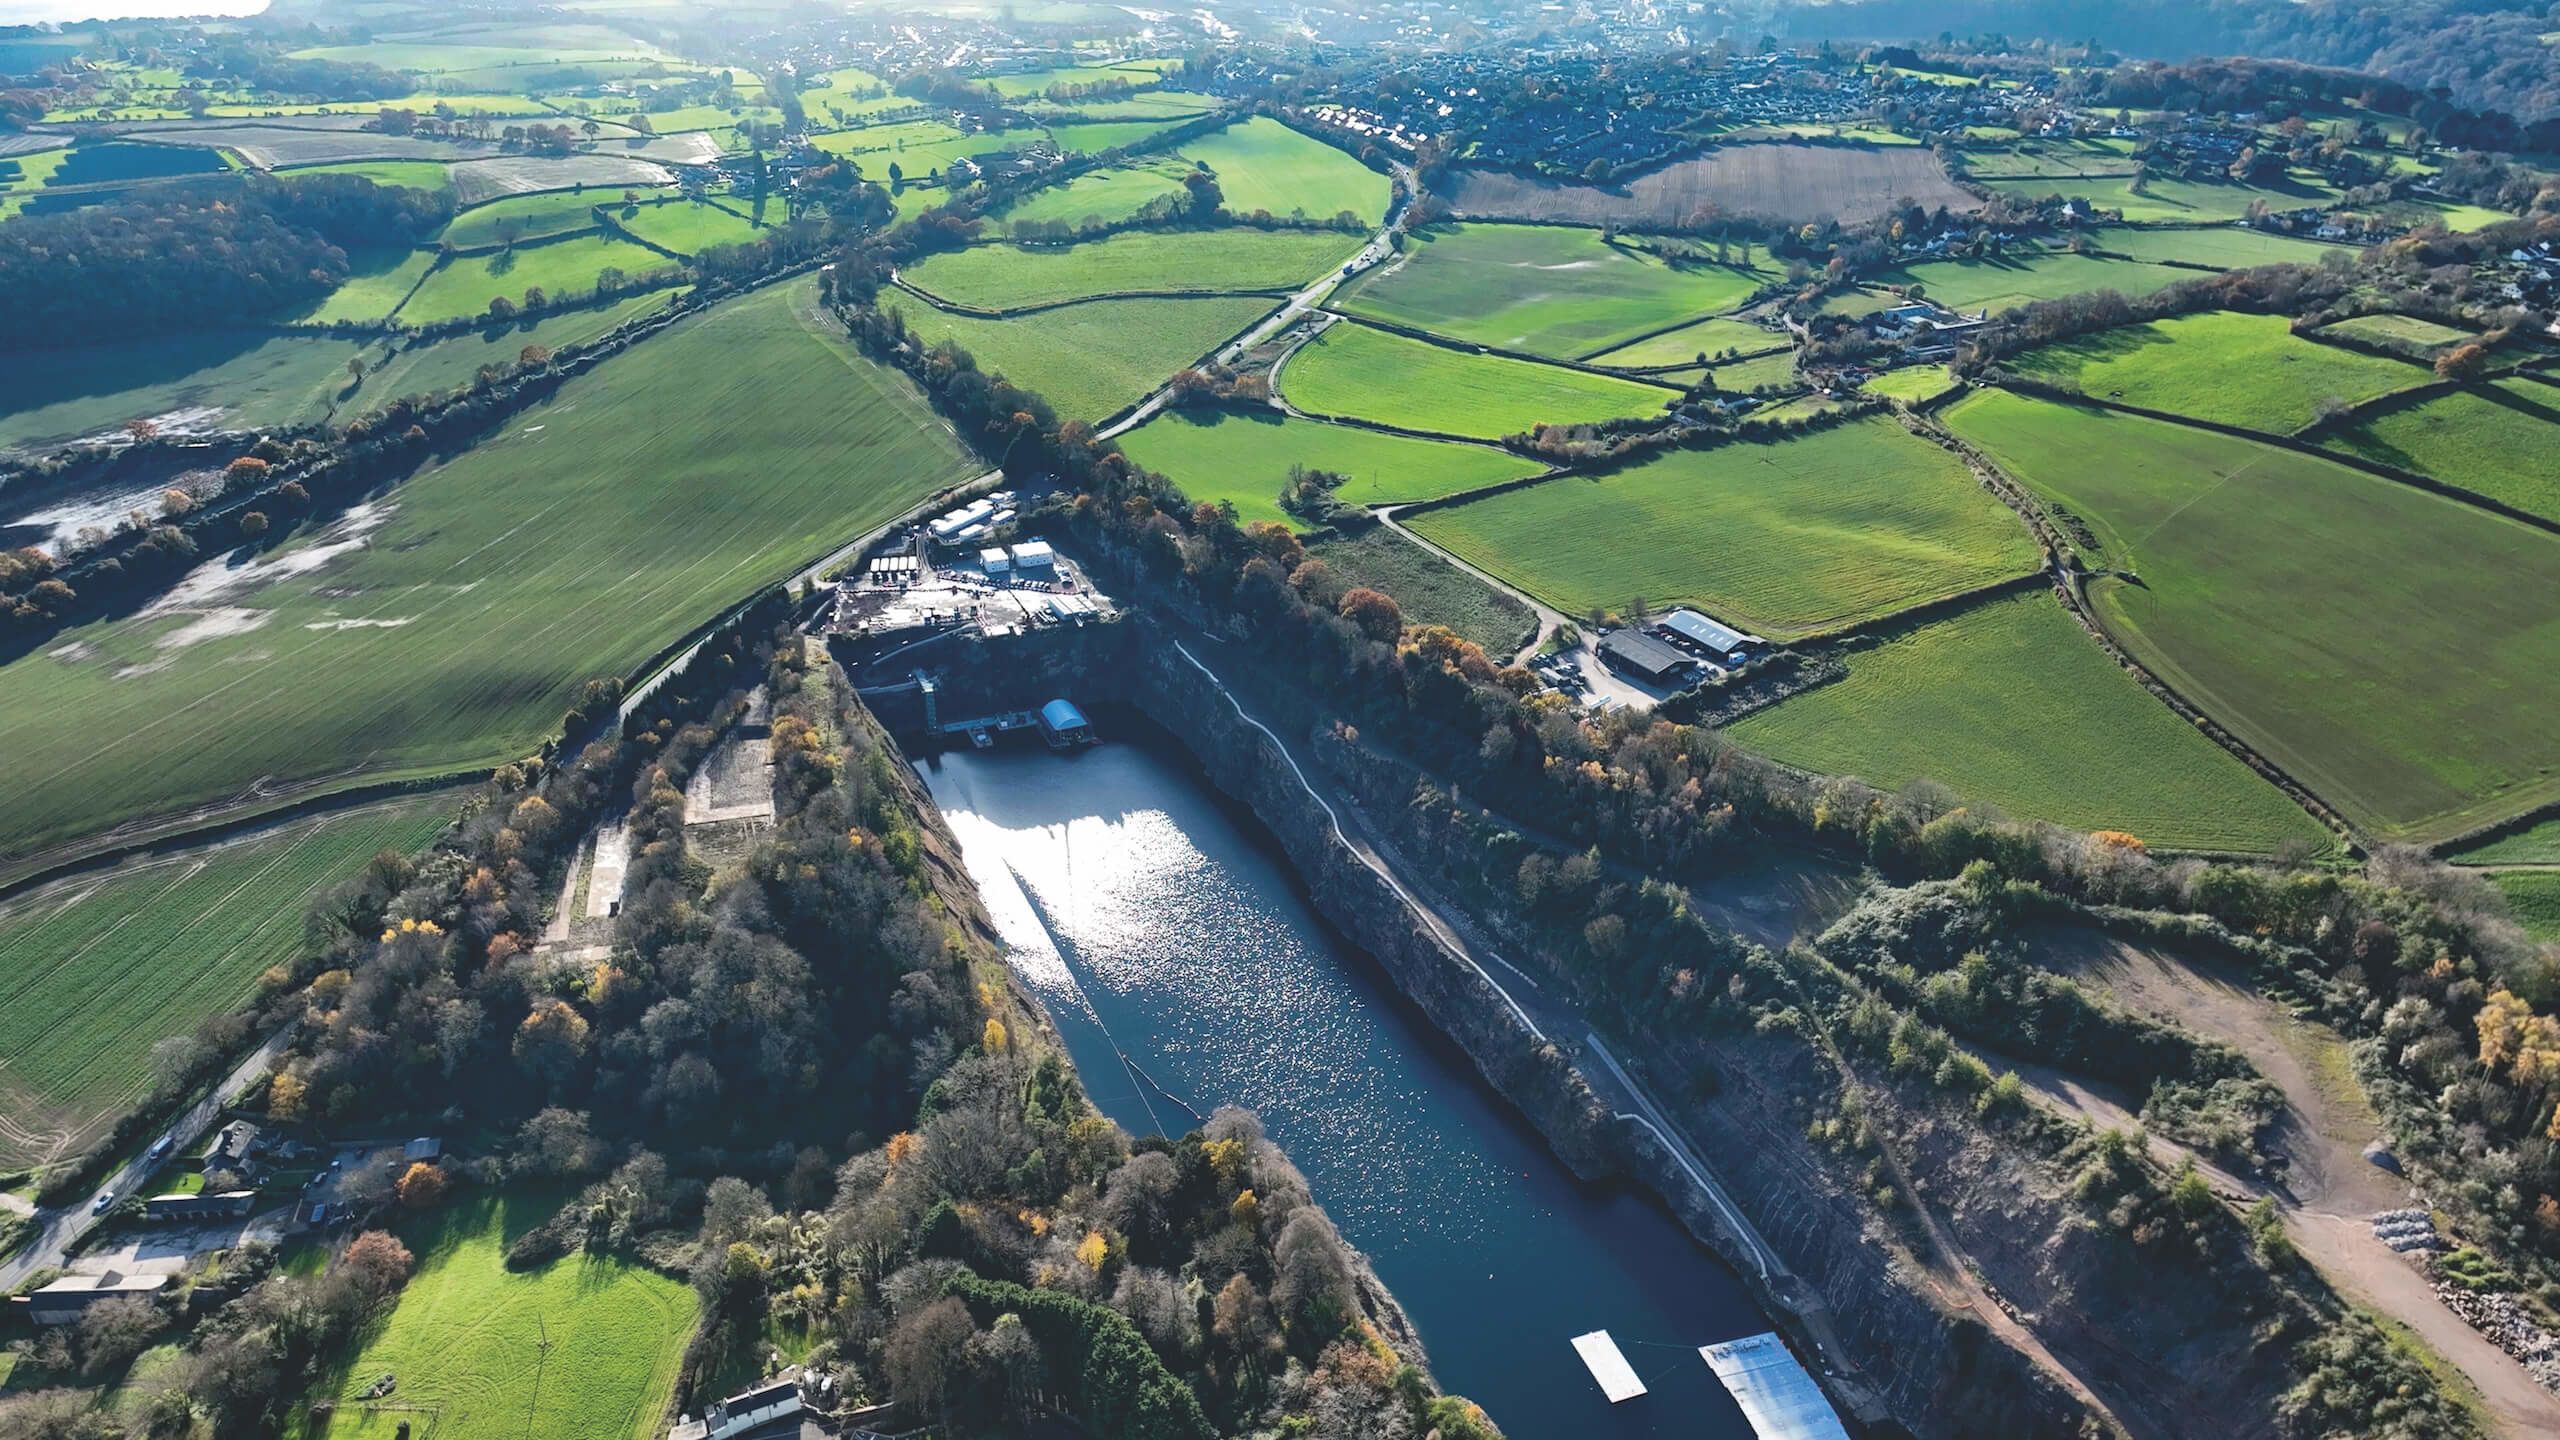
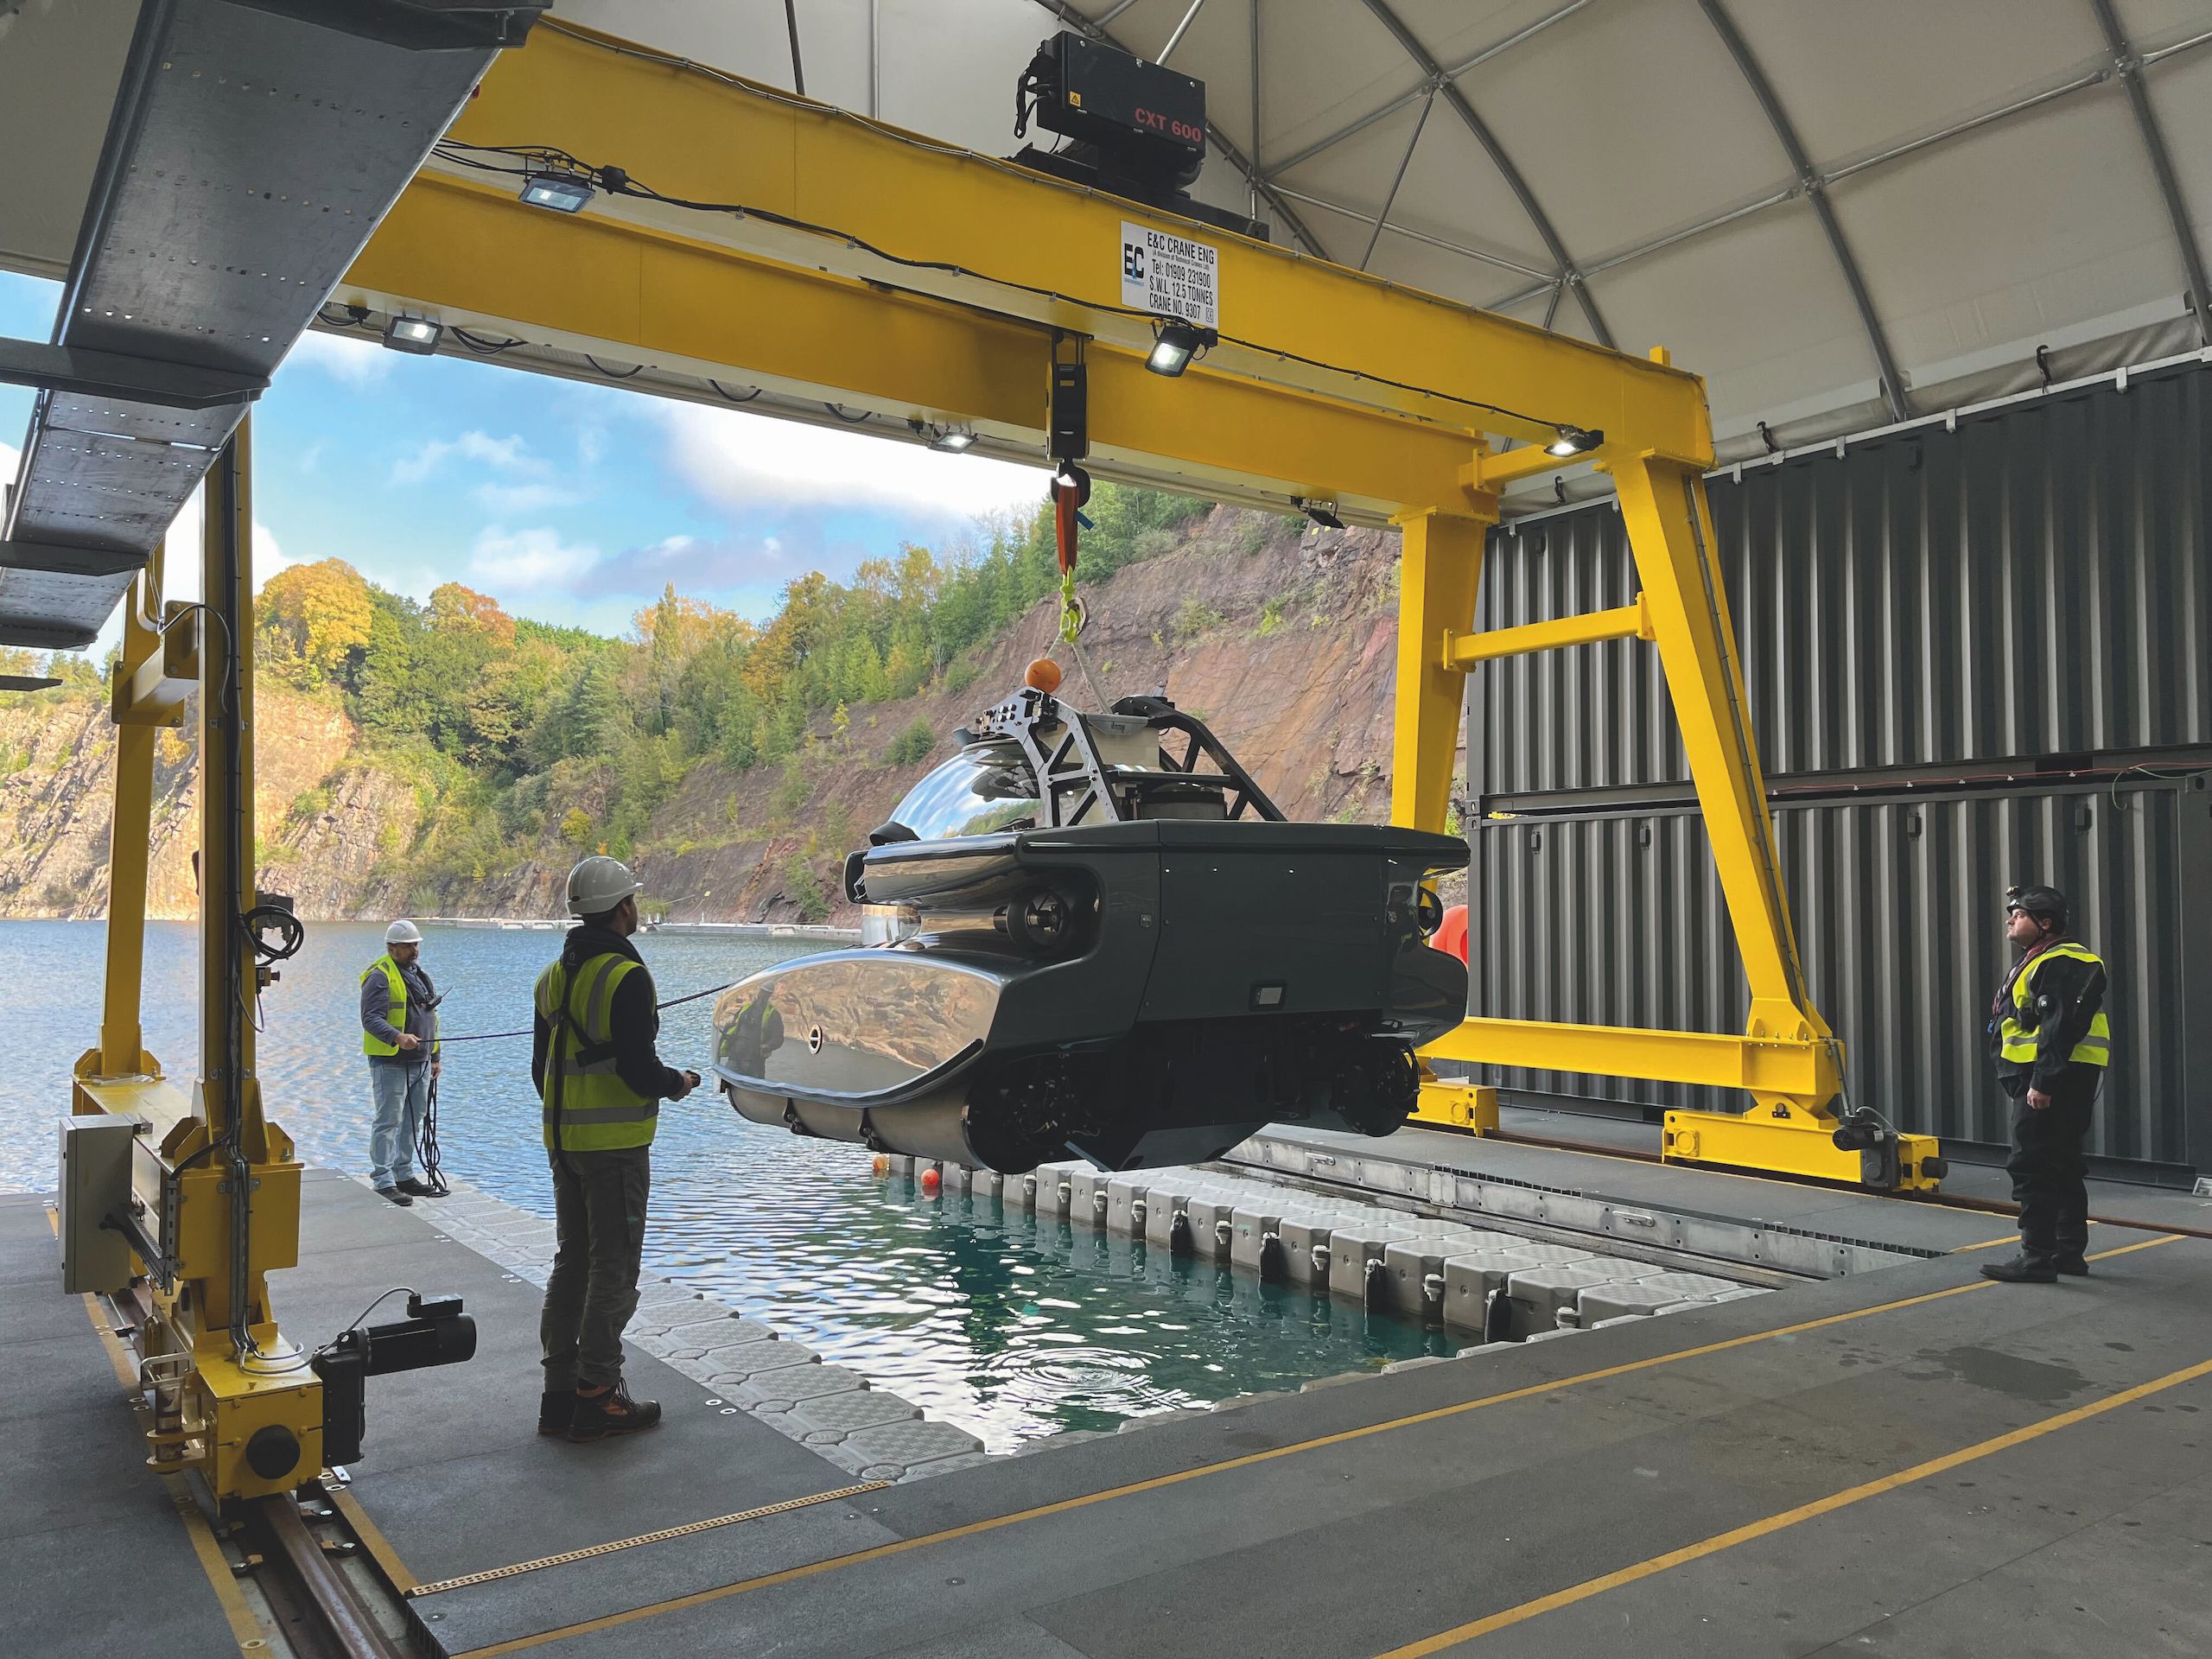
All this comes on top of the cost of DEEP’s other initiatives supporting undersea habitats, said to have reached £100 million, including the expense of a deep water testing facility on the English/Welsh border.
Who is writing the cheques, and what do they expect of an investment return? DEEP will not reveal this, but last November, Science magazine reported that an “unnamed North American tech entrepreneur” is serving as DEEP’s primary supporter and sole shareholder.
Sentiem, a London-based, self-styled venture builder and investor, may be managing this shareholding – at least, DEEP is a Sentiem “portfolio company”.
Sentiem’s website sets out (at the time of writing) how its “Ocean Technology and Exploration theme seeks to advance our understanding of one of Earth’s most abundant yet inaccessible resources.”
In case this is misinterpreted as a tilt towards undersea mining, DEEP is categorical that mineral extraction would be inconsistent with its values.
Rather, it highlights FLIP’s research capabilities, inviting feedback on which scientific purposes it should now be used for, which suggests that the FLIP for-hire business model of Gaines’ day will resume.
Or perhaps the real role will be closer to its Cold War origins: stealth programmes counteracting extinction risks.
Could the more realistic refuge in an extinction event lie not on Mars but rather under our seas? Sentiem speaks of “generational time frames”; meanwhile, the urgency of DEEP’s mission has FLIP relaunching as early as 2026.
R/P FLIP may be uniquely placed to help mitigate risks to us all yet.
Gaines has been impressed by DEEP’s team.
Above all, he’s relieved that his former charge, which he likens to a delinquent child, is being upcycled rather than “recycled into disposable razor blades”.
Keep a weather eye on which direction this one-off platform takes next.
Fingers crossed it will be back in action (but not too much action) before long.
Links :