Saturday, December 15, 2012

Vendee Globe : Cape Leeuwin

Saturday 15th 04:00 UTC situation : the two leaders François Gabart and Armel Le Cléac'h
passed the longitude of SW Australia’s Cape Leeuwin,  the second of the course’s three Great Capes,
34 days 10h and 23 minutes after the departure, so 2 days 2h and 25 min better than 2004 best time


>>> geolocalization with the Marine GeoGarage <<<

Cape Leeuwin is the most south-westerly mainland point of the Australian Continent, in the state of Western Australia.

In Australia, the Cape is considered the point where the Indian Ocean meets the Southern Ocean.

Map of Australia (1863), showing the Southern Ocean lying immediately to the south of Australia.
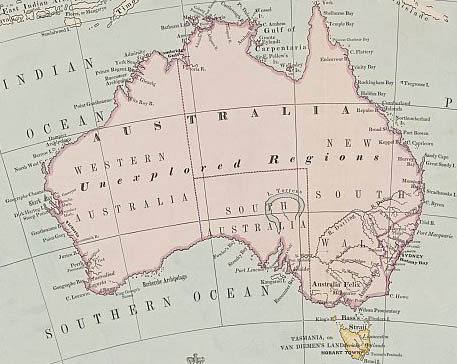
cropped from Australasia map (National Library of Australia)

 Image showing detail of the National Library of Australia's copy of Hessel Gerritsz' 1627 map of the west coast of Australia
entitled "Caert van't Landt van d'Eendracht".
This detail shows a section of coastline discovered by the Leeuwin in 1622,
and subsequently referred to by the Dutch as 't Landt van de Leeuwin ("The Land of the Leeuwin")

The Royal Australian Navy's Leeuwin class survey vessel HMAS Leeuwin is named after the cape, which is named after the ship the Leeuwin, a Dutch galleon that charted some of the nearby coastline in 1622.
The south-west corner of Australia was subsequently referred to by the Dutch as 't Landt van de Leeuwin ("The Land of the Leeuwin") for a time, subsequently shortened to "Leeuwin's Land" by the English.
This name Leeuwin still survives in the name of Cape Leeuwin, the most south-westerly point of the Australian mainland, so named by Matthew Flinders a distinguished navigator and cartographer, who was the first to circumnavigate Australia and identify it as a continent in December 1801.

Where the Indian and Southern Oceans meet, stands Cape Leeuwin Lighthouse as a solitary sentinel.
First lit in 1896 with a range of 26 nautical miles and flashing every 7.5 seconds for .02 of a second.

Image of the week : Galešnak heart-shaped island

photo CNES

>>> geolocalization with the Marine GeoGarage <<<
 HHI nautical map (MK-14 Biograd / 1:100,000)

HHI map

Galešnak (also called Island of Love, Lover's Island, Otok za Zaljubljene) is located in the Pašman channel of the Adriatic, between the islands of Pašman and the town of Turanj on mainland Croatia.

The small heart-shaped island of Galešnjak is featured in this image acquired on 19 March 2010 by ALOS. The 500 m-wide island is situated off the Croatian coast in the Adriatic Sea, between the city of Turanj (visible in white stretching along Croatia’s mainland coast) and the Island of Pasman (bottom left).
Other visible islands include (left to right): Garmenjak (bottom), Mala Bisaga, Vela Bisaga, Ricul and Komornik.

It is one of the worlds few naturally occurring heart-shaped objects.

Friday, December 14, 2012

Chasing Ice movie reveals largest iceberg break-up ever filmed


We’ve already written about photographer James Balog’s documentary film Chasing Ice in the past.
His team spent years shooting time-lapse photographs of glaciers around the world using solar-powered Nikon DSLRs, which allows changes over a long period of time to be seen in just seconds or minutes.

One particular scene in the movie shows an epic event: the largest iceberg breakup ever caught on camera.
Here’s what the team says about the 75-minute event, which is known as ice calving:
Pieces of ice were shooting up out of the ocean 600ft and then falling.

The only way that you can really try to put it into scale with human reference is if you imagine Manhattan, and all of a sudden all of those buildings just start to rumble and quake and peel off and fall over and roll around.
This whole massive city just breaking part in front of your eyes.

Links :
  • ABCNews : 'Chasing Ice': Time-Lapse cameras capture rapidly melting glacier
  • YouTube : 'Chasing Ice' official trailer

Thursday, December 13, 2012

Online maps switch to 'Algeciras Bay'


 Bing Maps (Yahoo Maps / Nokia)

From Gibraltar Chronicle

Spain has long referred to the Bay of Gibraltar as the Bahía de Algeciras, much to Gibraltar’s annoyance.


But now, in a move that will spark a furious response here in Gibraltar, Madrid appears to have won influential international support for the Spanish version of the name.

Google Earth view
Note : not any label on Google Maps

Two major online map services, Google Earth and Bing maps, have labelled the Bay of Gibraltar as Bahía de Algeciras in their latest updates.

In a similar development, the latest version of the Encyclopaedia Britannica also refers to the bay as the Bay of Algeciras, even though historical editions named it as Gibraltar Bay.

It is not clear why all three outlets have chosen to opt for the Spanish name, but the decision comes at a time when Spain is pushing hard to exert influence and jurisdiction in Gibraltar waters.

The Spanish Government has long referred to the bay as Bahía de Algeciras, in part because of its assertion that the waters around the Rock are Spanish and not British.

Plano geométrico de la bahía de Algeciras y Gibraltar.
Levantado por el Brigadier de la Real Armada Vicente Tofiño de San Miguel.
Director de las Academias de Guardias Marinas. Año 1786.


But admiralty charts and nautical maps used worldwide refer to the bay by its English name.


UKHO & IHM Spain nautical map
>>> geolocalization with the Marine GeoGarage <<<

NGA 52043 chart (1998) Bay of Gibraltar

 but 'Bahia of Algeciras' is still there in some international nautical chart (INT 3152 / ES 445A )
see SHOM #7026 (2009)

so the job for the online mapping service leaders is not simple...

The bizarre amphibious vehicle inventor claims is driven by perpetual motion


MSV Explorer semi submersible delivery mechanism
Inventor builds amphibious vehicle that will be powered 'by self-sustaining energy' to prove that perpetual motion IS possible
Chris Garner has released prototype of his first amphibious vehicle

From DailyMail

Chris Garner has released prototype of his first amphibious vehicle
He claims it is powered by what describes 'Gyro Generator' technology that he says will revolutionise the way we travel

He came up with the idea for his range of personal marines after a close encounter with a large shark.
But now concept designer Chris Garner is also preparing for coming face-to-face with predators on land - with his first attempt at an amphibious craft.
But he claims that is not the remarkable aspect of his new Explorer MSV.
Mr Garner claims to have found a solution to the age-old puzzle of perpetual motion and is now poised to go public with his scientific breakthrough.

Amphibian ambition: The vessel works both in the water and on land
Amphibian ambition: The vessel works both in the water and on land - using a mechanism to keep it in perpetual motion

Dive and drive: Chris Garner shows off his prototype which will be powered by his new 'Gyro Generator'

He believes his new 'Gyro Generator' technology will revolutionise the way in which we travel and enable electric vehicles to run indefinitely with no requirement to stop and recharge at regular intervals.
His company's website describes the current submarine version 'as an electrically powered, dual joystick controlled, dry cockpit surface water craft, meticulously designed and engineered to place two observers within an acrylic cockpit below the surface of the ocean at a constant 1.2m, with a topside principal pilot seat.'


The Discovery Channel Canada recently aired a documentary featuring a tracked, amphibious prototype of the Explorer and is keeping a close eye on recent developments.
They are also hoping to return and showcase Garner's latest model using what the inventor prefers to describe as 'self-sustaining energy'.
The technology itself will be put to the test in the next two weeks by academics from the University of Plymouth.
Then we can decide if his theories hold water.

Emerging technology: Chris Garner hopes to revolutionise the way vehicles are powered

NZ Linz update in the Marine GeoGarage

7 charts have been updated in the Marine GeoGarage
(Linz November published 6 December 2012 updates) 

      Today NZ Linz charts (178 charts / 340 including sub-charts) are displayed in the Marine GeoGarage.

      Note :  LINZ produces official nautical charts to aid safe navigation in New    Zealand waters and certain areas of Antarctica and the South-West    Pacific.


      Using charts safely involves keeping them up-to-date using Notices to Mariners

      Wednesday, December 12, 2012

      Evidence Noah's Biblical Flood happened, says Robert Ballard

      This ark, located an hour south of Amsterdam, is a replica of Noah's Biblical boat.
      Underwater archaeologist Robert Ballard is in Turkey, looking for evidence that the Great Flood happened.

      From ABC

      The story of Noah's Ark and the Great Flood is one of the most famous from the Bible, and now an acclaimed underwater archaeologist thinks he has found proof that the biblical flood was actually based on real events.


      Noah's great flood

      In an interview with Christiane Amanpour for ABC News, Robert Ballard, one of the world's best-known underwater archaeologists, talked about his findings.
      His team is probing the depths of the Black Sea off the coast of Turkey in search of traces of an ancient civilization hidden underwater since the time of Noah.

      Ballard's track record for finding the impossible is well known.
      In 1985, using a robotic submersible equipped with remote-controlled cameras, Ballard and his crew hunted down the world's most famous shipwreck, the Titanic.
      Now Ballard is using even more advanced robotic technology to travel farther back in time.
      He is on a marine archeological mission that might support the story of Noah.
      He said some 12,000 years ago, much of the world was covered in ice.

      "Where I live in Connecticut was ice a mile above my house, all the way back to the North Pole, about 15 million kilometers, that's a big ice cube," he said.
      "But then it started to melt. We're talking about the floods of our living history."

      The water from the melting glaciers began to rush toward the world's oceans, Ballard said, causing floods all around the world.
      "The questions is, was there a mother of all floods," Ballard said.

      According to a controversial theory proposed by two Columbia University scientists, there really was one in the Black Sea region.
      They believe that the now-salty Black Sea was once an isolated freshwater lake surrounded by farmland, until it was flooded by an enormous wall of water from the rising Mediterranean Sea.
      The force of the water was two hundred times that of Niagara Falls, sweeping away everything in its path.

      Fascinated by the idea, Ballard and his team decided to investigate.
      "We went in there to look for the flood," he said. "Not just a slow moving, advancing rise of sea level, but a really big flood that then stayed... The land that went under stayed under."

      BBC Noah's Ark

      Four hundred feet below the surface, they unearthed an ancient shoreline, proof to Ballard that a catastrophic event did happen in the Black Sea.
      By carbon dating shells found along the shoreline, Ballard said he believes they have established a timeline for that catastrophic event, which he estimates happened around 5,000 BC.
      Some experts believe this was around the time when Noah's flood could have occurred.
      "It probably was a bad day," Ballard said.
      "At some magic moment, it broke through and flooded this place violently, and a lot of real estate, 150,000 square kilometers of land, went under."

      The theory goes on to suggest that the story of this traumatic event, seared into the collective memory of the survivors, was passed down from generation to generation and eventually inspired the biblical account of Noah.
      Noah is described in the Bible as a family man, a father of three, who is about to celebrate his 600th birthday.

      "In the early chapters of Genesis, people live 800 years, 700 years, 900 years," said Rabbi Burt Visotzky, a professor of Talmud and Rabbinics at the Jewish Theological Seminary in New York. "Those are mythic numbers, those are way too big. We don't quite know what to do with that. So sometimes those large numbers, I think, also serve to reinforce the mystery of the text."

      Some of the details of the Noah story seem mythical, so many biblical scholars believe the story of Noah and the Ark was inspired by the legendary flood stories of nearby Mesopotamia, in particular "The Epic of Gilgamesh."
      These ancient narratives were already being passed down from one generation to the next, centuries before Noah appeared in the Bible.

      "The earlier Mesopotamian stories are very similar where the gods are sending a flood to wipe out humans," said biblical archaeologist Eric Cline.
      "There's one man they choose to survive. He builds a boat and brings on animals and lands on a mountain and lives happily ever after? I would argue that it's the same story."

      Catastrophic events of this kind are not unique to the Bible.
      Some contemporary examples include the 2004 tsunami that wiped out villages on the coasts of 11 countries surrounding the Indian Ocean.
      There was also Hurricane Katrina, described as the worst hurricane in United States history.

      Scholars aren't sure if the biblical flood was larger or smaller than these modern day disasters, but they do think the experiences of people in ancient times were similar to our own.

      "If you witness a terrible natural disaster, yes, you want a scientific explanation why this has happened," said Karen Armstrong, author of "A History of God."
      "But you also need to something that will help you to assuage your grief and anguish and rage. And it is here that myth helps us through that."

      Regardless of whether the details of the Noah story are historically accurate, Armstrong believes this story and all the Biblical stories are telling us "about our predicament in the world now."


      Dr Robert Ballard Black Sea Research (II / III)

      Back in the Black Sea, Ballard said he is aware that not everyone agrees with his conclusions about the time and size of the flood, but he's confident he's on the path to finding something from the biblical period.
      "We started finding structures that looked like they were man-made structures," Ballard said.
      "That's where we are focusing our attention right now."

      At first Ballard's team found piles of ancient pottery, but then they made an even more important discovery.
      Last year, Ballard discovered a vessel and one of its crew members in the Black Sea.
      "That is a perfectly preserved ancient shipwreck in all its wood, looks like a lumber yard," he said.
      "But if you look closely, you will see the femur bone and actually a molar."

      The shipwreck was in surprisingly good condition, preserved because the Black Sea has almost no oxygen in it, which slows down the process of decay, but it does not date back as far as the story of Noah.
      "The oldest shipwreck that we have discovered so far of that area is around 500 BC, classical period," Ballard said. "But the question is you just keep searching. It's a matter of statistics."

      Still, Ballard said the find gives him hope that he will discover something older "because there, in fact, the deep sea is the largest museum on Earth," he said.

      Ballard does not think he will ever find Noah's Ark, but he does think he may find evidence of a people whose entire world was washed away about 7,000 years ago.
      He and his team said they plan to return to Turkey next summer.
      "It's foolish to think you will ever find a ship," Ballard said, referring to the Ark.
      "But can you find people who were li
      ving? Can you find their villages that are underwater now? And the answer is yes."

      Links :


      Tuesday, December 11, 2012

      Vendee Globe : crossing Amsterdam and Kerguelen islands longitude

      Positions 11/12/2012 09:00 UTC

      Indian ocean islands overview
      >>> geolocalization with the Marine GeoGarage <<<

      >>> geolocalization with the Marine GeoGarage <<<


      Kerguelen island also called 'the islands of desolation'
      >>> geolocalization with the Marine GeoGarage <<<

      Cheminées Poujoulat (the previous boat of Bernard Stamm) at the Vendee Globe 2008
      was forced to run aground onto the rocks at the Kerguelen Islands
      (photo Taaf, Thibault Vergoz)

      >>> geolocalization with the Marine GeoGarage <<<

       The spectacular caldera (crater lake) on Saint Paul island (other picture

      >>> geolocalization with the Marine GeoGarage <<<

       Amsterdam island
      land of the Amsterdam albatross, the rarest albatross in the world.

      Canada CHS update in the Marine GeoGarage


      84 charts have been updated (December 7, 2012) :
        • 1226 ANCHORAGES AND HARBOURS INSTALLATIONS
        • 1310 PORT DE MONTREAL
        • 1316 PORT DE QUEBEC
        • 1434 CROIL ISLANDS TO CARDINAL B-C
        • 1510A LAC DES DEUX MONTAGNES
        • 1510B LAC DES DEUX MONTAGNES
        • 2123 PELEE PASSAGE TO LA DETROIT RIVER
        • 2218 PENETANG HARBOUR
        • 2241 PORT SEVERN TO CHRISTIAN ISLAND
        • 2250 BRUCE MINES TO SUGAR ISLAND
        • 3002 QUEEN CHARLOTTE SOUND TO / DIXON ENTRANCE
        • 3052A OKANAGAN LAKE - PENTICTON TO KELOWNA A - B
        • 3052B OKANAGAN LAKE - KELOWNA TO VERNON B - C
        • 3440 RACE ROCKS TO D'ARCY ISLAND
        • 3461 JUAN DE FUCA STRAIT EASTERN PORTION
        • 3514 JERVIS INLET
        • 3527 BAYNES SOUND
        • 3534 PLANS - HOWE SOUND
        • 3606 JUAN DE FUCA STRAIT
        • 3724 CAAMANO SOUND AND APPROACHES
        • 3726 LAREDO SOUND AND APPROACHES
        • 3737 LAREDO CHANNEL - INCLUDING LAREDO INLET AND SURF INLET
        • 3744 QUEEN CHARLOTTE SOUND
        • 3808 JUAN PEREZ SOUND
        • 3853 CAPE ST.JAMES TO CUMSHEWA INLET AND TASU SOUND
        • 3854 TASU SOUND TO PORT LOUIS
        • 3864 GOWGAIA BAY
        • 3902 HECATE STRAIT
        • 3938 QUEENS SOUND TO SEAFORTH CHANNEL
        • 3955 PLANS PRINCE RUPERT HARBOUR
        • 3959 HUDSON BAY PASSAGE
        • 3960 APPROACHES TO/APPROCHES PORTLAND INLET
        • 3963 WORK CHANNEL
        • 4001 GULF OF MAINE TO STRAIT OF BELLE ISLE
        • 4013 HALIFAX TO SYDNEY
        • 4015 SYDNEY TO SAINT-PIERRE
        • 4022 CABOT STRAIT AND APPROACHES
        • 4023 NORTHUMBERLAND STRAIT
        • 4026 HAVRE-SAINT-PIERRE AND CAP DES ROSIERS TO POINTE DES MONTS
        • 4116 APPROACHES TO SAINT JOHN
        • 4124 LETETE PASSAGE LETANG HARBOUR AND BLACKS HARBOUR
        • 4141A SAINT JOHN TO EVANDALE
        • 4141B GRAND BAY TO EVANDALE INCLUDING BELLEISLE BAY
        • 4233 CAPE CANSO TOCOUNTRY ISLAND
        • 4244 WEDGEPORT AND VICINITY
        • 4266 SYDNEY HARBOUR
        • 4277 GREAT BRAS D'OR / ST. ANDREWS AND ST. ANNS BAY
        • 4281 CANSO HARBOUR AND APPROACHES
        • 4302 STRAIT OF CANSO
        • 4306 CANCELLED
        • 4307 CANSO HARBOUR TO STRAIT OF CANSO
        • 4308 ST. PETERS BAY TO STRAIT OF CANSO
        • 4328 LUNENBURG BAY
        • 4335 STRAIT OF CANSO AND APPROACHES
        • 4367 FLINT ISLAND TO CAPE SMOKEY
        • 4384 PEARL ISLAND TO CAPE LA HAVE
        • 4386 ST MARGARET'S BAY
        • 4406 TRYON SHOALS TO CAPE EGMONT
        • 4425 HARBOURS ON THE NORTH SHORE
        • 4448 PORT HOOD
        • 4468 ILE DU PETIT MECATINA TO ILES SAINTE-MARIE
        • 4470 BLANC-SABLON TO MIDDLE-BAY
        • 4474 ILES BUN TO BAIE DES MOUTONS
        • 4486 CHALEUR BAY
        • 4498 PUGWASH HARBOUR AND APPROACHES
        • 4593 SUNDAY COVE ISLAND TO THIMBLE TICKLES
        • 4639 GARIA BAY AND LE MOINE BAY
        • 4668 ANCHORAGES IN THE STRAIT OF BELLE ISLE
        • 4821 WHITE BAY AND NOTRE DAME BAY
        • 4822 CAPE ST JOHN TO ST ANTHONY
        • 4823 CAPE RAY TO GARIA BAY
        • 4824 GARIA BAY TO BURGEO
        • 4830 GREAT BAY DE L'EAU AND APPROACHES
        • 4832 FORTUNE BAY - SOUTHERN PORTION
        • 4864 BACK ISLAND TO LITTLE DENIER ISLAND
        • 4913 CARAQUET HARBOUR BAIE DE SHIPPEGAN AND MISCOU HARBOUR
        • 4920 PLANS CHALEUR BAY - SOUTH SHORE
        • 4921 PLANS CHALEUR BAY - NORTH SHORE
        • 4955 HAVRE-AUX-MAISONS
        • 4956 CAP-AUX-MEULES
        • 5505 BELANGER ISLAND TO COTTER ISLAND
        • 6021A LAKE MUSKOKA - 1
        • 6021B LAKE MUSKOKA - 2
        • 7122 CULBERTSON ISLAND TO KOOJESSE INLET
        • 7736 SIMPSON STRAIT
        So 688 charts (1658 including sub-charts) are available in the Canada CHS layer. (see coverage)

        Note : don't forget to visit 'Notices to Mariners' published monthly and available from the Canadian Coast Guard both online or through a free hardcopy subscription service.
        This essential publication provides the latest information on changes to the aids to navigation system, as well as updates from CHS regarding CHS charts and publications.
        See also written Notices to Shipping and Navarea warnings : NOTSHIP

        Stemming the rise of a sea of noise

        Maps show noise levels at a depth of 50 feet and a standard reference sound pressure of 1 micropascal.
        Sources: NOAA Underwater Sound Field Mapping Working Group; HLS Research; NCEAS

        From NYTimes

        When a hurricane forced the Nautilus to dive in Jules Verne’s “Twenty Thousand Leagues Under the Sea,” Captain Nemo took the submarine down to a depth of 25 fathoms, or 150 feet.
        There, to the amazement of the novel’s protagonist, Prof. Pierre Aronnax, no whisper of the howling turmoil could be heard.
        “What quiet, what silence, what peace!” he exclaimed.
        That was 1870.

        Today — to the dismay of whale lovers and friends of marine mammals, if not divers and submarine captains — the ocean depths have become a noisy place.

        The causes are human: the sonar blasts of military exercises, the booms from air guns used in oil and gas exploration, and the whine from fleets of commercial ships that relentlessly crisscross the global seas.
        Nature has its own undersea noises.
        But the new ones are loud and ubiquitous.

        A rare and endangered blue whale offshore near Long Beach, Calif.
        Dave McNew/Getty Images

        Marine experts say the rising clamor is particularly dangerous to whales, which depend on their acute hearing to locate food and one another.

        To fight the din, the federal government is completing the first phase of what could become one of the world’s largest efforts to curb the noise pollution and return the sprawling ecosystem to a quieter state.

        It is no small ambition: the sea covers more than 70 percent of the planet’s surface.
        But scores of the ocean visualizations have now been made public.

        The federal effort seeks to document human-made noises in the ocean and transform the results into the world’s first large sound maps.
        The ocean visualizations use bright colors to symbolize the sounds radiating out through the oceanic depths, frequently over distances of hundreds of miles.
        Several of the larger maps present the sound data in annual averages — demonstrating how ages in which humans made virtually no contribution to ocean noise are giving way to civilization’s roar.

        The overall purpose is to better understand the cacophony’s nature and its impact on sea mammals as a way to build the case for reductions.

        “It’s a first step,” Leila T. Hatch, a marine biologist and one of the project’s two directors, said of the sound maps. “No one’s ever done it on this scale.”

        The National Oceanic and Atmospheric Administration began the effort in 2010 at the behest of Jane Lubchenco, a prominent marine biologist who is the first woman to head the agency. Dr. Hatch and her colleagues assembled a team of sound experts, including HLS Research, a consulting firm in La Jolla, Calif. This summer, they unveiled their results on the Web, as did a separate team of specialists that sought to map the whereabouts of populations of whales, dolphins and porpoises.

        Michael Jasny, a senior policy analyst with the Natural Resources Defense Council, a private group in New York that has sued the Navy to reduce sounds that can harm marine mammals, praised the maps as “magnificent” and their depictions of sound pollution as “incredibly disturbing.”

        “We’ve been blind to it,” Mr. Jasny said in an interview.
        “The maps are enabling scientists, regulators and the public to visualize the problem. Once you see the pictures, the serious risk that ocean noise poses to the very fabric of marine life becomes impossible to ignore.”

        Legal experts say the new findings are likely to accelerate efforts both domestically and internationally to deal with the complicated problem through laws, regulations, treaties and voluntary noise reductions.

        The government already has some authority to regulate oceanic sound in United States waters through the Endangered Species Act and the Marine Mammal Protection Act, though exemptions to these laws exist for the military.

        The International Maritime Organization, a United Nations body responsible for improving marine safety and reducing ship pollution, also has the authority to set acoustic standards.
        In the past few years, encouraged by the United States, it began discussing how to achieve voluntary noise reductions.

        Since many commercial vessels are registered abroad, and most shipping noises arise in international waters, the organization’s backing is seen as crucial for reductions to be substantial enough to have global repercussions.

        “Right now we’re talking about nonbinding guidelines,” said Michael Bahtiarian, an adviser to the United States delegation to the maritime organization and a senior official at Noise Control Engineering, a company outside Boston that specializes in reducing ship noise and vibrations.
        “At a minimum, the goal is to stop the increases.”

        The oceanic roar originates because of the remarkable — and highly selective — way in which different kinds of waves propagate through seawater.
        While sunlight can penetrate no more than a few hundred feet, sound waves can travel for hundreds of miles before diminishing to nothingness.

        Sea mammals evolved sharp hearing to take advantage of sound’s reach and to compensate for poor visibility.
        The heads of whales and dolphins are mazes of resonant chambers and acoustic lenses that give the animals not only extraordinary hearing but complex voices they use to communicate.

        In recent decades, humans have added raucous clatter to the primal chorus.
        Mr. Bahtiarian noted that the noise of a typical cargo vessel could rival that of a jet.
        Even louder, he added, are air guns fired near the surface from ships used in oil and gas exploration.
        Their waves radiate downward and penetrate deep into the seabed, helping oil companies locate hidden pockets of hydrocarbons.

        Marine biologists have linked the human noises to reductions in mammalian vocalization, which suggests declines in foraging and breeding.

        Worse, the Navy estimates that blasts from its sonars — used in training and to hunt enemy submarines — result in permanent hearing losses for hundreds of sea mammals every year and temporary losses for thousands.
        All told, annually the injured animals number more than a quarter million.

        The federal sound study examined all these noises but zeroed in on commercial shipping because it represented a continuous threat, in contrast to sporadic booms.
        For North Atlantic shipping, the project drew up more than two dozen maps.
        All their scales went from red (115 decibels at the top) to orange and yellow, and then to green and blue (40 decibels at the bottom).
        The maps presented the results in terms of annual averages rather than peaks.

        A decibel is a measure of noise, and peak levels underwater can be incredibly loud.
        When monitored by a hydrophone at a distance of one meter (about three feet), a seismic gun produces 250 decibels, an oil tanker 200 decibels and a tugboat 170 decibels, according to Mr. Bahtiarian.

        To draw up its annual maps, the sound project used computers to average out such peaks over time, as well as to slowly diminish the noises as they traveled over the ocean’s vast reaches.
        The study also chose to model the low frequencies used by sea mammals for hearing and vocalization, and tracked how far the sounds penetrated.

        Maps of the North Atlantic show mostly oranges in the upper waters, but many blues appear as the readings go downward as deep as one kilometer, or six-tenths of a mile.
        At that depth, the sound maps clearly show the ability of the Mid-Atlantic Ridge — a mountain chain that runs down the ocean’s middle — to diminish the radiating noises by breaking up patterns of sound waves.

        Dr. Hatch, of the sound study, said too many areas of the ocean surface (where sea mammals and whales spend most of their time) are orange in coloration, denoting high average levels.
        “It’s like downtown Manhattan during the day, only not taking into account the ambulances and the sirens,” she said. “I’d be happier saying it was like a national park.”

        Vessels for fishing and research, including new ships being built for N.O.A.A., are already being quieted around the world.
        The trend derives not so much out of concern for sea mammals but from the realization by oceanographers that quiet ships let them do better science.

        Marine engineers say the mechanics of ship quieting are relatively straightforward if applied in the design stage.
        The biggest factor is the ship’s propeller, which has to be shaped exactly right to lessen cavitation.
        The noise arises when the force of a propeller cutting through seawater results in millions of voids and bubbles, which then collapse violently.
        Experts say quiet propellers have a benefit beyond helping sea mammals in that some kinds can reduce fuel consumption.

        Other measures for quieting include adding layers of sound-absorbing tiles to the walls of noisy rooms as well as mounting engines, pumps, air compressors, and other types of reciprocating machinery on vibration isolators.
        Mr. Bahtiarian of Noise Control Engineering, who has written extensively on the topic in professional journals and for expert committees, noted that a parallel to ship quieting had been under way in the airline industry for decades.
        City officials and airport neighbors, as well as federal officials, have prodded the manufacturers of jet engines to find ways of reducing noise.

        Experts note that the magnitude of the problem on land and sea is similar, in that the global fleets of commercial jets and ships both number in the tens of thousands.
        But designing better ships to quiet the ocean, Mr. Bahtiarian said, will take longer.
        “A ship’s lifetime is 30 or even 50 years,” he noted, “so it could be a lot longer” before improved designs start transforming the fleet.

        Still, Mr. Bahtiarian added, the quieting trend seems inevitable given the new reports about sound pollution and rising awareness about the dangers to whales, dolphins and other sea mammals.
        “The technology is there,” he said.
        “It seems like it’s just a matter of time.”

        Links :
        • BBC : Sounds of the sea: Listening online to the ocean floor
        • CNN : Turn down the volume in the ocean

        Monday, December 10, 2012

        New map reveals New Zealand’s seafloor in stunning detail

        A high quality colour poster published in november 2012at a scale of 1:5,000,000 that vividly illustrates the variability and complexity of the New Zealand ocean floor.
        Undersea New Zealand map Caption Undersea New Zealand, a high resolution image of the complex and diverse marine realm around New Zealand.
        Undersea New Zealand provides a unique insight into the shape of the seafloor within one of the world's most extensive deepwater jurisdictions.
        New Zealand straddles an active plate margin, creating a highly complex and diverse seascape of submarine trenches, underwater volcanoes, active submarine canyons and quiescent broad plateaux.
        Undersea New Zealand map Caption Undersea New Zealand, a high resolution image of the complex and diverse marine realm around New Zealand.
        Undersea New Zealand provides a unique insight into the shape of the seafloor within one of the world's most extensive deepwater jurisdictions.
        New Zealand straddles an active plate margin, creating a highly complex and diverse seascape of submarine trenches, underwater volcanoes, active submarine canyons and quiescent broad plateaux. Photo credit NIWA

        From NIWA

        NIWA's new Undersea New Zealand map provides a unique insight into the shape of the seafloor in one of the world's most extensive marine jurisdictions.

        >>> geolocalization with the Marine GeoGarage <<<

        More than 90 per cent of New Zealand's continental mass is underwater.
        We have one of the largest Exclusive Economic Zones and Extended Continental Shelf in the world - more than 570 million hectares of diverse marine environment, 21 times the size of our land mass.

         Annotated NZ 250m gridded bathymetric imagery, CANZ (2008) with either undersea feature names or (Exclusive Economic Zone) EEZ.
        An exclusive economic zone (EEZ) is a marine area prescribed by the United Nations Convention on the Law of the Sea over which a state has special rights over the exploration and use of marine resources, including energy production from water and wind.

        NIWA's ocean geologist Dr Helen Neil says, "This latest map is an asset for all New Zealanders. It's for the person walking down the street that is really fascinated by the environment they live in, and it will also help a range of sectors understand more about our extensive marine environment. It shows in never-before-seen detail the marine realm that surrounds us."
        "New Zealand sits across a plate boundary, resulting in a diverse seascape of ridges, volcanoes, plateaux, canyons and seamounts.
        "Recent technological advances mean we can now map the seabed in detail approaching that of terrestrial (land) mapping," says Dr Neil.

        The map is an updated version of the Undersea New Zealand map published in 1997.
        NIWA Data Source for Map: All data used in the compilation is held at the National Institute of Water and Atmospheric Research (NIWA).
        Bathymetry is compiled from multibeam and single-beam data sourced from surveys by NIWA and Land Information New Zealand (LINZ), as well as international surveys by vessels from United States of America, France, Germany, Australia and Japan.
        In addition, scientific community data are sourced from the National Geophysical Data Center (United States), General Bathymetric Chart of the Oceans (GEBCO_08 Grid, version 20120927) and the Australian bathymetry and topography grid (June 2009).
        Onshore representation derived from LINZ topographic and the Ministry for the Environment LCDB II digital datasets.

        This year's version has been created using the latest available scientific data, and is also viewable in 3D.


        The updated version shows the "texture" of the seafloor and has more than 20 times the resolution of the old map.
        It is generated from digital elevation models using multibeam data, combined with traditional bathymetric data that reveal many, previously hidden, features.

        RV Tangaroa’s multibeam system uses a fan of sound beams to build up a 3-D picture of the seafloor. Credit: Erika Mackay

        The new map uses some 1.5 million square kilometres of multibeam coverage, with over a third of this mapped by NIWA's research vessel Tangaroa.

        There are numerous areas on this new map showing more detailed information.
        These include the West Coast, the Bounty Trough and the Hikurangi Channels.
         The island-studded Hauraki Gulf is a backdrop to the work and play of New Zealand’s biggest city. Transport hub, commercial port, communications route, tourism venue, sailing paradise, marine park, and recreational, customary and commercial fishing ground, this shallow, sheltered sea has been many years in the making.
        The embayed coastline, estuaries and islands were shaped by volcanism, tectonic upheaval and changing sea levels.
        The seafloor of this shallow, semi-enclosed sea has a sweeping signature of sediment erosion, transport and deposition.

        These were represented as simple curves on the original map, but are now mapped in detail.
        "The new detail shows the abundance of sinuous canyons and channels that slice through the continental margin, allowing sediment from the land to flow into the deep ocean, both west and east of New Zealand.
        "The Kermadec Trench is formed by the subduction of the Pacific Plate under the Indo-Australian Plate. It runs for over a thousand kilometres and, in some places, is over 10,000 metres deep.
        It is the deepest area within New Zealand waters," says Dr Neil.
        The new map illustrates the structure in that area.
        "You can see these folded ridges of sediment, and can imagine it being scraped off as one plate goes under another," says Dr Neil.

        The dynamic seascape of Cook Strait is a recreational playground, a significant fisheries ground, a source of geological and oceanic hazards, and a challenge for engineers who manage the power and telecommunication cables that are laid on the seafloor and seek to harness the tides for future energy. For three decades marine scientists have been studying the seabed of Cook Strait to understand the processes that shape it.

        There is a lot more detail of seamounts in areas like the Havre Trough, Louisville Seamount Chain, Antipodes Islands and along Chatham Rise.

        "While seamounts can have similar shapes, detailed mapping highlights the potentially diverse nature of the habitats on these features," says Dr Neil.


        The Wellington South Coast is an exposed, rocky shoreline influenced by the strong tidal currents of Cook Strait and the large swells of the Southern Ocean.
        More than 400 million soundings were collected to survey an area of 5727 hectares.
        In August 2008 an 854 hectare portion of the South Coast was declared Taputeranga Marine Reserve.
        This survey reveals features such as the artificial reef - HMNZS Wellington, nearshore rocky outcrops, and sediment ripples formed by waves and tidal currents moving finer-grained sediments.

        The Undersea New Zealand map is a culmination of NIWA's geological, oceanographic, and fisheries research, and is created from NIWA's database of high-resolution seafloor imagery from around New Zealand.
        It also incorporates significant national and worldwide data sets.


        Maps like these produce substantial benefit for all New Zealanders and for all users of the marine environment, revealing potential for fisheries, environmental management, conservation, hazard mitigation, and energy and mineral opportunities.

        Seafloor platform 'cloaks' big ocean waves

        By creating specially “tuned” ripples on the ocean floor,
        it may be possible to convert surface waves into internal interfacial waves to “cloak”
        and shield floating objects—such as oil rigs or ships—from rough seas.

        From DiscoveryNews

        Floating offshore oil drilling platforms, offshore wind farms and buoys are vulnerable to waves, especially those from storm swells.
        But a team of engineers has found a way to make those ocean-faring structures invisible to waves.
        The technique could help protect marine structures from damage when big storms hit.
        Mohammed-Reza Alam, assistant professor of mechanical engineering at the University of California, Berkeley, have designed a rippled platform that sits on the seafloor directly below an ocean-faring structure.
        The ripples in the platform influence the the behavior of the water all the way up to the surface -- ultimately reducing the size of damaging surface waves.
        Alam calls his technique a "cloak" because it makes the ocean structure invisible to the surrounding waves.
        He presented the work November 19 at an American Physical Society conference in San Diego.

         How the cloaking works (Image: Reza Alam, UC Berkeley) : how the variation of density in ocean water can be used to cloak floating objects against incident surface waves.
        Unlike most other cloaking techniques that rely on transformation optics, this one is based on the influence of the ocean floor’s topography on the various “layers” of ocean water.

        The seafloor influences the beahavior of surface waves because of the unique structure of deep water.
        The top is heated by the sun, making the surface less dense as the heat expands it.
        Meanwhile, at the bottom, the water is cold and dense with more salt in it.
        The place where the two layers meet and where the temperature and density changes is called the thermocline.

        In that layer are "internal" waves.
        If one could pull off the top layer of ocean, the internal waves would look a lot like ordinary surface waves, except they would probably be longer (lower frequency) and taller (higher amplitude) than the ones on the surface.
        They happen because the waves on the surface are transmitting energy to the sea floor.
        Just as the energy from wind makes waves on the surface, the energy is transferred to the thermocline, where it make the internal waves.

        Meanwhile, the seafloor isn't perfectly smooth.
        The shape of it can affect the motion of deep water as it flows over it and some of that energy can get transferred all the way back to surface waves.

        Alam found that if he used a rippled sheet of material, one that had a specific set of heights and lengths, and put it on the oceanfloor, the energy from deep water would make the internal waves in the thermocline more energentic, but cancel out surface waves.
        That makes for calm water on the surface.

        Alam told Discovery News that if one were building a working version -- something several years away at least -- it would only need to face in one direction, since you only need to cancel the waves out when they are approaching.
        Waves also tend to come from one side -- they don't often go from shore to sea, for instance.

        He added that there is a lot of interest in this kind of work for another reason: underwater acoustics. Understanding how sound transmits through water is crucial for designing better sonar.
        The interface between warm and cold water can affect what a sonar system "sees" and better understanding that layer could improve sonar systems.

        Beyond building something to protect floating structures, this kind of work could also help engineers decide where to put them.
        The "cloaking" effect sometimes occurs because the seafloor isn't level; there are areas of calm water as a result.
        Putting an oil drilling platform in a place where big waves are less likely to happen at all would make the whole operation safer.

        Links :

        Sunday, December 9, 2012

        Image of the week : first Pleiades 1B image

        click on the image for hi-resolution (with zoom)

        Rade de Lorient, Brittany, France
        (hi-resolution Pléiades 1B image extracts : port / Citadelle Vauban)
        Dockyard port city at the mouth of the river Blavet and Scorff.


        >>> geolocalization with the Marine GeoGarage <<<

        On 2 December 2012, a Soyuz rocket launched the Pléiades 1B very-high-resolution optical satellite built by Astrium for the French space agency CNES from the Guiana Space Centre in French Guiana, less than a year after orbiting Pléiades 1A.

        Pléiades 1B was released from the launch vehicle at 02.57 GMT/UTnear its final 694 km orbit.
        The satellite will be phased 180° with Pléiades 1A on the same orbit to form a true constellation offering daily revisits to any point on the globe.

        This daily revisit capability brings added value to users of satellite data products around the world. Being able to generate imagery anywhere in the world every day is vital for quick-response applications.
        With the Pléiades constellation, conflict and crisis zones or natural disaster areas will be viewable within hours to aid planning of relief and rescue operations.

        Daily revisits also allow close monitoring of work progress on civil engineering projects, mining activities and industrial or military operations.
        And by bringing users twice as much imagery, the Pléiades satellites are ideal for mapping large areas at high resolution, as images are acquired twice as fast to increase the chances of obtaining cloud-free views.

        The Pléiades constellation offers users products at a resolution of 50 cm with an imaging swath of 20 km, the widest in its category.