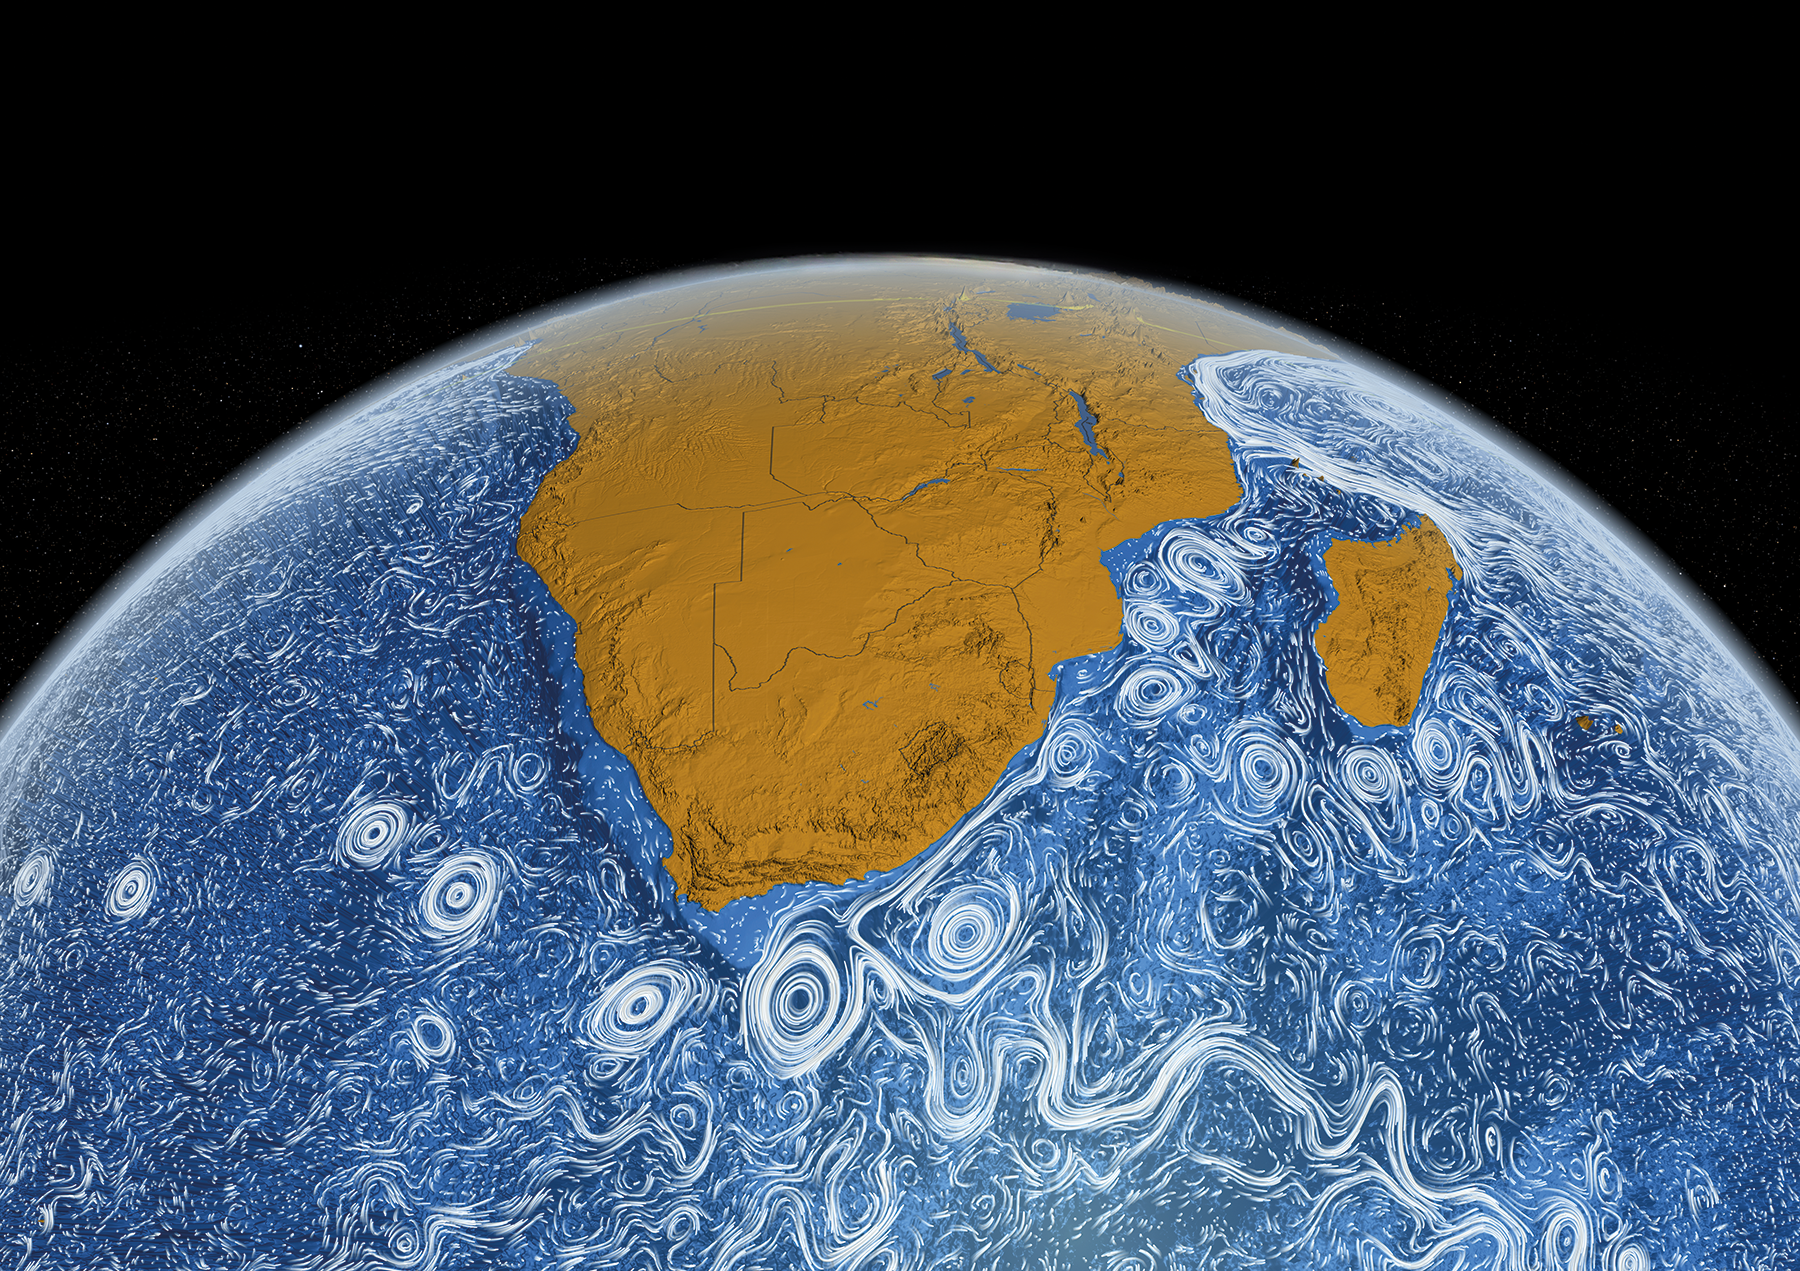
A high-resolution ocean model reveals surface current flows off the coast of South Africa.
Credit: NASA, Goddard space flight center scientific visualization studio
From Scientific American by Conor Purcell
Models of the behaviour of the oceans with higher spatial resolution could lead to more accurate climate predictions.
When news broke in March 2014 that Malaysian Airlines flight MH370 had gone missing, Jonathan Durgadoo watched in shock with the rest of us.
The Boeing 777-200ER had departed from Kuala Lumpur for Beijing, before unexpectedly turning west about halfway between Malaysia and Vietnam.
An hour-and-a-half after take-off, the plane disappeared from radar over the Andaman Sea, southwest of Thailand.
There were 239 people on board.
Some 16 months later, a piece of debris from the aircraft—a hinged flap known as a flaperon that had broken away from the wing—was found on Réunion Island in the western Indian Ocean.
Durgadoo, an ocean modeller at the GEOMAR Helmholtz Centre for Ocean Research Kiel, Germany, quickly realised he was able to contribute to the search effort.
If his team could describe the movement of water in the Indian Ocean from the time of the aircraft’s disappearance to when the debris was washed up on Réunion Island, they might be able to track its journey and lead investigators to the crash site.
“From an oceanographic perspective, the question was straightforward yet difficult to answer,” Durgadoo says.
“Could we track the flaperon back in time to establish where the plane had crashed? And if so, would that position coincide with the priority search area?”
To track the flaperon, Durgadoo’s team would need a data set of currents in the Indian Ocean during that 16-month period that had no gaps in space or time.
Observational data over such a wide area and long period of time were not available; instead, the team decided to use a high-resolution model of the ocean.
Ocean models describe the movement of water using the mathematical equations of fluid motion, calculated on powerful supercomputers.
The models divide the ocean into a grid of 3D volumetric elements, and calculate the movement of the water between cubes for each time step the researchers choose.
Durgadoo’s team opted for a model with a horizontal grid length of one-twelfth of a degree—about 9 kilometres in every direction.
“The ocean model provided us with consistent data for the entire time period, and all over the Indian Ocean,” says Durgadoo.
They then used the data to simulate virtual objects back in time from July 2015 to the aircraft’s disappearance in March 2014.
In total, Durgadoo and his team launched almost five million virtual flaperons and tracked their likely journey back from the island.
The simulation resulted in almost five million possible trajectories, but by making certain assumptions, such as that the plane could have travelled a maximum of 500 km from its last known position, the researchers were able to whittle their results down to around 800,000 possible starting points.
These points still covered thousands of square kilometres of the southeast Indian Ocean, but this was largely a different area to where the search teams were looking.
According to the models, the probability that the flaperon started its journey in the patch of ocean off southwestern Australia where crash investigators were searching was less than 1.3%.
The more likely origin of the flaperon—and therefore the crash site, assuming it broke off on impact with the water, as is generally accepted—was further north, says Durgadoo.
Durgadoo’s work to track a two-metre-long flaperon across the ocean would not have been possible without considerable advances in the spatial resolution of ocean models.
Increases in computing power over the past few decades have spurred the development of models that use tighter grids and can therefore capture the movement of the ocean at the mesoscale, on the order of 100 km or less.
At this scale, swirling, circulating currents of water can be modelled.
Ocean models with high-enough resolution to represent these eddies can account for parameters such as volumetric flow rate, temperature and salinity, and can therefore reproduce more realistic ocean behaviour than models with lower resolution.
The emergence of high-resolution ocean models raises questions about using models with a coarser resolution, particularly for climate projections into future decades and beyond.
Every climate projection is a result of simulations that use models developed by various research centres around the world.
These models seek to incorporate and couple each component of the Earth system, from the cryosphere (the planet’s ice-covered regions) and biosphere to the atmosphere and ocean.
Because the accuracy of climate projections depends on how well each component of the model represents reality, incorporating ocean models with a higher spatial resolution into climate simulations should provide a better picture of how the climate is likely to change in the coming decades (see Q&A).
But modelling at higher resolutions carries a cost and might not be the only way to improve simulations of the ocean.
Current simulations
“Climate models don’t correctly simulate many aspects of the global ocean,” says Lisa Beal, a physical oceanographer at the University of Miami in Florida.
In particular, she is interested in western boundary current systems, which are deep, narrow, fast-flowing currents on the western side of ocean basins.
These currents carry huge amounts of heat from the tropics to the poles and have a large impact on global climate.
But so far, she says, they have not been correctly simulated in the models that underpin climate projections reported by the Intergovernmental Panel on Climate Change (IPCC).
The panel’s most recent report generally used ocean models with a resolution of around 1 degree.
This is because the models must simulate the ocean, atmosphere, land and ice as coupled systems feeding back on one another, and must simulate change over a period of 200 years.
Both of these objectives are computationally expensive, even at a resolution of 1 degree.
But at this resolution, the entire spatial scale of a western boundary current is covered by a single data point.
“This is our frontier,” says Beal.
“We need to be able to resolve crucial ocean features such as eddies and western boundary current systems in the global climate models that are used to predict the climate of the twenty-first century.”
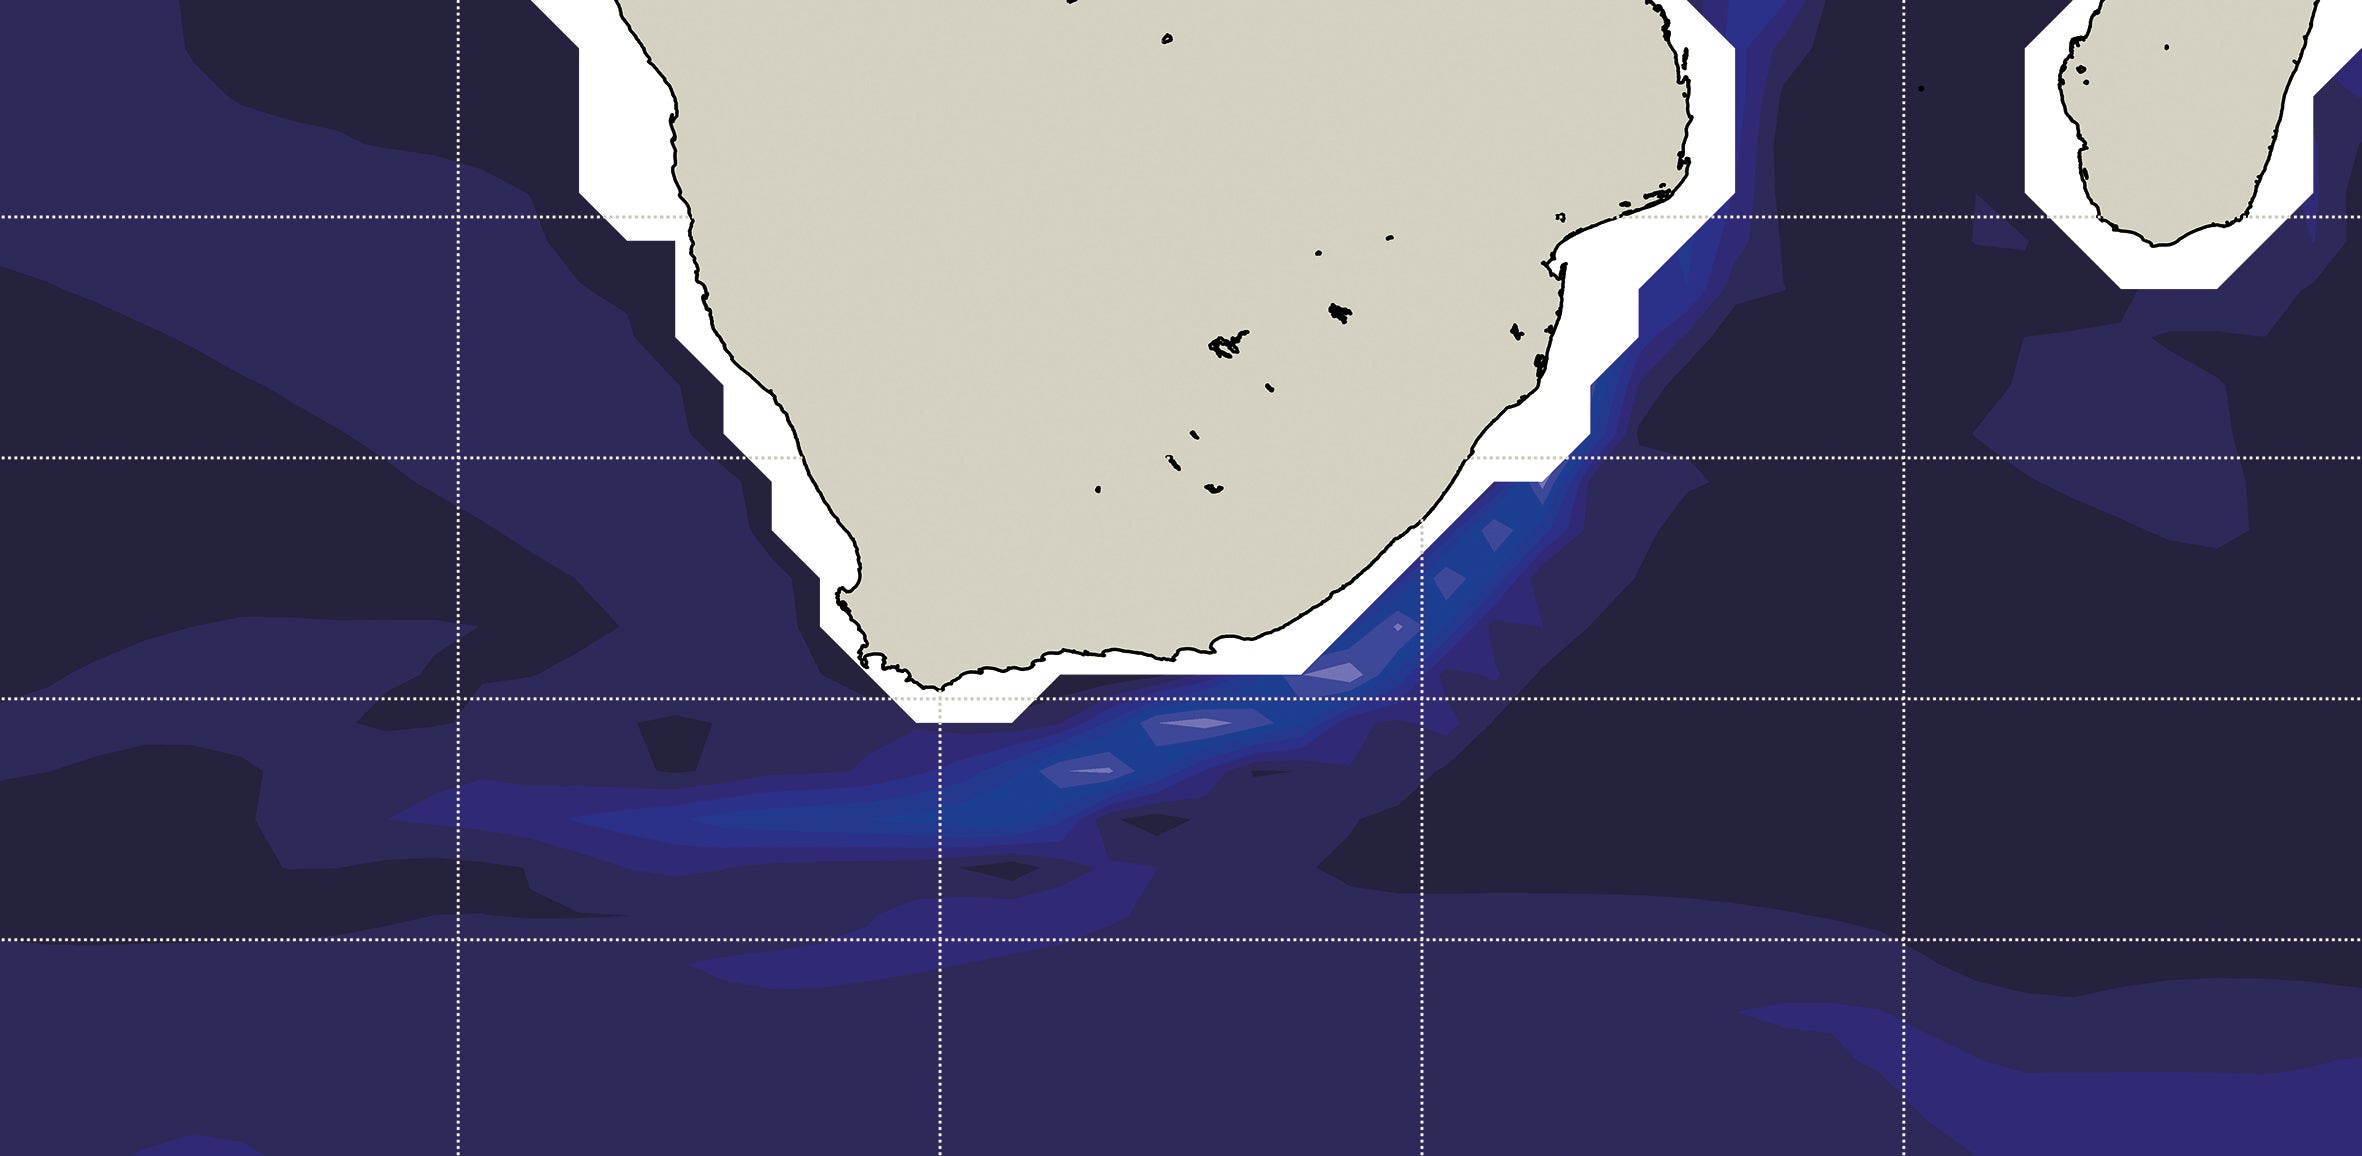
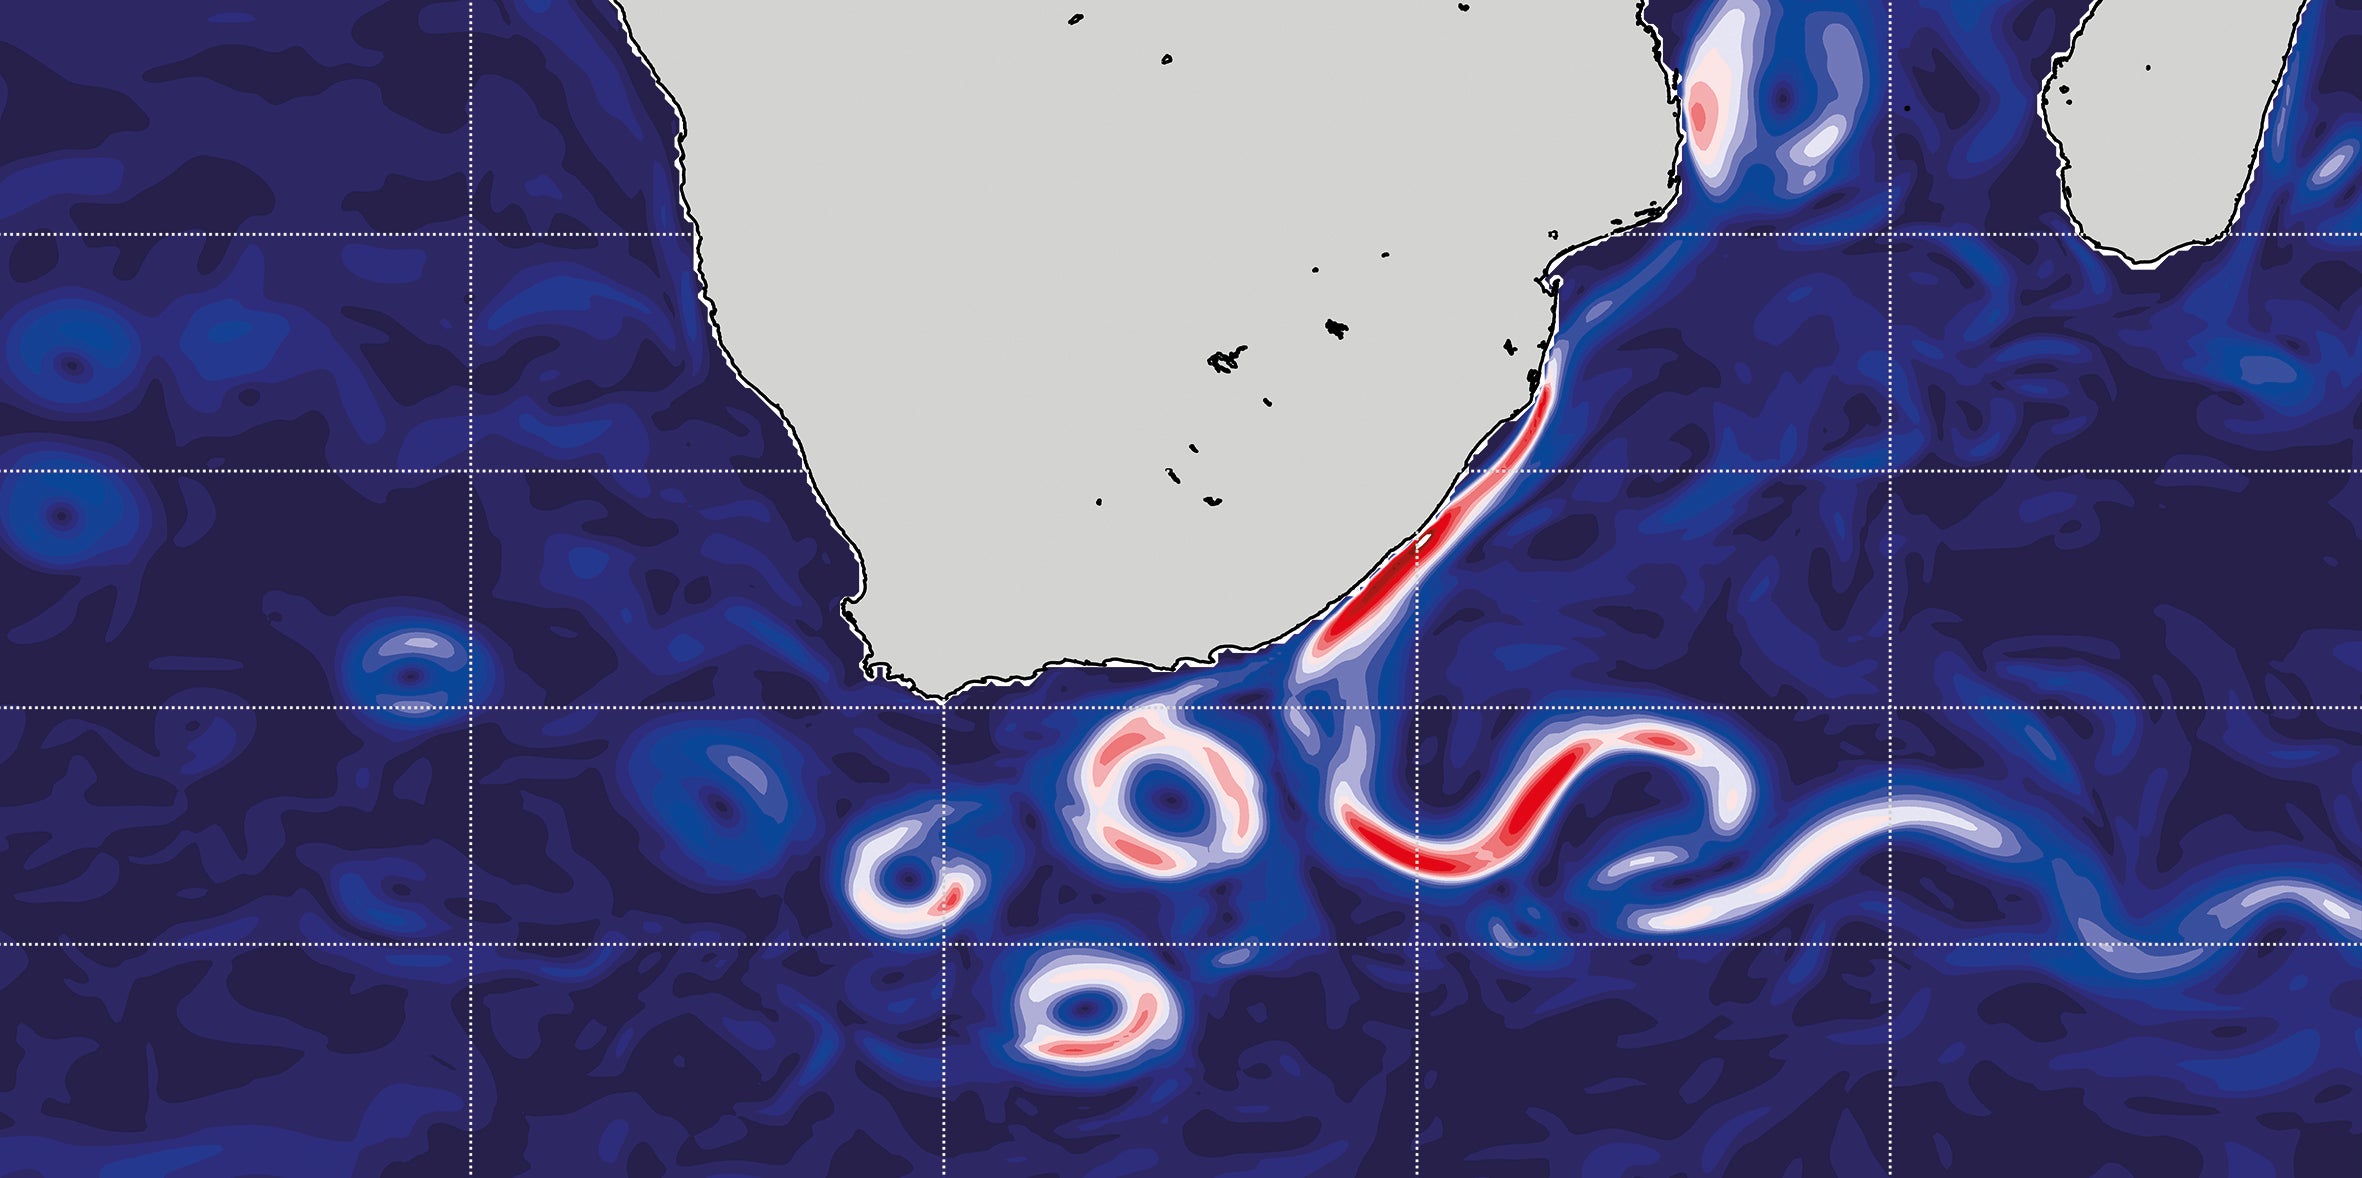
Resolving a current problem
Whereas a typical climate-prediction model used by the Intergovernmental Panel on Climate Change shows the Agulhas Current off South Africa’s coast flowing freely into the South Atlantic (top), a simulation with ten-times-higher resolution (bottom) reveals swirling currents that more closely match real-world observations.
Credit: Ben Kirtman University of Miami-RSMAS
In 2016, Beal and her colleagues resolved the Agulhas western boundary current system, which lies off the coast of South Africa, for the first time in a climate model.
They used a coupled climate model with a global ocean resolution of one-tenth of a degree.
They then looked at what kind of ocean behaviours changed compared with lower-resolution models, and observed the effect on the heat and salt content of the South Atlantic.
They also calculated the water transport rate into the South Atlantic by so-called Agulhas leakage.
In both cases, the simulation matched real-world observations more closely than did models at lower resolution (see ‘Resolving a current problem’).
The next IPCC report, to be published in 2022, will use some ocean models with a resolution of one-quarter of a degree.
Beal thinks that using higher-resolution ocean models in global climate simulations is likely to change the representation of the way heat is transported from the equator to the poles.
Today’s climate models simulate western boundary current systems as being broader and slower than they really are.
As a result, they might underestimate the efficiency with which heat is carried from the equator towards the poles in the real ocean—a faster current boundary system loses less heat to the atmosphere and so delivers more to the poles.
Such an error in the way the model exchanges heat between the ocean and the atmosphere could result in an inaccurate simulation of global climate.
Levke Caesar : a climate of uncertainty
In 2018, Levke Caesar, a climate scientist at Maynooth University in Ireland, used a high-resolution model and observations of ocean circulation to show that the Atlantic meridional overturning circulation (AMOC)—a complex system of ocean currents that moves heat between the tropics and the North Atlantic—is losing strength.
This weakening could considerably change the climate of the Northern Hemisphere.
At the 2019 Lindau Nobel Laureate Meeting, Caesar spoke to Nature about the role of ocean models in climate science.
Why do climate scientists need to model the ocean?
Ocean circulations move carbon and heat into the deep ocean and transport heat around the globe—up to 1.3 petawatts from the tropics to the poles in the case of the AMOC.
That is as much power as about 1 million average-sized nuclear reactors.
So climate models improve a lot when you include the ocean.
And the longer the timescales you look at, the more important the ocean becomes.
How accurate are ocean models now?
There is a saying that all models are wrong, but some are useful, and it’s true—every model is an approximation.
The observed strength of the AMOC is around 16 million cubic metres per second.
But some climate models put it at nearly 30 million cubic metres per second.
So they’re definitely not perfect, but they can still help us to understand the mechanisms that drive ocean circulation, and how changes in the ocean feed back into the atmosphere.
How can you verify a model?
One reason why models of ocean currents diverge so much is that we are not completely sure what’s true.
But there are more observational systems being set up that we can use to validate our models with real data.
An array of moorings that spans the Atlantic at a latitude of 26 degrees north, from Morocco to Florida, has shown us how the AMOC has behaved in real life since 2004.
Observational work is really important in putting together a broad picture of the ocean.
What makes the AMOC so hard to model?
One problem is that it is difficult to model processes that take place at small scales.
At the surface you can get spatial resolution down to just a few metres, but that increases with depth.
Our high-resolution model has a horizontal scale of about 10 kilometres.
So there will always be processes that have to be represented by coding in the mathematical description of their physics.
Is uncertainty in models a problem?
Yes, definitely.
Some things that are difficult to implement in models could have a big impact on our predictions.
Most models suggest that the AMOC will continue to slow, but will not collapse this century.
But those models don’t account for fresh water coming from the Greenland Ice Sheet.
The omission of that destabilizing force probably makes the AMOC look more stable than it actually is.
Uncertainty in results also makes it harder to convince people about what is happening.
When scientists communicate, we try to be as honest as possible, and that means including all the uncertainties.
The problem is, when non-scientists claim that climate change is not that bad, they don’t say “but we could be wrong”—they say it convincingly.
What can be done about that?
We should probably emphasize the costs more.
If the negative effects of something happening are great, then no matter what the percentage risk is, you should take action to prevent it.
Some climate models suggest that as the AMOC weakens, storm tracks could become more prominent going towards the United Kingdom.
We’re not certain about that, but there’s an indication.
Do we really want to test it?
Mixing it up
Even when resolution is not high enough to model small-scale processes, steps can be taken to represent them by alternative means.
For mesoscale ocean processes, this can be done by parameterization—a method by which ocean processes are represented by coding in the mathematical description of their physics.
Jennifer MacKinnon, a physical oceanographer at the Scripps Institution of Oceanography in San Diego, California, studies internal waves that oscillate deep in the ocean.
These waves have an important effect on mesoscale turbulent mixing processes in the ocean, which are known to affect the way the entire ocean works, and therefore influence the global climate.
“Because ocean models have a certain resolution which tend to be many kilometres, or tens of kilometres, in scale,” she says, “they cannot resolve and simulate many of the processes in the ocean.” Even for higher-resolution models, these ‘sub-grid-scale processes’ might still be too small to be explicitly resolved.
In 2017, MacKinnon co-authored a paper on internal wave-driven ocean mixing that was the culmination of a five-year study by the Climate and Ocean: Variability, Predictability and Change (CLIVAR) project.
“Models had previously set the mixing rate as a constant, or at least something that was not spatially variable,” she says.
But MacKinnon had seen that this was not really the case.
“Our observations showed us something that the models are not yet incorporating,” she explains.
The researchers tweaked the models to represent those turbulent mixing processes, and then looked at how the ocean models behaved differently over timescales of decades compared with those that took ocean mixing to be a constant.
The results showed that the deep-water mixing parameterization had a significant effect on the ocean’s overturning circulation, which in turn affects the atmosphere and therefore global climate.
So, to have a realistic climate projection, MacKinnon argues, models that are too coarse to include these internal mixing processes should at least include a parameterization to represent them.
Beyond resolution
Despite the benefits that higher resolution and parameterization offer climate modellers, it is not always feasible to use them.
The time required to compute the simulations grows with increasing resolution, as does the quantity of data generated.
“This problem just grows and grows the longer you want your simulations to be,” Durgadoo says.
The temporary nature of a research workforce comprising graduate students and postdocs means there is not time to run ocean models at ever-higher resolution.
And crucially, it is not clear that continuously ramping up model resolution will always bring greater benefits.
At very high resolutions, Beal says, the performance of the models could become unstable.
Researchers also need to think about other factors besides resolution.
One study showed that coupling the ocean with the atmosphere gives a more realistic simulation of the Gulf Stream than that achieved by simply increasing the model’s resolution
3.
“If you keep turning up the resolution, there comes a point where you can’t really improve,” Beal says.
Durgadoo agrees.
“Resolution is definitely a limiting factor, but only up to a point,” he says.
The simulations that he and his colleagues performed to trace the missing Malaysian Airlines flight, for example, had a high resolution, but their study had many other limitations.
“It’s not only a problem of model resolution across the surface of the ocean and through time—there are other unknowns,” he says.
For example, researchers have a limited understanding of the physics of fluid mechanics.
It does not matter how high a model’s spatial resolution is if the underlying physics is lacking in detail.
The only way to overcome this problem is by further observational research.
The scientists all agree that better models require collaboration between those who observe the ocean and those who attempt to simulate it.
But that interdisciplinary communication can be lacking.
Beal and MacKinnon are physical oceanographers who lead ocean cruises to deploy measuring devices into the abyssal depths, whereas ocean modellers such as Durgadoo are almost always office-based and often work at different institutes.
Without effort, they might never meet.
Beal says that programmes such as CLIVAR and the Global Ocean Observation System (GOOS) are extremely useful for bringing researchers together, and Mac-Kinnon’s climate process team is an example of a positive outcome from that process.
By grouping observational scientists and modellers together, MacKinnon says, the community can improve its understanding of the physical ocean and refine the performance of the models.
As models improve, so too might confidence in the conclusions that can be drawn from them.
Such a boost might have benefited Durgadoo’s team in the search for MH370.
Although they recognized the limitations of their study, they contacted the search authorities in 2015 with the finding that they were probably looking in the wrong place.
The authorities acknowledged receipt of their correspondence, but there was no discussion or action around shifting the search site.
“More recently, we’ve conducted further research on the matter, but decided not to send it to the authorities,” says Durgadoo.
The current focus of their work is improving the method, he explains.
For now, the disappearance and whereabouts of the aircraft remain a mystery.
Links :


