Saturday, June 22, 2019

Mirabaud 2019 'Bol d'Or' sailing race : Morpho dismasting in a storm

465 boats... 66.5 Nm of course... peaks at 60 knots...
A Dantean edition of the Bol d'Or Mirabaud, the world's largest closed basin regatta 

Links :

Friday, June 21, 2019

Germany (BSH) layer update in the GeoGarage platform

106 nautical raster charts updated & 6 new charts added

AIS gets an upgrade

AIS data at work in a VTS center (file image courtesy Saab)

From Maritime Executive

AIS has made it far easier for navigators to identify vessel movements for collision avoidance, and it has made shipping far more transparent by enabling worldwide vessel tracking services.


The industry has grown since AIS rolled out in the early 2000s, and a much-needed update is on the way: VHF Data Exchange System, or VDES, which will incorporate AIS plus several valuable new functions.

VDE system concept and available communication links

VDES will operate in VHF frequencies adjacent to the existing AIS channel, and will use a different network protocol to increase its throughput capacity.
This will boost the system's capacity for ship-to-ship, ship-to-shore, ship-to-satellite and virtual ATON applications, eliminating the network limitations that affect high-traffic areas today.
It will have up to 30 times more bandwidth, which will also give it more capacity for sharing weather forecasts, alerts and other data packets that are a bit too large for AIS.

Vessel traffic along Western Europe given by ExactEarth. 
a Expected coverage for satellite VDE beyond the coverage of the coastal stations. 
b Expected traffic density overall


VDES is also expected to increase navigation data security by adding access control and authentication features for AIS radio traffic.
Since it is authenticated, it could be used to provide warning in the event of GNSS jamming and spoofing, according to Johan Lindborg, project manager for marine and defense tech company Saab.
Saab is already working on type approval for a VDES-capable AIS base station, with an upgrade path for full VDES available by 2021 - about the same time that the new protocol is expected to enter into operation.


VDES may also incorporate a dedicated channel for two-way VHF ship-to-satellite communications, which could be used to share ice routes, weather updates or GNSS status reports, among other uses.
The International Telecommunication Union will consider setting aside a channel for this purpose at a meeting in November.

The new protocol could also provide the backbone for a backup positioning system in the event of GNSS spoofing or jamming.
Researchers from the German Aerospace Center are now testing a new terrestrial navigation system, R-Mode, which leverages existing radionavigation transciever stations on shore (DGNSS reference stations and AIS base stations) to transmit timed positioning signals.
Since the cost of implementation is low relative to a full-fledged, purpose-built system like eLoran, R-Mode is a promising way to bring resiliency to e-navigation, according to IALA.

Links :

Thursday, June 20, 2019

Norway (NHS) update in the GeoGarage platform

159 nautical raster charts updated

Massive 8,000-mile 'dead zone' could be one of the gulf's largest


Seen from above (Photograph by Phil Degginger, NASA Landsat ), the Mississippi River carries sediment into the Gulf of Mexico.
That sediment often contains pollutants from fertilizers that cause a spike in algal blooms.

From National GeoGraphic by Sarah Gibbons

Record-breaking Midwest rainfall washed tons of fertilizer and sewage water out to sea, contributing to a devastatingly large patch of polluted water, scientists say.

Just off the coast of Louisiana and Texas where the Mississippi River empties, the ocean is dying.
The cyclical event known as the dead zone occurs every year, but scientists predict that this year's could be one of the largest in recorded history.

A satellite image of the Gulf of Mexico showing sediment flowing into it from the Mississippi River.
NASA Earth Observatory

Annual spring rains wash the nutrients used in fertilizers and sewage into the Mississippi.
That fresh water, less dense than ocean water, sits on top of the ocean, preventing oxygen from mixing through the water column.
Eventually those freshwater nutrients can spur a burst of algal growth, which consumes oxygen as the plants decompose.

The resulting patch of low-oxygen waters leads to a condition called hypoxia, where animals in the area suffocate and die.
Scientists estimate that this year the dead zone in the Gulf of Mexico will spread for just over or just under8,000 square miles across the continental shelf situated off the coast.

Choking an ecosystem

“When the oxygen is below two parts per million, any shrimp, crabs, and fish that can swim away, will swim away,” says Louisiana State University ocean ecologist Nancy Rabalais.
“The animals in the sediment [that can't swim away] can be close to annihilated.”

Animals like shrimp will often search for more oxygen in shallower waters closer to the shore.
Shrimp subjected to hypoxic waters are smaller, their growth stunted by pollution.

One study published in 2017 noted how the dead zone affects Gulf Coast shrimpers by driving down the price of shrimp and reducing profit for local businesses.

Dead zones are not unique to the Gulf of the Mexico, though the gulf's is estimated to be the world's second largest.
In the world's largest dead zone, in the Baltic Sea, low oxygen devastated fisheries, and most marine animals can no longer survive there.

Off the West Coast of the United States, California and Oregon crab and oyster industries have reported profit losses since the early 21st century, saying the annual wave of low oxygen ocean water has destroyed many of the animals they normally fish from the sediment.

Hypoxic zones are areas in the ocean of such low oxygen concentration that animal life suffocates and dies, and as a result are sometimes called "dead zones."
One of the largest dead zones forms in the Gulf of Mexico every spring.
This data visualization discusses the causes of hypoxia in the Gulf of Mexico.
Credit: National Oceanic and Atmospheric Administration (NOAA) 2009

Dead zone causes

Rabalais says she's not surprised that this year's dead zone will be particularly large.
Much of the Midwest saw unprecedented rainfall this spring, leading to a large increase in the amount of runoff washing into the sea.
Many farmers were so affected by the intense rains that they were unable to plant crops like corn and soybean, meaning all the nitrogen and phosphorus-rich fertilizer they had spread washed into the Mississippi.
Scientists are predicting that a warming climate could lead to more extreme rainfall in the region and ultimately make it more difficult to control fertilizer runoff.
“The best way to solve the issue is to limit the nutrients at their source,” says Rabalais.
“Once they're in the river, there's no good way to reduce them.”

Eugene Turner, also from Louisiana State University, worked with Rabalais on predicting the size of the dead zone.
He says better management practices could reduce the size, and suggested maintaining soil health by rotating crops, using less fertilizer, and using crop covers to keep soil in place.

David Scheurer is a scientist from the National Oceanic and Atmospheric Administration who studies dead zones.
He notes that it's difficult to attribute a larger dead zone to just one practice like agricultural runoff, but notes that it plays a significant role in the zone’s formation.
Sewage water and weather also impact the size of the dead zone.

Senior director of congressional relations at the American Farm Bureau Federation Don Parrish says farmers are already adopting practices to reduce nutrient runoff.
Precision farming and artificial intelligence are both helping farmers reduce the amount of fertilizer they need to use on crops.
High costs and a steep learning curve are making it difficult for the sustainable technologies to be adopted by all farmers, Parrish adds.
“Scientifically we can reduce the size, but whether you can get there politically, that's still a work in progress,” he says.


Climate change and dead zones

Scientists are now worried that warming waters in the Gulf of Mexico could increase rates of hypoxia.
“That is a long-term concern,” says Scheurer.
“If the climate does change in that region, there is a fair amount of evidence suggesting you would expect things to get worse.”

Simply put, warm water is less capable of carrying oxygen, and a study published last year noted stretches of low-oxygen water thousands of miles across the ocean.
Climate change is also expected to cause more intense precipitation and flooding in the Midwest, which will contribute to the amount of chemical fertilizer washed into the ocean.

Both Scheurer and Rabalais, however, say it's too early to say that the gulf's dead zone is already being made worse by climate change.
Rabalais says she expects the dead zone to worsen in the future, further harming the ecosystem.
“You of course remember the BP oil spill?” she asks.
“This is a slow drip kind of change in the system thats been happening over decades, but it's just as consequential.”

Links :

Wednesday, June 19, 2019

Autosub Long Range's 2017 debut outing provides new insight into causes of the warming ocean abyss

Autosub Long Range (aka Boaty McBoatface) is an autonomous underwater vehicle developed at the National Oceanography Centre Southampton.
For its maiden voyage, University of Southampton oceanographers led by Alberto Naveira Garabato deployed the ALR around Orkney Passage as part of the DynOPO (Dynamics of the Orkney Passage Outflow, ) field operations in 2017.
During the recent DynOPO 2017 cruise, we created a fly-through animation of Autosub Long Range's voyage (3.5 days, compressed into 3.5 minutes) to visualise its progress.
It has cameo appearances by a Rockland Vertical Microstructure Profiler and the British Antarctic Survey ship, the RRS James Clark Ross.
The animation itself uses the ALR's pitch, heading, roll, propeller speed and position information, the JCR heading and position, and the VMP position and depth.


From NOC

The first mission involving the NOC-developed autonomous submarine vehicle Autosub Long Range (ALR, known around the world as Boaty McBoatface) has for the first time shed light on a key process linking increasing Antarctic winds to rising sea temperatures.

Data collected during the April 2017 expedition – published this week in the scientific journal PNAS – will help climate scientists build more accurate predictions of the effects of climate change on rising sea levels.

Boaty McBoatface, fresh off of doing science.
Using a combination of Boaty’s data and measurements collected by the RRS James Clark Ross, researchers were able to identify a previously unknown mechanism allowing the winds blowing over the Southern Ocean — which have been getting stronger in recent decades due to climate change — to increase the turbulence deep beneath the ocean’s surface. 
Photo: NOC

The research studied the changing temperatures at the bottom of the Southern Ocean.

During the three-day mission, Boaty travelled 180 kilometres through mountainous underwater valleys measuring the temperature, saltiness and turbulence of the water at the bottom of the ocean.
Using an echo sounder to navigate, Boaty successfully completed the perilous route, reaching depths of up to 4000 metres, to re-unite with the rest of the project team at the programmed rendezvous location where the sub was recovered and the data collected along its route were downloaded.

In recent decades, winds blowing over the Southern Ocean have been getting stronger due to the hole in the ozone layer above Antarctica and increasing greenhouse gases.
The data collected by Boaty, along with other ocean measurements collected from research vessel RRS James Clark Ross, have revealed a mechanism that enables these winds to increase turbulence deep in the Southern Ocean, causing warm water at mid depths to mix with cold, dense water in the abyss.


The resulting warming of the water on the seabed is a significant contributor to rising sea levels.
However, the mechanism uncovered by Boaty is not built into current models for predicting the impact of increasing global temperatures on our oceans.
Boaty’s mission was part of a joint project involving the University of Southampton, the National Oceanography Centre, the British Antarctic Survey, Woods Hole Oceanographic Institution, and Princeton University.

Professor Alberto Naveira Garabato from the University of Southampton – who led the project – said: “Our study is an important step in understanding how the climate change happening in the remote and inhospitable Antarctic waters will impact the warming of the oceans as a whole and future sea level rise.”

Dr Eleanor Frajka-Williams of the National Oceanography Centre said: “The data from Boaty McBoatface gave us a completely new way of looking at the deep ocean – the path taken by Boaty created a spatial view of the turbulence near the seafloor.”

Scientists and engineers aboard BAS research ship RRS James Clark Ross have deployed the unmanned submersible Autosub Long Range - also known as Boaty McBoatface - for the first time. 5April 2017).
They are in the Weddell Sea in Antarctica to study how turbulence in the deepest water masses affects global climate.

Dr Povl Abrahamsen of the British Antarctic Survey said: “This study is a great example of how exciting new technology such as the unmanned submarine Boaty McBoatface can be used along with ship-based measurements and cutting-edge ocean models to discover and explain previously unknown processes affecting heat transport within the ocean.”

In 2018, ALR completed its first successful under ice mission beneath the Filchner Ice Shelf in West Antarctica.
This success marked a further significant milestone in proving the vehicle’s pioneering capabilities.
ALR recently featured in a BBC News article ‘Super-tough drones and robots going where we can’t’.
Image gallery of the ALR deployment in the Southern Ocean.

Links :

Tuesday, June 18, 2019

Labor exploitation, illegal fishing continue to plague Asian seas

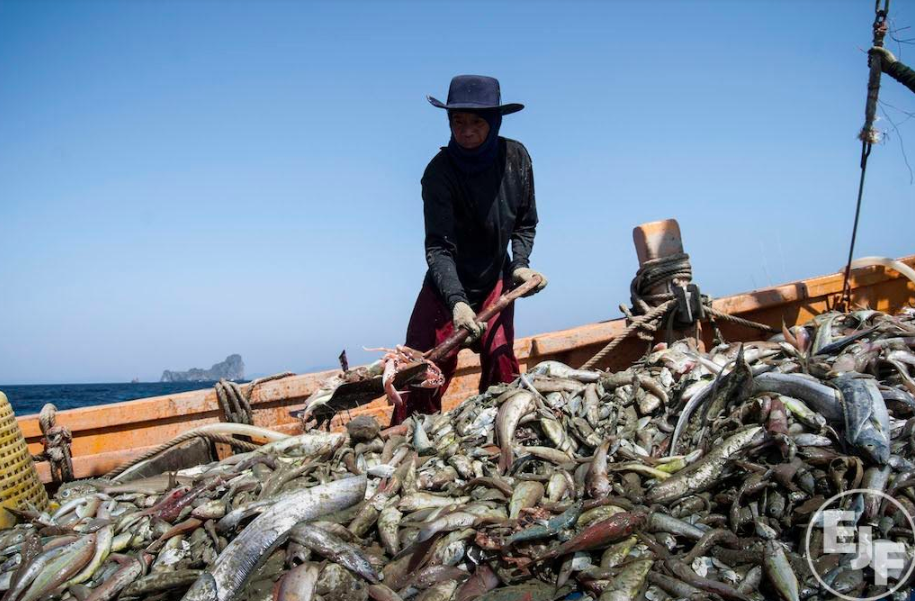
A Cambodian migrant worker aboard a Thai trawler targeting trash fish – to be made into fishmeal – in the Andaman Sea.
Image Credit: EJF

From The Diplomat by James X. Morris

A new EJF report finds widespread violations in the global seafood industry, including in Taiwan, Vietnam, and elsewhere in Asia.

A new report from the Environmental Justice Foundation (EJF) should be cause for alarm for many leaders in the Indo-Pacific.
Entitled “Blood and Water: Human rights abuse in the global seafood industry,” the report provides the latest information on “cases of slavery, debt bondage, insufficient food and water, filthy living conditions, physical and sexual assault, and even murder” occurring on fishing vessels flying flags from 13 countries, both developing and developed, from Asia and South America to the European Union and United States.
Such labor abuses are a result of dwindling fish stocks in overexploited oceans, forcing the industry to rely on cheap labor in order to turn profits.
Out on the high seas, the potential for abuse and exploitation remains high.
The result is a global nontraditional security crisis in the making.

Illegal, unregulated, and unreported (IUU) fishing and labor exploitation is rampant in the global fishing industry, particularly because of the difficulty of monitoring activities on the vast high seas.
Asia appears to be at the epicenter of the global fisheries crisis.
In the past I have written reports for The Diplomat on labor issues in Taiwan’s fishing fleets, Thailand’s efforts to halt poachers from neighboring countries in its waters, and the impounding of the Fuh Sheng No. 11 in Kaohsiung Port in southern Taiwan, following a global effort involving South Africa and Indonesia to track down the vessel for labor violations and unsafe conditions under the International Labor Organization’s (ILO) Work in Fishing Convention (C188) in 2018.
These reports are a drop in the bucket, only snapshots of a greater problem.

“Our report highlights profoundly concerning truths about the fishing industry globally, highlighting how illegal and unscrupulous operators are running operations based on the abuse of workers and the illegal and unsustainable exploitation of marine fisheries,” EJF’s Executive Director Steve Trent said in a statement issued by EJF.
The report highlights forgeries among the flag of convenience practice (registering a vessel in a country other than where it is owned and operated); in one example, nine Taiwanese tuna long-liners using forged papers claiming registration in Bolivia were impounded in Thailand in 2016.
“Stateless vessels” are another thorn in the sides of regulators and watchdogs; such ships act with impunity on the high seas, and are only caught when needing repairs in port.
Brokerage systems provide fishing vessels from more developed countries with indebted, indentured laborers from developing states, who are then forced into debt with garnished wages aboard ships with poor conditions and little opportunity to escape.

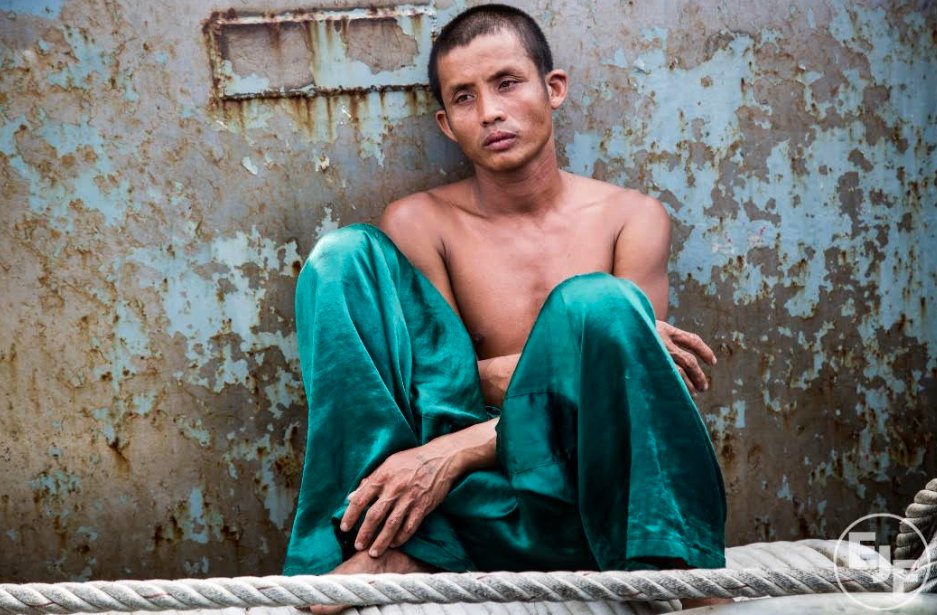
A Burmese worker aboard a Thai trawler operating in the Andaman Sea.Photo courtesy of EJF.

I asked Trent to elaborate on EJF’s work in Taiwan and provide an update on the island’s fisheries for The Diplomat.

“Since the Fuh Sheng [No.] 11 case, Taiwan has made positive steps forward in improving its regulations to make its fleet more transparent,” Trent said.
“For instance, they have started the process of publishing information on licensed vessels and bringing their law in line with the critical [C188 convention].”

He indicated, however, that EJF monitors in Taiwan are continuing to find cases of IUU fishing and trafficking in the industry, and bring the cases to the government.
“We hope they are thoroughly and urgently investigated and that vessel operators are sanctioned where appropriate,” Trent stated.
The NGO urges Taiwanese authorities to implement measures for abused fishers to raise the alarm, and to better monitor the industry to make certain destructive IUU practices no longer occur in its fisheries.

In late 2015, tuna prices hit a low on both sides of the Pacific, forcing Taiwanese long-liners to either remain in port to avoid fuel expenses or remain farther out at sea — where abuses are more common — for longer periods.

Elsewhere in the Asia-Pacific, Vietnam has one of the fastest growing fishing fleets, typically small vessels that do not require the mandated tracking devices of larger boats.
Due to the collapse of the local market, these vessels set out to capture highly prized species for the Chinese market with little oversight.
The report outlines 14 countries in the region that have made arrests of illegal vessels from Vietnam, forcing the European Commission to issue a yellow card.

The issue extends much farther into the Pacific, however.
The report outlines the detainment of migrant workers, primarily from Indonesia, the Philippines, and Kiribati, onboard tuna long-liners in the waters around Hawaii.
Despite working on U.S.-flagged vessels, these migrant workers do not have visas to enter the United States; doing so would be illegal.
Honolulu is a hub for some 140 such vessels, and when in port the workers must be “detained onboard,” with passports seized by captains to take advantage of a legal loophole.

The report indicates the seafood industry makes up approximately 9 percent of global agriculture exports, with trade valued at $152 billion in 2017.
In some countries, seafood accounts for 40 percent of total trade value.
Fish consumption has grown from 9.9 kilograms per capita in the 1960s to 20.5 kg per capita in 2017.
The result is that employment in this sector has expanded despite the depletion of global fish stocks.

EJF indicates one third of fish stocks are being exploited at unsustainable levels, with “a further 60 percent of fisheries on edge” and at risk according to the report.
Another recent report by the Asia Maritime Transparency Initiative has found Chinese clam harvesting fleets have returned to the South China Sea in greater numbers, wreaking havoc upon coral reefs to feed the nation’s seemingly insatiable desire for endangered giant clams.

In a statement EJF has proposed a list of 10 “logistically deliverable, low-cost measures” that could transform the way the global industry operates.
Such measures include promoting greater transparency, including giving all vessels unique tracking numbers with public tracking data, digitally and publicly listing vessel information, and making documentation of vessels and infractions publicly available, among other solutions.
Such measures could help provide consumers with information about where their food and goods originate, providing the public with information to make ethical market decisions.

Time is of the essence, however, for both exploited laborers and dwindling fish stocks.

Links :

Monday, June 17, 2019

How many islands does Croatia have

new layer in the GeoGarage platform : Croatia with HHI ENCs

From Total Croatia by Nikolina Demark

You'll often see Croatia promoted as the country of a thousand islands.
It always seemed like a pragmatic approach - there are more than 1000, of course, but such a rounded number has a certain sleek appeal to it.
It sounds way better than, say, a country of 1244 islands.
That just looks like an opening line to a math problem.

Marketing aside, how many islands does Croatia actually have?
It turns out, a consensus on that particular topic hasn't yet been reached.
Several entities have their own individual opinions on the exact number and they all seem to differ, so we end up hearing about a new version every so often, leaving both us locals and tourists confused.

 Dalmatian islands

The Croatian National Tourist Board has occasionally cited the mentioned number of 1244 in their promotional campaigns.
The fact was confirmed by the Ministry of Tourism; in 2010, they referred to the figure as the latest data collected by the Hydrographic Institute of the Republic of Croatia (HHI).
And yet, as stated in this report by Jutarnji, experts from the Cartographic Department of the Hydrographic Institute said there were actually 1246.

An older version of the article about Croatian islands on Wikipedia used to state there were 991; it has since been altered to cite 1244.
Those who were looking up Croatian islands a decade or two ago might remember 1185 popping up here and there; this particular figure was established in the 50s and updated in the meantime owing to more refined technology.
It's no wonder some people are perplexed - the best example I've come upon is a travel piece titled 'Croatia's 1244 Dalmatian islands'.
We might not be sure how many there are precisely, but they certainly aren't all Dalmatian.
At least one thing we can all agree on.

Where to look for the source of all the confusion?
Well, the sole definition of an island is a good place to start.
The Hydrographic Institute classifies every landform surrounded by water with a surface bigger than 1 km2 as an island.
Those between 0.1 and 1 km2 are considered islets, and those that are smaller than 0.1 km2 are classified as rocks.

Croatia nautical charts with the GeoGarage platform (UKHO charts based on HHI sources)

Out of those 1244, only 78 are actually proper islands (or 79, depending on the source); 525 are islets, while 642 are rocks and reefs.
According to an expert from the Cartographic Department quoted in Jutarnji's piece, pinpointing the exact number can be tricky.
Relying on aerial views isn't always a foolproof way of establishing the size of an island, which is why some tend to end up in the wrong category, and there's not enough personnel to allow for collecting data on the ground.
"We had 130 employees before the war, and now there are 85. This is why we don't have time to count the islands; we prioritise construction of nautical charts to ensure safe navigation", said Pijo Bročić from the Cartographic Department of HHI.
Fair enough.


HHI nautical paper map

All things considered, speaking from a realistic point of view, you probably won't be losing any sleep over the exact number of rocks in Croatia.
The most popular island destinations are very much alive and kicking, and they're not about to fall off the map any time soon - pun intended.

Links :

A new layer in the GeoGarage platform : Croatia nautical charts based on rasterized ENC material from HHI

Nautical charts for Croatia until today which leads to the availability of a new dedicated layer for Croatia with HHI ENCs :
Croatian raster charts in the GeoGarage platform included with the British Isles & misc. (UKHO) layer
note : with the arrival today of a dedicated and exhaustive layer for Croatia, these Admiralty raster charts for Croatia will be withdrawn in the next Q3-2019 release of the layer based on UKHO raster material

Until today, the GeoGarage platform used the raster chart material (RNC) provided by UKHO to display nautical charts for the Croatian areas.
Unfortunately, UKHO only integrates about a couple of charts (14 maps exactly) from the original digital nautical maps from HHI (Hrvatski hidrografski Institut) whole catalogue of paper maps (126 in total).
(see last UKHO update in the GeoGarage platform)

For internal management reasons specific to HHI, the Hydrographic Institute of Croatia can't deliver to their commercial licensees (whose GeoGarage) their own digital raster material (RNC) -with a recurrent periodicity for updates- corresponding to the Croatian nautical paper maps.

The GeoGarage platform was already in the capacity to deliver a rasterized visualization of Electronic Navigation Chart (vector ENC) through their web services (WMS/WMTS) for their customers involved in webmapping and other onshore GIS activities.

Today, the GeoGarage platform is ready to propose the visualization of ENC to their customers using mobile navigation apps (non SOLAS)

 new ENC_HR layer :
Croatia (HHI) ENC coverage in the GeoGarage platform (150 cells)

 view of Šibenik harbor (rasterized ENC overlaid on Google Maps imagery)

So Weather4D R&N users (with updated version 12/06/2019) can right now display the whole catalogue of HHI ENC (150 ENC at this time), with a quarterly updating process : see GeoGarage news

Today, in this first version, the vector ENC are displayed using a graphical rendering similar to the one used in official ECDIS (s-52 IHO specifications) : they are not to be used for shipping navigation (IMO SOLAS), but only for recreative use, not as a primary tool for navigation.
Effectively, in contrast to the use in ECDIS, there is no possibility -today with the W4D current version- to ask for text info and details regarding any navigational objects (beacon, buoy, marks...).

 Hvar with Weather4D R&N
Note : to get a yearly subscription to the Spain (IHM) layer on the GeoGarage e-commerce website
(pricing ENC_HR : 43.99 €) for W4D R&N iOS mobile app, go to :
weather4d.geogarage.com

Links :

Greenland lost 2 billion tons of ice this week, which is very unusual

This remarkable Greenland photo highlights extreme Arctic melting
Image : Steffen M. Olsen, courtesy of Mashable

From CNN by Brandon Miller

Over 40% of Greenland experienced melting Thursday, with total ice loss estimated to be more than 2 gigatons (equal to 2 billion tons) on just that day alone.

While Greenland is a big island filled with lots of ice, it is highly unusual for that much ice to be lost in the middle of June.
The average "melt season" for Greenland runs from June to August, with the bulk of the melting occurring in July.

To visualize how much ice that is, imagine filling the National Mall in Washington with enough ice to reach a point in the sky eight times higher than the Washington Monument (to borrow an analogy Meredith Nettles from Columbia University gave to The Washington Post).

The sudden spike in melting "is unusual, but not unprecedented," according to Thomas Mote, a research scientist at the University of Georgia who studies Greenland's climate.
"It is comparable to some spikes we saw in June of 2012," Mote told CNN, referring to the record-setting melt year of 2012 that saw almost the entire ice sheet experience melting for the first time in recorded history.
This much melting this early in the summer could be a bad sign, indicating 2019 could once again set records for the amount of Greenland ice loss.

That doesn’t look right.
Image: NSIDC

Mote explained how snow and ice melt off the Greenland ice sheet, especially early in the season, makes it easier to for additional melt to occur later in the summer.
White snow and ice, which is bright and reflects the sun's rays back into space, reduces the amount of heat that is absorbed and helps to keep the ice sheet cold, a process known as "albedo."
"These melt events result in a changed surface albedo," according to Mote, which will allow more of the mid-summer sun's heat to be absorbed into the ice and melt it.

 courtesy of PolarPortal

Predictions for a record melt season

Mote says "all signs seem to be pointing to a large melt season," and he is far from the only scientist to think so.
Jason Box, an ice climatologist at the Geological Survey of Denmark and Greenland, predicted in late May that "2019 will be a big melt year for Greenland."
Box pointed out that this year had unusually early-season melt days in April, and the melt season was "happening about three weeks earlier than average, and earlier than the record-setting melt year of 2012."
In addition to the early-season melt, the snow cover is already lower than average in Western Greenland, and combining these factors means "2019 is likely going to be a very big melt year, and even the potential to exceed the record melt year of 2012."

What is causing the sudden melt?

A persistent weather pattern has been setting the stage for the current spike in melting, according to Mote.
"We've had a blocking ridge that has been anchored over East Greenland throughout much of the spring, which led to some melting activity in April -- and that pattern has persisted."
That high pressure ridge pulls up warm, humid air from the Central Atlantic into portions of Greenland,.which leads to warmer temperatures over the ice.
The high pressure also prevents precipitation from forming and leads to clear, sunny skies.

Over the past week or two, that high pressure ridge got even stronger as another high pressure front moved in from the eastern United States -- the one that caused the prolonged hot and dry period in the Southeast earlier this month.

photo : Christian Streib, CNN

Melt periods such as the current one are not unprecedented; Mote noted previous periods in 2012, 2010 and 2007, all major melt years.
But he pointed out that until recently, they were unheard of.
"We've seen a sequence of these large melt seasons, starting in 2007, that would have been unprecedented earlier in the record," he said.
"We didn't see anything like this prior to the late 1990s.
If these extreme melt seasons are becoming the new normal, it could have significant ramifications around the globe, especially for sea level rise.
"Greenland has been an increasing contributor to global sea level rise over the past two decades," Mote said, "and surface melting and runoff is a large portion of that."

Links :

Sunday, June 16, 2019

A new layer in the GeoGarage platform : Spain nautical charts based on rasterized ENC material from IHM

Nautical charts for Spain until today which leads to the availability of a new dedicated layer for Spain with IHM ENCs :
Spanish raster charts in the GeoGarage platform included with the British Isles & misc. (UKHO) layer
note : with the arrival today of a dedicated and exhaustive layer for Spain, these Admiralty raster charts for Spain will be withdrawn in the next Q3-2019 release of the layer based on UKHO raster material

Until today, the GeoGarage platform used the raster chart material (RNC) provided by UKHO to display nautical charts for the Spanish areas.
Unfortunately, UKHO only integrates about one third (around 100 RNCs) of the original digital nautical maps from IHM (Instituto Hidrografico de la Marina de España) whole catalogue of paper maps (329 in total).
(see last UKHO update in the GeoGarage platform)

For internal management reasons specific to IHM, the Spanish Hydrographic Office can't deliver to their commercial licensees (whose GeoGarage) their own digital raster material (RNC) -with a recurrent periodicity for updates- corresponding to the Spanish nautical paper maps.

The GeoGarage platform was already in the capacity to deliver a rasterized visualization of Electronic Navigation Chart (vector ENC) through their web services (WMS/WMTS) for their customers involved in webmapping and other onshore GIS activities.

Today, the GeoGarage platform is ready to propose the visualization of ENC to their customers using mobile navigation apps (non SOLAS)

 new ENC_ES layer :
Spanish (IHM) ENC coverage in the GeoGarage platform (296 cells)

 view of Ibiza harbor (rasterized ENC overlaid on Google Maps imagery)

So Weather4D R&N users (with updated version 12/06/2019) can right now display the whole catalogue of IHM ENC (296 ENC at this time), with a quarterly updating process : see GeoGarage news

Today, in this first version, the vector ENC are displayed using a graphical rendering similar to the one used in official ECDIS (s-52 IHO specifications) : they are not to be used for shipping navigation (IMO SOLAS), but only for recreative use, not as a primary tool for navigation.
Effectively, in contrast to the use in ECDIS, there is no possibility -today with the W4D current version- to ask for text info and details regarding any navigational objects (beacon, buoy, marks...).

1741 map of the Balearic Islands (Mallorca, Menorca, Ibiza, and Formentera)

Ibiza island with Weather4D R&N and AIS targets

 Ibiza harbor chart & AIS targets with Weather4D R&N
Note : to get a yearly subscription to the Spain (IHM) layer on the GeoGarage e-commerce website
(pricing ENC_ES : 25.99 €) for W4D R&N iOS mobile app, go to :
 
1957 Deposito Hidrografico Nautical Chart of Ibiza and Formentera Islands
source Geographicus
 

Links :

Sailing from Shetland to the Faroe Islands

by Erik Aanderaa

 Shetland to Faroë with the GeoGarage platform (NHS nautical chart)

Links :