Saturday, June 16, 2018
Friday, June 15, 2018
Seafloor cables that carry the world’s internet traffic can also detect earthquakes

Seafloor cables, such as this link between the United States and Spain, can serve as seismic sensors. Run Studios
From ScienceMag by Eric HandSome 70% of Earth's surface is covered by water, and yet nearly all earthquake detectors are on land.
Aside from some expensive battery-powered sensors dropped to the sea floor and later retrieved, and a few arrays of near-shore detectors connected to land, seismologists have no way of monitoring the quakes that ripple through the sea floor and sometimes create tsunamis.
Now, a technique described online in Science this week promises to take advantage of more than 1 million kilometers of fiber optic cables that criss-cross the ocean floors and carry the world's internet and telecom traffic.
By looking for tiny changes in an optical signal running along the cable, scientists can detect and potentially locate earthquakes.
The technique requires little more than lasers at each end of the cable and access to a small portion of the cable's bandwidth.
Crucially, it requires no modification to the cable itself and does not interfere with its everyday use.
The method "could be a game-changer," says Anne Sheehan, a seismologist at the University of Colorado in Boulder who wasn't involved in the work.
"More observations from oceanic regions could fill in some pretty big gaps."

MOMotion of the Ocean floor : The network of submarine fiber-optic cables that deliver work emails and cat videos to computers around the world could double as undersea earthquake detectors.
Existing cables are shown in purple; planned cables are in blue.
G. Marra et Al/Science 2018
It began with an accidental discovery, says Giuseppe Marra, a metrologist at the National Physical Laboratory in Teddington, U.K., who works on the fiber optic links that connect atomic clocks in labs across Europe.He was testing a connection on a 79-kilometer buried cable that runs from Teddington to Reading, U.K., and relies on a stable, resonating loop of laser light.
Vibrations near the cable—even the noise of traffic above—can bend it imperceptibly.
That can shorten or lengthen the light's travel distance by less than the width of a human hair, shifting the resonating light beams slightly out of phase.
Marra was accustomed to background noise on his fiber optics.
But when he reviewed data from October 2016, he saw more than the average amount of noise.
It turned out to be the local effects of 5.9- and 6.5-magnitude quakes that struck central Italy late that month.
"It was quite a revealing moment," Marra says.
That noise, he realized, pointed to a new way to detect earthquakes.

Submarine seismology
An underwater fiber-optic cable stretching from Malta to Sicily sensed a magnitude 3.4 quake in the Mediterranean Sea on September 2, 2017.
An underwater fiber-optic cable stretching from Malta to Sicily sensed a magnitude 3.4 quake in the Mediterranean Sea on September 2, 2017.
Researchers confirmed this detection with two nearby seismometers.
One seismometer near the Malta end of the cable, closer to the earthquake’s epicenter, detected the quake shortly before the cable, and a seismometer near the Sicily end identified it shortly after.
Marra wondered whether the technique could be extended to the ocean, where the environment might be quieter.Using a 96-kilometer submarine cable connecting Malta and Sicily in Italy, he and his colleagues detected a magnitude-3.4 earthquake in the Mediterranean Sea.
They couldn't pinpoint it.
But by shooting lasers down a cable from both ends, he says, scientists could detect differences in the travel times of the out-of-phase signals, which would reveal just where the earthquake first caused a disruption along the cable.
With three or more cables outfitted this way, he says, the earthquake's exact location in the crust could be triangulated.
By filling in the "seismic desert" in the ocean crust and showing where seafloor earthquakes occur and how often, the method could illuminate new fault structures and regions where tectonic plates are colliding or rifting apart, says Charlotte Rowe, a seismologist at Los Alamos National Laboratory in New Mexico.
It could also help with tsunami warning systems, she says, provided the strength of the optical signal reveals an earthquake's size.
Besides mapping earthquakes, Rowe thinks the cable networks could sharpen pictures of Earth's interior.
Like x-rays in a computerized tomography (CT) scan, seismic waves from big earthquakes carry clues to the density of rock they pass through.
From crisscrossing waves received by multiple sensors, seismologists can construct 3D pictures of mantle convection, in which hot plumes well up and cold tectonic plates plunge toward Earth's core.
Data from seafloor cables could fill in blind spots in these seismic CT scans.
But Rowe says investigators will have to get better at interpreting the cable signals before using them to peer into deep Earth.
Marra says the new technique is sensitive enough to work across ocean basins thousands of kilometers wide.
It requires adding a small cabinet of lasers and optical equipment that costs about $50,000 at each end of the cable, and access to just one of the hundreds of channels in a typical cable.
Renting a dedicated channel might cost about $100,000 a year on a transpacific cable, and much less on one between North America and Europe, says Stephen Lentz, who works with the cable industry as director of network development for Ocean Specialists, Inc., based in Stuart, Florida.
"Frankly, this is the kind of thing where the cable owner could donate the service and take the tax write-off.
It costs them little or nothing to share unused wavelengths."
That's significant, says Bruce Howe, a physical oceanographer at the University of Hawaii in Honolulu, who leads a task force exploring how to stud new ocean cables with seismic, pressure, and temperature sensors, every 50 to 100 kilometers.
Although the add-on sensors, at roughly $200,000 apiece, are cheaper than operating stand-alone ocean bottom detectors, cable owners have been wary of affecting cable performance.
The new technique offers a cheaper and less disruptive way to listen to the ocean floor.
Howe calls the results "intriguing" and says his task force will advocate for a longer test.
"It should absolutely be pursued."
Links :
- ScienceNews : Underwater fiber-optic cables could moonlight as earthquake sensors
- PR Newswire Uk : New Technique Paves the Way to a Global Underwater Earthquake ...
Thursday, June 14, 2018
Ramp-up in Antarctic ice loss speeds sea level rise
Changes in the Antarctic ice sheet’s contribution to global sea level, 1992 to 2017.
According to research from the Ice Sheet Mass Balance Inter-comparison Exercise (IMBIE), published today in Nature, the Antarctic ice sheet’s contribution to global sea level was 7.6 mm since 1992, with two fifths of this rise (3.0 mm) coming in the last five years alone.
According to research from the Ice Sheet Mass Balance Inter-comparison Exercise (IMBIE), published today in Nature, the Antarctic ice sheet’s contribution to global sea level was 7.6 mm since 1992, with two fifths of this rise (3.0 mm) coming in the last five years alone.
Credits: IMBIE/Planetary Visions
From NASA by Steve Cole and Alan Buis
Ice losses from Antarctica have tripled since 2012, increasing global sea levels by 0.12 inch (3 millimeters) in that timeframe alone, according to a major new international climate assessment funded by NASA and ESA (European Space Agency).
According to the study, ice losses from Antarctica are causing sea levels to rise faster today than at any time in the past 25 years.
Results of the Ice Sheet Mass Balance Inter-comparison Exercise (IMBIE) were published Wednesday in the journal Nature.
“This is the most robust study of the ice mass balance of Antarctica to date,” said assessment team co-lead Erik Ivins at NASA’s Jet Propulsion Laboratory (JPL).
“It covers a longer period than our 2012 IMBIE study, has a larger pool of participants, and incorporates refinements in our observing capability and an improved ability to assess uncertainties.”

The Antarctic Peninsula from the air: although the
mountains are plastered in snow and ice, measurements tell us that this
region is losing ice at an increasing rate.
Credits: University of Durham/Pippa Whitehouse
This latest IMBIE is the most complete assessment of Antarctic ice mass changes to date, combining 24 satellite surveys of Antarctica and involving 80 scientists from 42 international organizations.
The team looked at the mass balance of the Antarctic ice sheet from 1992 to 2017 and found ice losses from Antarctica raised global sea levels by 0.3 inches (7.6 millimeters), with a sharp uptick in ice loss in recent years.
They attribute the threefold increase in ice loss from the continent since 2012 to a combination of increased rates of ice melt in West Antarctica and the Antarctic Peninsula, and reduced growth of the East Antarctic ice sheet.
Prior to 2012, ice was lost at a steady rate of about 83.8 billion tons (76 billion metric tons) per year, contributing about 0.008 inches (0.2 millimeters) a year to sea level rise.
Since 2012, the amount of ice loss per year has tripled to 241.4 billion tons (219 billion metric tonnes) – equivalent to about 0.02 inches per year (0.6 millimeters) of sea level rise.

Crevasses near the grounding line of Pine Island Glacier, Antarctica.
Credits: University of Washington/I. Joughin
West Antarctica experienced the greatest recent change, with ice loss rising from 58.4 billion tons (53 billion metric tons) per year in the 1990s, to 175.3 billion tons (159 billion metric tons) a year since 2012.
Most of this loss came from the huge Pine Island and Thwaites Glaciers, which are retreating rapidly due to ocean-induced melting.

Pine Island Glacier calving front with the GeoGarage platform (NGA chart)
At the northern tip of the continent, ice-shelf collapse at the Antarctic Peninsula has driven an increase of 27.6 billion tons (25 billion metric tons) in ice loss per year since the early 2000s. Meanwhile, the team found the East Antarctic ice sheet has remained relatively balanced during the past 25 years, gaining an average of 5.5 billion tons (5 billion metric tons) of ice per year.
Rapid collapse of Antarctic glaciers could flood coastal cities by the end of this century.
Based on an article written by Eric Holthaus
Antarctica’s potential contribution to global sea level rise from its land-held ice is almost 7.5 times greater than all other sources of land-held ice in the world combined.
The continent stores enough frozen water to raise global sea levels by 190 feet (58 meters), if it were to melt entirely.
Knowing how much ice it’s losing is key to understanding the impacts of climate change now and its pace in the future.
“The datasets from IMBIE are extremely valuable for the ice sheet modeling community,” said study co-author Sophie Nowicki of NASA’s Goddard Space Flight Center.
“They allow us to test whether our models can reproduce present-day change and give us more confidence in our projections of future ice loss.”
The satellite missions providing data for this study are NASA’s Ice, Cloud and land Elevation Satellite (ICESat); the joint NASA/German Aerospace Center Gravity Recovery and Climate Experiment (GRACE); ESA’s first and second European Remote Sensing satellites, Envisat and CryoSat-2; the European Union’s Sentinel-1 and Sentinel-2 missions; the Japan Aerospace Exploration Agency’s Advanced Land Observatory System; the Canadian Space Agency’s RADARSAT-1 and RADARSAT-2 satellites; the Italian Space Agency’s COSMO-SkyMed satellites; and the German Aerospace Center’s TerraSAR-X satellite.
Tom Wagner, cryosphere program manager at NASA Headquarters, hopes to welcome a new era of Antarctic science with the May 2018 launch of the Gravity Recovery and Climate Experiment Follow-on (GRACE-FO) mission and the upcoming launch of NASA’s Ice, Cloud and land Elevation Satellite-2 (ICESat-2).
“Data from these missions will help scientists connect the environmental drivers of change with the mechanisms of ice loss to improve our projections of sea level rise in the coming decades," Wagner said.
Links :
- Eurekalert : Antarctica ramps up sea level rise
- CNET :Epic Antarctic ice sheet melt speeding up sea level rise
- WashingtonPost : Antarctic ice loss has tripled in a decade. If that continues we are in ...
- NY Times : Could Earth's Ice Sheets Collapse?
- Phys : New insights into the contribution of land ice to sea level rise
- Wired : How Scientists Tracked Antarctica's Stunning Ice Loss
- WSJ : You Wouldn't Think Sea Level Is So Complex / The Sea Is Rising, but Not Because of Climate Change
Wednesday, June 13, 2018
SeaFi sets course for marine communications revolution
SeaFi Horizon the future of lighthouses
With ECDIS the future of lighthouses is somewhat compromised.
Ships at sea hardly need anymore lighthouses to find their position at sea.
Once used to flash light at sea, they can easily be turned into a powerful hotspot for ship, from flashing light to wireless marine data communication the conversion is painless...
To prove it we are working at setting a world record for the longest ship to shore marine (big) data marine data communication without assistance from satellite or cellular connection...
From Irish Examiner by Eoin English
A marine engineer and inventor has set what he hopes could be a world record for the longest ship-to-shore email using his own special WiFi system.
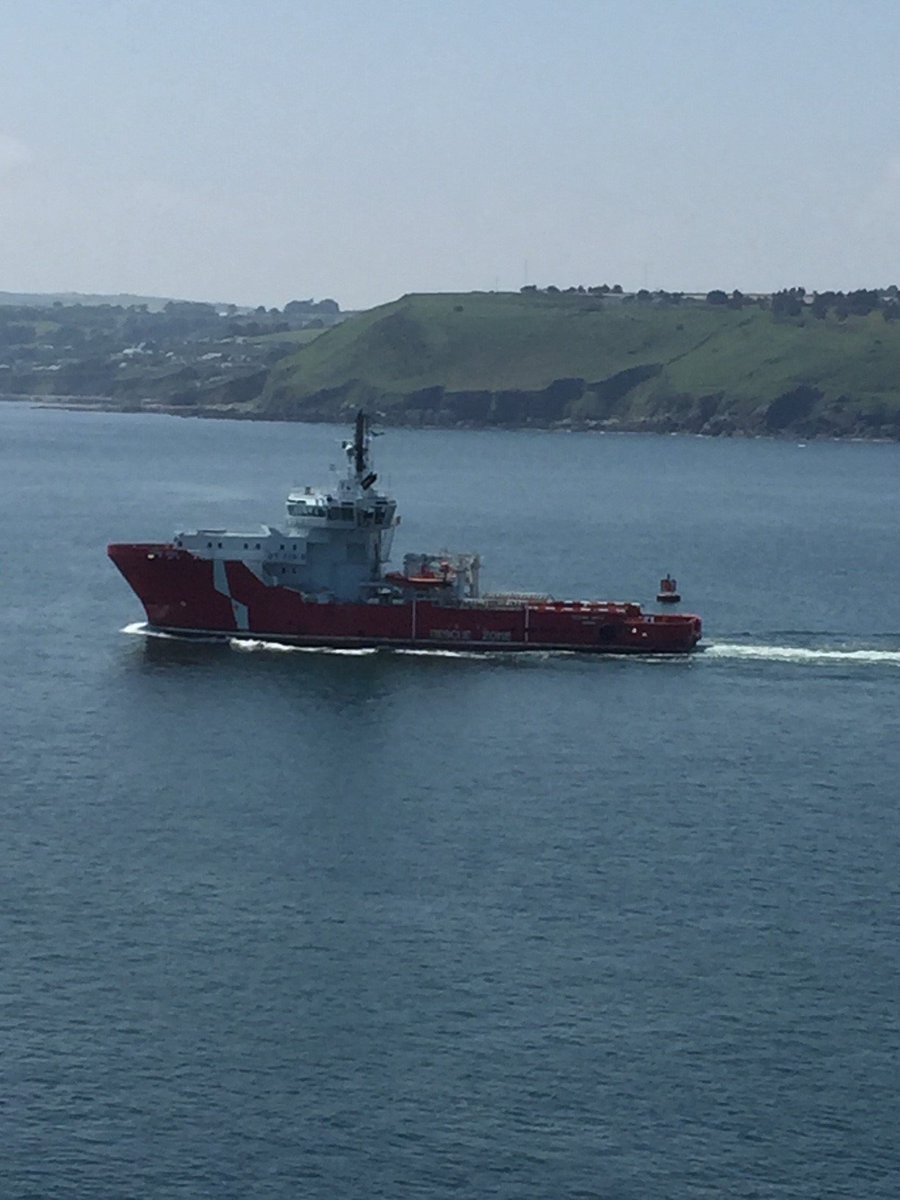
The Ocean Spey vessel just passed Roches Point Lighthouse
While 200 metres is considered long-distance in most ordinary WiFi networks, like a modern-day Marconi, Arnaud Disant used his SeaFi network to send an email at 4.18pm yesterday from a ship about 15.5 nautical miles, almost 29km, off Roche’s Point in Cork Harbour to a computer in the Roche’s Point lighthouse.

Lt Cdr Martin Brett email setting out a distance of 19.4 nautical miles...
The email, which included data and maps charting the vessel’s precise location, was sent without any support from satellites or cellular network.
And just as Marconi’s pioneering work in the early 1900s on long-distance radio transmission led to the telegraph system and ultimately radio, Mr Disant hopes his work will lead to a revolution in marine communications.
“People have little interest for marine telecommunications. It’s not trendy,” he said.
“Beside few people have ever spent more than a few hours at sea — heading to the UK or France on a car ferry is as far as it gets. And who needs to keep in touch with the office while heading on holiday?
“So understanding the needs for modern data communication at sea is really remote for most people.
“But SeaFi is something that could put Ireland on the forefront of modern marine technology. It really takes Marconi into the 21st century.”
Mr Disant, a lecturer in marine data communication at the National Maritime College of Ireland, founded SEATech Evolution in 2007, a company which specialises in network infrastructure and electronic engineering.
The firm has spent the last decade developing SeaFi.

Official distance of the furthest maritime broadband transmission without satellite or cellular network using SeaFi wireless maritime communication system: 19.4 nautical miles (35.9 kilometres). The world record was established on 6 June 2018
The key to the system is powerful ship antennas which transmit wirelessly and securely over a private wireless network to special receiving shore antennas, one of which is attached to the Roche’s Point lighthouse.
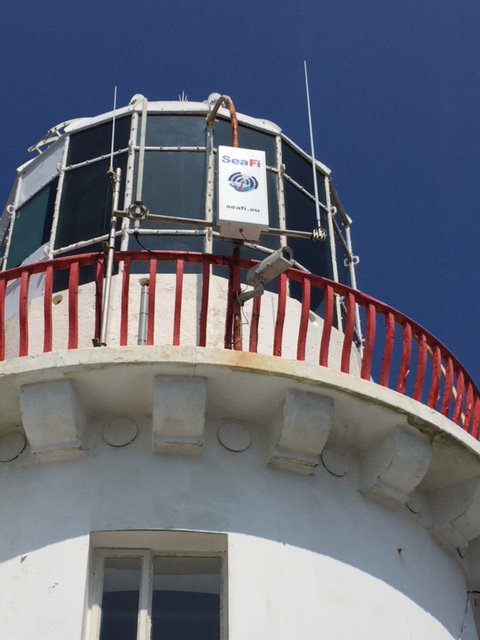
Roche’s Point lighthouse
“To put it simply, WiFi is more like a bare light bulb while SeaFi is more like a focused flashlight,” said Mr Disant.
The system has been tested successfully for the last few years in Cork Harbour in a partnership with the Port of Cork.
The LE Orla and LE Niamh helped test SeaFi ship antennas in seagoing conditions.
SeaFi is the main link to shore for the Port of Cork’s vessels, MV Denis Murphy and MT Gerry O’Sullivan; is used by crews of cruise ships visiting Cork; and has been successfully tested on a data buoy for two years.
Its network covers the navigational areas from 10 nautical miles off Roche’s Point all the way up the river Lee to Tivoli Dock container terminal.
It has been tested to a distance of 15 nautical miles and has achieved constant speeds of between five and 15 mbps — about three times faster than real 3G speeds and five times faster than the latest generation of satellite communications, and at a fraction of the costs.
And while final confirmation is expected today, it is believed Mr Disant sent his last ship-to-shore email yesterday as Ocean Spey sat just over 15.5 nautical miles off Roche’s Point.
The record attempt was witnessed by several independent experts both on board and on shore.
A raft of technical data will now be submitted to the Guinness Book of Records for consideration.
Links :
- SeaTech : Furthest maritime broadband transmission without satellite or cellular network
- GeoGarage blog : S@iLink, stay connected at sea !
Tuesday, June 12, 2018

‘Unofficial Charts’ on the horizon?

Atlantic Ocean (1786)
Dépôt général des Cartes Plans et journaux de la Marine publiée par ordre du Ministre pour le service des vaisseaux Français
From Hydro by Gilles BesseroIn the article entitled ’How Blockchain Will Have an Impact on Navigation’ published in the March/April 2018 issue of 'Hydro International', Gert Büttgenbach explains how the new blockchain technology could be potentially beneficial for the production and distribution of nautical charts.
One of the conclusions of the article indicates that the new technological environment calls for reconsidering the ’exclusive domain of national Hydrographic Offices’ (HOs) and suggests that the private sector could in future produce ‘unofficial charts’ that would be superior to ’official’ charts produced by the HOs.
But these views reflect a misunderstanding of the situation, according to Gilles Bessero.
I believe that encouraging the community to think about the impact of new technologies is always a good thing, especially in an environment that is often considered, whether rightly or wrongly, as rather conservative.
The question as to which organizations should be entrusted with the production of nautical charts as a key enabler of safe navigation is the subject of recurrent debate.
As a matter of fact, this was originally an activity run mostly by private chartmakers and chart information was considered a trade secret.

Detailed Depot De La Marine's sea chart of the region centered on Jamaica, with the southern part of Cuba and western end of Hispaniola.
This detailed map of Jamaica, shown divided into parishes, includes strong topographical details with many coastal toponyms, as well as the coastlines of southern Cuba and western Haiti.
This detailed map of Jamaica, shown divided into parishes, includes strong topographical details with many coastal toponyms, as well as the coastlines of southern Cuba and western Haiti.
The Dépôt de la Marine, known more formally as the Dépôt des cartes et plans de la Marine, was the central charting institution of France.
The centralization of hydrography in France began in earnest when Jean-Baptiste Colbert became First Minister of France in 1661.
Under his watch, the first Royal School of Hydrography began operating, as did the first survey of France’s coasts (1670-1689).
In 1680, Colbert consolidated various collections of charts and memoirs into a single assemblage, forming the core of sources for what would become the Dépôt.
The Dépôt itself began as the central deposit of charts for the French Navy.
The Dépôt itself began as the central deposit of charts for the French Navy.
In 1720, the Navy consolidated its collection with those government materials covering the colonies, creating a single large repository of navigation.
By 1737, the Dépôt was creating its own original charts and, from 1750, they participated in scientific expeditions to determine the accurate calculation of longitude.
In 1773, the Dépôt received a monopoly over the composition, production, and distribution of navigational materials, solidifying their place as the main producer of geographic knowledge in France.
In 1773, the Dépôt received a monopoly over the composition, production, and distribution of navigational materials, solidifying their place as the main producer of geographic knowledge in France.
Dépôt-approved charts were distributed to official warehouses in port cities and sold by authorized merchants.
The charts were of the highest quality, as many of France’s premier mapmakers worked at the Dépôt in the eighteenth century, including Philippe Bauche, Jacques-Nicolas Bellin, Rigobert Bonne, Jean Nicolas Buache, and Charles-François Beautemps-Beaupré.
The Dépôt continued to operate until 1886, when it became the Naval Hydrographic Service.
The Dépôt continued to operate until 1886, when it became the Naval Hydrographic Service.
In 1971, it changed names again, this time to the Naval and Oceanographic Service (SHOM).
Although its name has changed, its purpose is largely the same, to provide high quality cartographic and scientific information to the France’s Navy and merchant marine.
France was the first country to establish a national Hydrographic Office in 1720.
The rationale behind this initiative was that more warships were being lost at sea because of lack of access to charts than in combat.
The benefit of assigning a dedicated public organization to the task of collecting all available information, compiling it and making it available through ’official’ nautical charts was progressively recognized and all maritime nations followed the lead of France more or less rapidly.
Some private chartmaking continued into the 20th century but it was generally focused on the specific needs of the leisure market.
The obligation for ships to carry adequate and up-to-date nautical charts and publications was introduced in the International Convention for the Safety of Life at Sea (SOLAS) of 1974 (regulation V/20) but the provisions related to the production of adequate nautical charts and publications were left at the discretion of the Contracting Governments.

Carte de la rade de Brest en 1779.

Chart of Brest with the GeoGarage platform (SHOM 2018)
In the late 1980s, the advent of the digital era created a new opportunity for private entrepreneurs who were keen to develop electronic chart systems (ECS) and proposed digital nautical charts generally obtained simply through digitising the paper charts produced by HOs.
When the progress of ECS technology led to the consideration of using such systems not only as navigation aids complementing paper charts but as meeting as such the SOLAS chart carriage requirement, the International Maritime Organization adopted Performance Standards for Electronic Chart Display and Information Systems (ECDIS) in 1995.
Considering the liability aspects, the Performance Standards included a provision that the associated Electronic Navigational Charts (ENCs) had to be issued ’on the authority of government-authorized hydrographic offices’.
This provision was refined in the amendments to the SOLAS Convention that were adopted in 2000 and entered into force on 1 July 2002.
These amendments include a definition of a nautical chart or publication as ’a special-purpose map or book, or a specially compiled database from which such a map or book is derived, that is issued officially by or on the authority of a Government, authorized hydrographic office or other relevant government institution and is designed to meet the requirements of marine navigation.’ (regulation V/2.2).
They include also the requirement that ’Contracting Governments undertake to arrange for the collection and compilation of hydrographic data and the publication, dissemination and keeping up to date of all nautical information necessary for safe navigation.’ (regulation V/9).
Now it is up to each Contracting Government to decide which arrangements best suit its circumstances.
The requirement is solely that nautical charts and publications should be produced on the authority of a Government and this is justified by the liability issue, noting the extent and cost of the damages that could be caused by a ship’s grounding due to a charting error.
As explained in Publication M-2 of the International Hydrographic Organization on ’The need for hydrographic services’, ’Coastal States can satisfy their hydrographic needs and obligations through a variety of arrangements (…).
The use of bilateral arrangements with established Hydrographic Services and the use of commercial contract support are alternatives to establishing a full in-country Hydrographic Service.’
The reality is that a number of HOs do outsource production activities to the private sector.
Therefore, one should not oppose HOs versus the private sector and ’official’ versus ’unofficial’ charts but encourage both sides to imagine together the most efficient ways to improve future ’official’ charts for which governments continue to accept full responsibility.
In that perspective, it is worth noting that HOs are evolving from a traditional chart-centric model to a data-centric model in order to address the variety of hydrographic requirements associated with all human activities that take place in, on or under the sea and support the sustainable development of the oceans.
This means that delivering a portfolio of nautical charts covering the waters of a country is no longer an end in itself but one of the many applications of a national marine spatial data infrastructure that must be considered as a public good.
The private sector can and should play a major role in developing tools to manage efficiently the MSDI as well as in inventing and developing a variety of value-added products and services derived from that infrastructure.
But as long as shipping remains a significant component of the world trade infrastructure, there will continue to be a substantiated need for ’official’ nautical charts.
What rules apply to migrants rescued at sea?

Photo: Karpov/SOS Mediterranee/AFP
From The Local by AFP
In the standoff between Italy and Malta over a migrant ship stranded in the Mediterranean, both have insisted on their right to refuse a vessel entry to their ports.
Although Spain offered safe harbour to the boat and the 629 migrants on board, the episode has raised questions about a country's legal obligations towards those rescued at sea.
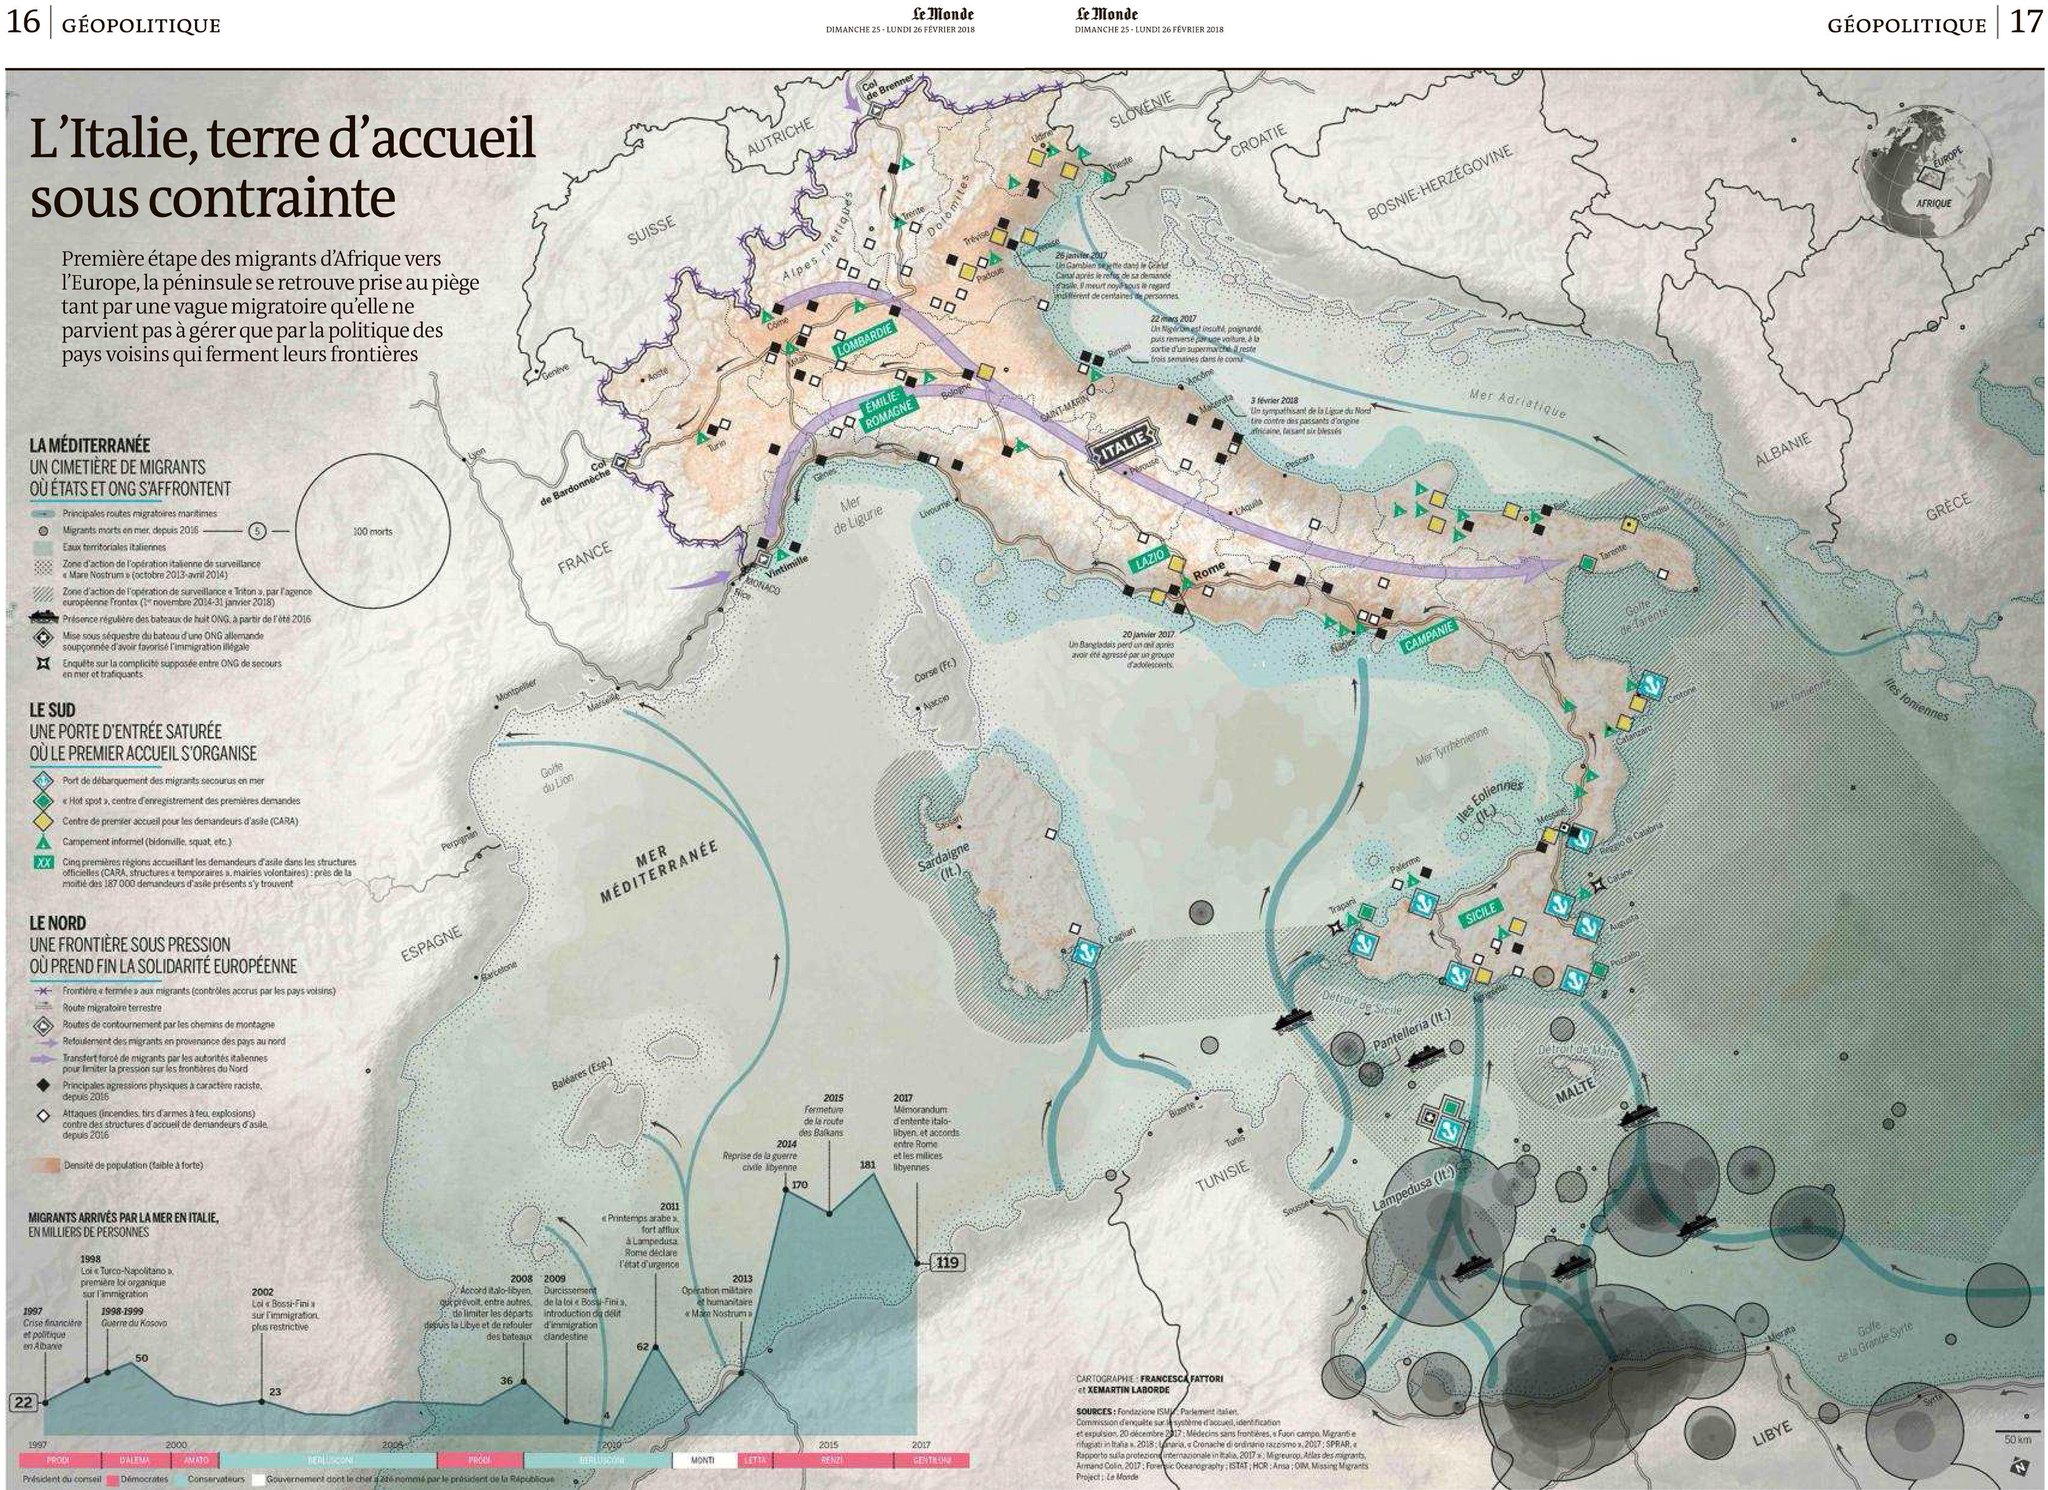
courtesy of Le Monde (Francesca Fattori & Xemartin Laborde)
Here are a few key questions.
Are the rules clear?
Generally speaking, no.
"International maritime law does not provide for specific obligations which would determine in all cases which state is responsible to allow disembarkation on its territory," the United Nations refugee agency (UNHCR) says.
But that does not mean a country can simply hold up a stop sign and wash its hands of the situation when a vessel packed with vulnerable migrants approaches its shores. UNHCR also pointed to "key treaties" stating that a nation which has responsibility for an area in which a search-and-rescue operation takes place is required to "exercise primary responsibility" for coordinating the migrants' safe disembarkation.

Photo: Louisa Gouliamaki/AFP
"Regarding disembarkation, states are obliged to cooperate to find a safe place to disembark migrants rescued in their search and rescue area," IOM spokesman Leonard Doyle told AFP, citing legal experts.
What if there's an emergency on board?
This could arguably compel a state to grant access to its ports.
"If the country has control over the ship and there are migrants in dire straights aboard and no agreement with another state to take them can be found, they should not delay but accept them," Doyle said.
In the case of the Aquarius, which is operated by SOS Méditerranée, UNHCR said that the dwindling provisions on board created "an urgent humanitarian imperative" for Italy and Malta to allow the boat to dock.
Spain's intervention later appeared to defuse the crisis.

Photo: Louisa Gouliamaki/AFP
What happens after the migrants disembark?
In an apparent attempt to justify Rome's stance, far-right Interior Minister Matteo Salvini said Italy's new populist government could not be forced to turn the country into "a huge refugee camp".
But UNHCR said letting a boat dock did not mean a country would have to take long-term responsibility for those on board.
"A state which allows disembarkation on its territory of rescued persons – particularly in situations involving large numbers of people – need not, in UNHCR's view, be solely responsible for providing durable solutions on its own territory."
Links :
- MarineLink : International Chamber of Shipping Concern over Italian Policy on Migrants
- WashingtonPost : The Latest: Italy: Today is turning point in EU migration
- Reuters : Italy to ask NATO to help deal with migrant flows: Salvini
- CNN : With 100 killed, Tunisia boat wreck becomes year's deadliest migrant ...
- GeoGarage blog : Greece's island of despair / Mediterranean Sea Rescue / Mediterranean rescuers accuse Europe of 'leaving ... / Mediterranean migrant deaths reach record level in ... / European Union authorizes military action against ... / Migrants can't be left to die in the seas of Europe / SAR crisis in the Mediterranean – commercial ... / A wintry sea seems a safer bet than life at home for ... / Fire at sea (trailer) : shows horror of refugee crossings / A robot life preserver goes to work in the Greek ... / 2016 deadliest year in the Mediterranean / The millionaires who rescue people at sea / Lampedusa, the Italian Island thousands are dying ... / Sea cameras scan the waves for smugglers
Monday, June 11, 2018

The 'dark fleet': Global Fishing Watch shines a light on illegal catches

Global Fishing Watch's new night light vessel detection layer uses satellite imagery from the US National Oceanic and Atmospheric Administration (NOAA) to reveal the location and activity of brightly lit vessels operating at night.
Because the vessels are detected solely based on light emission, we can detect individual vessels and even entire fishing fleets that are not broadcasting AIS and so are not represented in the AIS-based fishing activity layer.

From The Guardian by Justin McCurry
Low light imaging data being used to expose unregulated and unreported fishing on the high seas
New data is being used to expose fleets of previously unmonitored
fishing vessels on the high seas, in what campaigners hope will lead to
the eradication of illegal, unregulated and unreported fishing.
Global Fishing Watch
(GFW) has turned low light imaging data collected by the US National
Oceanic and Atmospheric Administration (NOAA) into the first publicly available real-time map showing the location and identity of thousands of vessels operating at night in waters that lie beyond national jurisdiction.
More than 85% of the “dark fleet” detections include smaller vessels
that are not fitted with transponders and larger ones that have switched
off their tracking systems to avoid detection, according to GFW, which
launched the map on Friday to mark World Oceans Day.
The pink circles on the map represent two fishing vessels in close proximity to one another.
Global
Fishing Watch’s new night light vessel detection layer uses satellite
imagery from the U.S. National Oceanic and Atmospheric Administration
(NOAA) to reveal the location and activity of brightly lit vessels
operating at night.
Because
the vessels are detected solely based on light emission, we can detect
individual vessels and even entire fishing fleets that are not
broadcasting AIS and so are not represented in the AIS-based fishing
activity layer.
The data, collected by the NOAA’s visible infrared imaging radiometer
suite, is being used to track a fleet of about 200 mostly Chinese
vessels at the edge of Peru’s economic exclusion zone.
The monitoring, conducted by GFW, a non-profit organisation
campaigning for greater transparency in the fishing industry, and the
conservation group Oceana, reveals that about 20% of the Chinese vessels
are not broadcasting via automatic tracking systems, raising suspicions
they are operating illegally.
The report on the high seas activity coincides with the launch by GFW
of the first ever real-time view of transshipment, which enables
fishing boats to transfer their catch to refrigerated cargo vessels and
remain at sea for months, or even years, at a time but still get their
catch to the market.
“By harnessing big data and artificial intelligence, we’re able to
generate a clearer view into the often shady practice of transshipment,”
said Paul Woods, chief technology officer at GFW.
“This data is now freely available to governments, NGOs and academia
to use and interrogate, and support global efforts to strengthen
monitoring and enforcement to eradicate illegal fishing.”
Four countries – China,
Taiwan, Japan and South Korea – account for well over two-thirds of
high seas fishing, including 500 vessels belonging to Japan’s distant
water fleet.
“If you could get the North Asian countries fully engaged in
strengthening regulation of high seas fisheries, you would go a long way
towards solving the problem,” said Quentin Hanich, head of the
fisheries governance research programme at the Australian National
Centre for Ocean Resources and Security.
Global Fishing Watch’s new encounters layer reveals for the first time where and when thousands of vessels are involved in close encounters at sea.
To detect pairs of vessels meeting at sea, analysts applied machine learning algorithms to more than 30 billion Automatic Identification System (AIS) messages from ocean-going boats to find tell-tale transshipment behaviour, such as two vessels alongside each other long enough to transfer catch, crew, or supplies.
As a major market for Chinese processed and re-exported seafood, Japan is well placed to use its influence to improve traceability and transparency, Hanich added.
“China is still in an expansionist stage when it comes to high seas
fisheries, and it’s still reluctant to agree to many of the types of
measures we need to put in place,” he told the Guardian.
“Japan really is the pathway to bringing China in. It’s crucial that we collaboratively develop high seas governance that China is fully engaged in.”
“Japan really is the pathway to bringing China in. It’s crucial that we collaboratively develop high seas governance that China is fully engaged in.”
The need for fleets to cut fuel and other costs was highlighted in a
new report claiming that fishing in more than half the world’s high seas
fishing grounds would be unprofitable without billions of dollars in
government subsidies.
“Governments subsidised high seas fishing with $4.2bn in 2014, far
exceeding the net economic benefit of fishing in the high seas,” said
the report, published this week in the journal Science Advances.
Its lead author Enric Sala, a National Geographic
explorer-in-residence, said: “Governments are throwing massive amounts
of taxpayer money into a destructive industry.”
Links :
- GlobalFishingWatch : Close encounters of the fishy kind
- VentureBeat : Global Fishing Watch tracks ocean poachers with the help of AI
- NewsDeeply : New Technology Is Lighting Up ‘Dark’ Fishing Fleets
- GeoGarage blog : High seas fishing isn’t just destructive—it’s unprofitable
Sunday, June 10, 2018
Empties : Nazaré
A portrait of the Ocean.
Giant Swells emerge from Winter Storms of the North Atlantic, they travel thousands of miles south and converge into a 16,000ft deep underwater canyon, retaining their full potential as they approach the shore.
Each Wave tells a story, with it’s own color, shape, expression and details.
It’s a long journey, culminating in a raw display of power on the Coast of Nazaré.
It’s a long journey, culminating in a raw display of power on the Coast of Nazaré.
This rare set of circumstances creates the biggest and gnarliest waves on the planet.
Subscribe to:
Posts (Atom)