A sizeable shoal of Sardines proves to be quite a magnet for a variety of different sea predators. Surprisingly, none of the predators on display attack each other, instead they corral the ball of fish, taking turns to eat.
Saturday, May 18, 2024
Friday, May 17, 2024
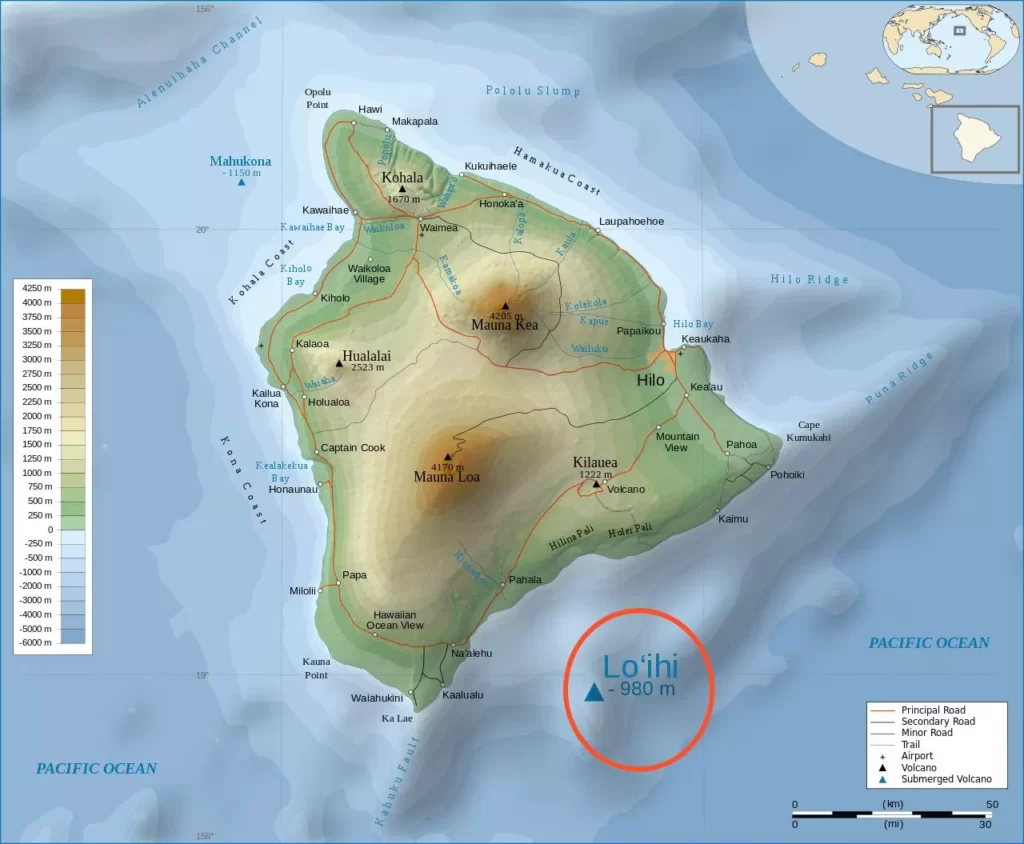
The underwater geology of the Hawaiian Islands is simply incredible
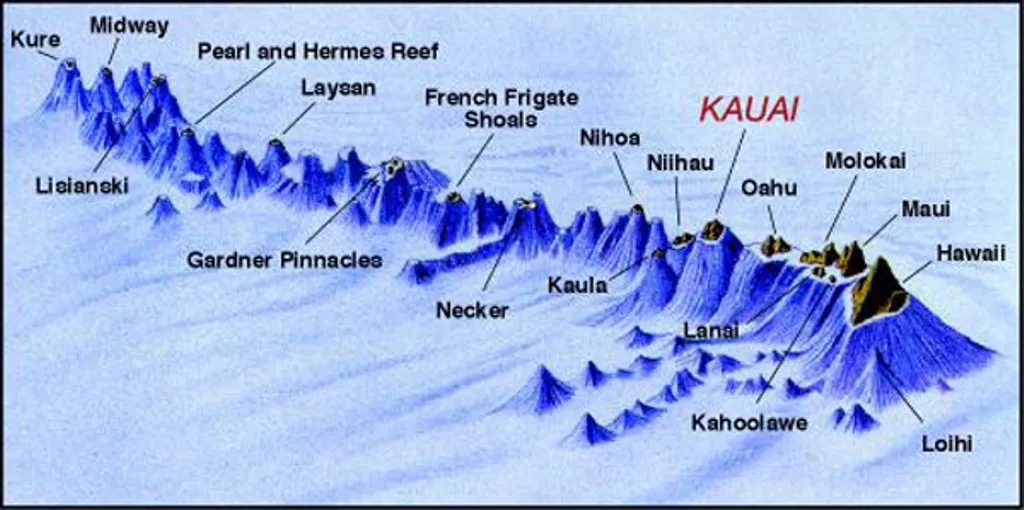
The
Big Island is now the biggest landmass in the Hawaiian island chain
(although this may alter over time), followed by the other seven main
islands at the chain’s eastern end, from west to east: Ni’ihau, Kaua’i,
Oahu, Molokai, Lanai, Kahoolawe, and Maui.
Hawaiiian islands. Source
From Hasan
The Pacific Plate is migrating northwestward at a rate similar to that of your fingernails – several millimeters each year.
The Pacific Plate is migrating northwestward at a rate similar to that of your fingernails – several millimeters each year.
This continuous plate movement over a local volcanic “hot spot,” or plume, has resulted in an assembly-line-style chain of volcanic islands.
They are known (really) as Hawaii.

Source: Hawaii Guide
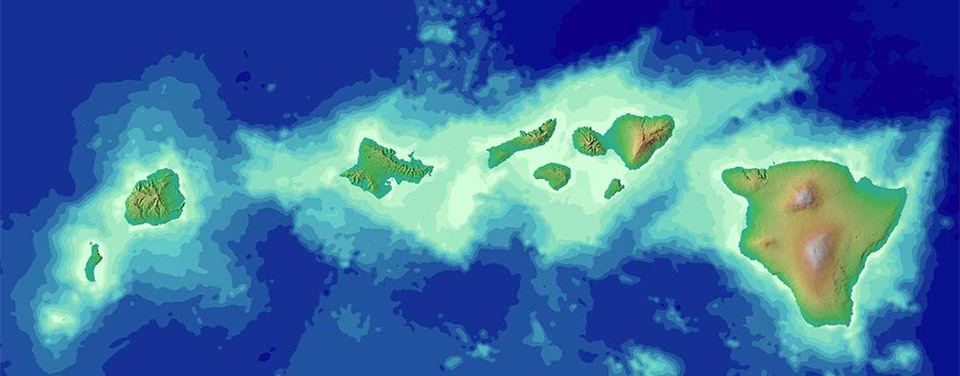
The Hawaiian Islands (also known as the Hawaiian archipelago) are made up of eight major islands and 124 islets that run 1,500 miles northwest from the Big Island of Hawaii to Japan and the Aleutian Islands of Alaska, at the centre of the “Pacific Plate” on top of a “hot spot.”
The islands have a combined size of 6,459 square miles.
Hawaii, the newest island in the chain, sprang from the seafloor over a million years ago as five different volcanoes.
Hawaii, the newest island in the chain, sprang from the seafloor over a million years ago as five different volcanoes.
By erupting repeatedly, the five volcanoes formed thin layers of lava that built up over time, until the volcanic heads rose from the water – eventually becoming today’s Hawaii.
But how did five volcanoes come together to form one island?
But how did five volcanoes come together to form one island?
They most likely erupted at separate periods, causing flows that merged with the flows of the other mountains, eventually resulting in the five summits constituting the singular island we see today.
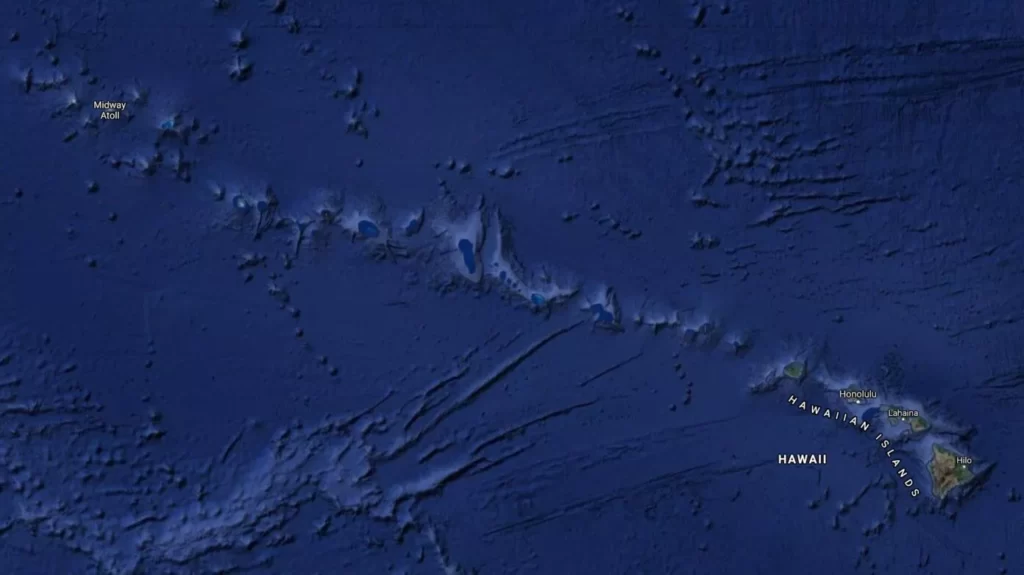
The Hawaiian chain. Image credit: Google Maps


By siting above the ‘hot point’ on the plate, the Kohala Mountains were the first to develop.
The position of the rising magma altered as the plate migrated, going to Mauna Kea, Hualalai, Mauna Loa, and finally Kilauea.
Since then, the procedure hasn’t slowed down! Loi’hi, the newest seamount, is now developing off the Big Island’s southeast coast (see second map above and read more about Loi’hi below).
Since then, the procedure hasn’t slowed down! Loi’hi, the newest seamount, is now developing off the Big Island’s southeast coast (see second map above and read more about Loi’hi below).
In another 50,000 years or so, it might become the next Hawaiian island, or it could even join the Big Island’s sixth peak.
Only the volcanic relics of Kohala are still active and will never erupt again.
The remainder of the Big Island’s volcanoes aren’t nearly ready yet!
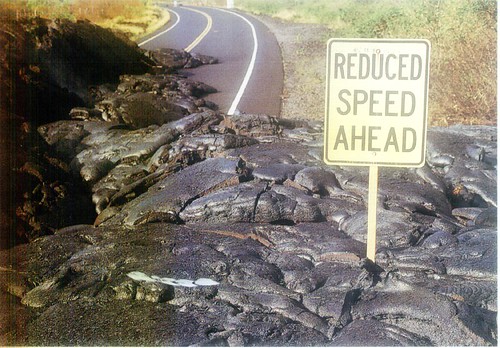
Lava flow on Hawaii Island: Photo: adam79
Mauna Loa, the Big Island’s biggest volcano, covers about 51 percent of the island. Even yet, most people have a difficult time identifying it since the shield form makes it difficult to discern if you’re looking at a real mountain.
In fact, all of Hawaii’s volcanoes are called “shield volcanoes” because of their likeness to a warrior’s shield.
Molten lava rises from a hot place in the Earth’s crust and erupts from different vents and rifts on the surface, finally flowing down the gentle slopes into the ocean, layer by layer, over millions of years.
 The shield-shaped Mauna Loa volcano on Big Island, Hawaii.
Photo: Gordon Joly
Kilauea, the world’s most active volcano and home to the fire-goddess Pele, is located on the eastern slopes of Mauna Loa.
Kilauea was once thought to be a vent of Mauna Loa, but it has now been discovered that it has its own magma chamber and is fully independent of its bigger relative.
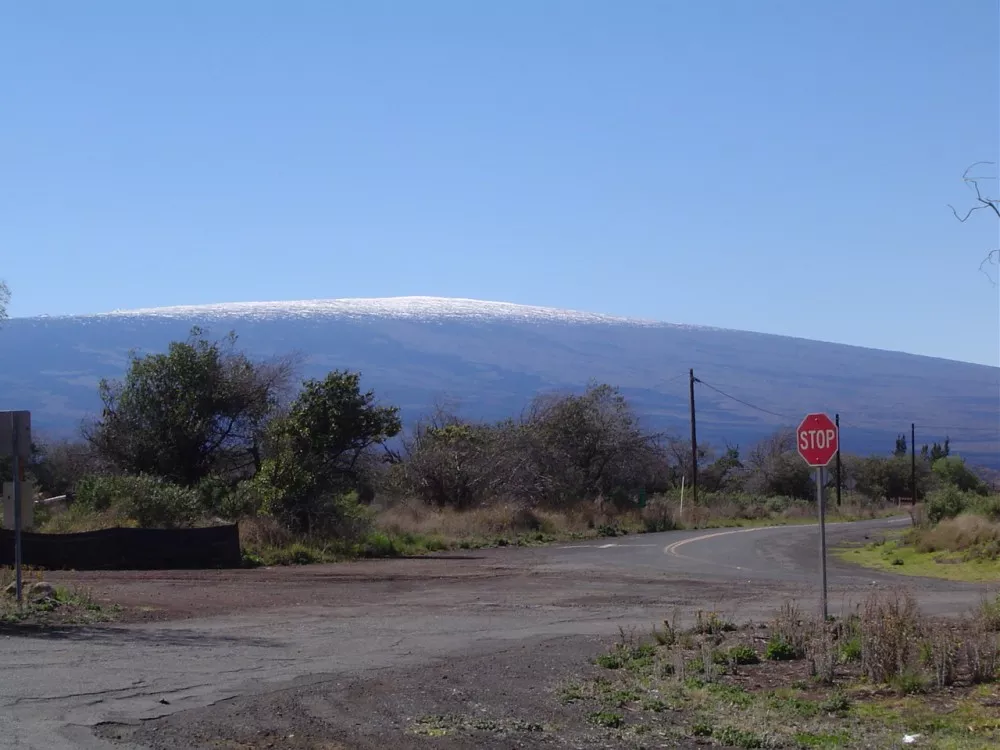
Mauna Kea, the island’s other main volcano, covers nearly a quarter of the island’s entire landmass. Mauna Kea is more simpler to detect than Mauna Loa, and is easily identified in the winter months by its snowy crown, which is how it received its name (Mauna Kea meaning “White Mountain”).
Mauna Kea, the island’s other main volcano, covers nearly a quarter of the island’s entire landmass. Mauna Kea is more simpler to detect than Mauna Loa, and is easily identified in the winter months by its snowy crown, which is how it received its name (Mauna Kea meaning “White Mountain”).
Now here’s an unusual statistic about this volcano: it is the highest point in the Pacific Ocean and the world’s tallest mountain from base to peak, reaching a total elevation of 33,000 feet above the sea bottom, of which only 13,780 (approx.) feet exist above sea level!
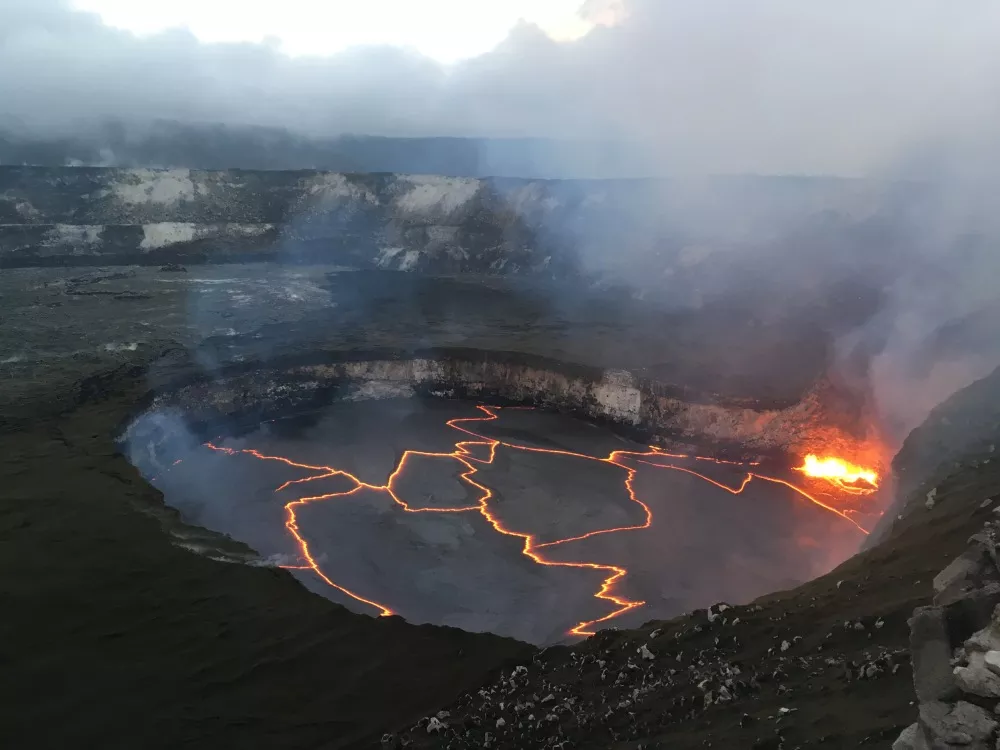
An early evening view of Halema‘uma‘u crater on Jan. 30 at the summit of Kilauea volcano, when the lake level was 88 feet below the crater floor.
Photo: M.Patrick/USGS
 Kīlauea volcano erupts.
Photo: USGS
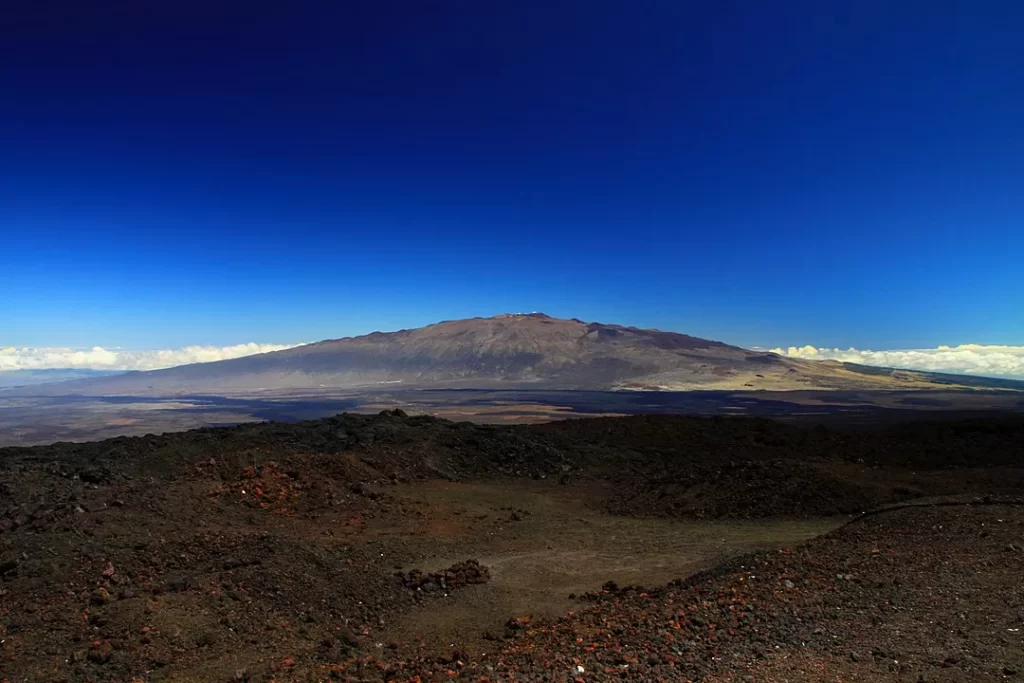 View of Mauna Kea from Mauna Loa observatory. Big island, Hawaii.
 Photo: Nula666
Hualalai near Kailua-Kona on the west side of the island and Kohala on the northwest point of the island are the other volcanic mountains on the Big Island.
Kohala, the island’s oldest peak, has far greater geological damage than its younger cousins.
The incredible sea cliffs you see now were most likely formed by a massive landslide 200,000 years ago.
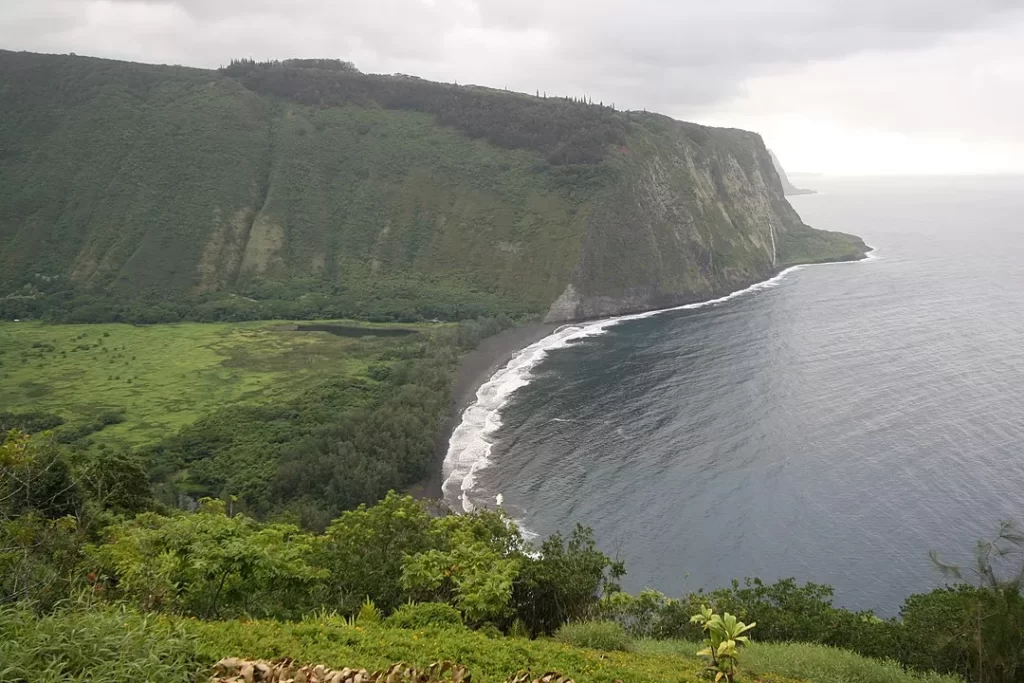 Waipiʻo Valley, the most prominent valley cutting into the Kohala volcano’s flank, with sea cliffs in the background.
Photo: Paul Hirst
The submarine volcano known as Lo’ihi is located just 18 miles off Hawai’i’s southeast coast, as previously noted.
Lo’ihi is a seamount that is now erupting at a depth of 3,178 feet below the ocean’s surface.
When Lo’ihi rises from the sea, it will most likely combine with Kilauea (which, in theory, will be considerably larger by then) to become the sixth peak on Hawai’i’s biggest island.
When Lo’ihi rises from the sea, it will most likely combine with Kilauea (which, in theory, will be considerably larger by then) to become the sixth peak on Hawai’i’s biggest island.
That won’t happen quickly, though; it’ll probably take 50,000 years or more. So hold off on booking your hotel stay.
The submarine volcano known as Lo’ihi is located just 18 miles off Hawai’i’s southeast coast, as previously noted.
Lo’ihi is a seamount that is now erupting at a depth of 3,178 feet below the ocean’s surface.
When Lo’ihi rises from the sea, it will most likely combine with Kilauea (which, in theory, will be considerably larger by then) to become the sixth peak on Hawai’i’s biggest island.
When Lo’ihi rises from the sea, it will most likely combine with Kilauea (which, in theory, will be considerably larger by then) to become the sixth peak on Hawai’i’s biggest island.
That won’t happen quickly, though; it’ll probably take 50,000 years or more.
So hold off on booking your hotel stay.
Geologists think Haleakala formerly formed a continuous landmass with Lanai, Molokai, and Kahoolawe – known as Greater Maui – not just to the west of Maui, but also to the east (Maui Nui).
Geologists think Haleakala formerly formed a continuous landmass with Lanai, Molokai, and Kahoolawe – known as Greater Maui – not just to the west of Maui, but also to the east (Maui Nui).
The submergence of that landmass caused the volcanic body to move away from the Hawaiian hot spot, causing significant chunks of the Big Island to vanish into the Pacific.
The four big islands that we see now are the outcome of this process.
 Satellite view of Hawaii archipelago.
Image source: NASA
The Big Island faces a similar destiny.
The Big Island will succumb to subsidence and erosion as the Pacific Plate takes the islands piggyback-style to the north-west and the hot point “moves away,” eventually meeting the same fate as Maui Nui. As the ocean encroaches on the sides of each individual mountain, it will split into smaller islands.
The Big Island, on the other hand, will maintain that size for the next several thousand years!
The Big Island, on the other hand, will maintain that size for the next several thousand years!
Mauna Loa and Kilauea volcanoes are continually active and erupting, therefore Hawaii’s island is still growing.
The islands’ geologic future is still being formed.
The islands’ geologic future is still being formed.
Links :
Thursday, May 16, 2024
Climate change is slowing Earth’s rotation
 Unfrozen in time
photo: getty images
From The Economist
This simplifies things for the world’s timekeepers
The perfect day should have 86,400 seconds: 24 hours for Earth to spin around its axis, 60 minutes in each hour, and 60 seconds in each minute.
But the apparent precision of these simple calculations ignores the messy reality of planetary bodies.
Tidal forces, combined with the roiling currents in Earth’s core and the redistribution of ice sheets at its surface, cause the planet’s rate of spin to vary ever so slightly from year to year.
Custodian Ray Keen inspects a clock face before changing the time on the 100-year-old clock atop the Clay County Courthouse Saturday, March 8, 2014, in Clay Center, Kan.
For the first time in history, world timekeepers may have to consider subtracting a second from our clocks in a few years because the planet is rotating a tad faster.
(AP Photo/Charlie Riedel, File)
This irritant was scotched in 1967 with the definition of a new second, derived from the vibrations of caesium atoms inside uber-precise atomic clocks.
The two seconds, solar and atomic, are almost exactly equivalent.
But not quite.
The leap year 1972, for example, should have had 31,622,400 seconds.
Reckoned by atomic seconds, however, Earth’s full journey around the sun took 31,622,401.14.
As a result, two additional seconds were added: the very first “leap seconds”.
One, on June 30th that year, made up for the lag; the second anticipated an impending additional one.
It was added to the very last minute of the year’s very last day.

chart: the economist
For a while, leap seconds were a regular fixture.
Between 1972 and 2016, there were 27.
Owing to a gradual acceleration in Earth’s spin that has allowed solar seconds to catch up with atomic ones, there have not been any since.
In fact, within the next few years the time nerds of the International Earth Rotation Service (iers), the body that decides when leap seconds should fall, may need to implement an entirely novel “negative leap second”.
On some future December 31st, in other words, the stroke of midnight will follow a 59-second minute.
Such adjustments are a vexing prospect for organisations reliant on perfect timekeeping, from stockmarkets to power grids.
But a new study suggests that climate change will buy them some welcome extra time.
In a paper published in Nature last month, Duncan Agnew, a geophysicist with an interest in timekeeping at the University of California in San Diego, disentangled the various factors that are causing Earth’s spin to accelerate.
To do so, he used a range of data sources including laser measurements of the distance between Earth and the Moon, disturbances to Earth’s gravity, and records of ancient eclipses.
Partly responsible for the recent speed-up, he concluded, are the currents that ripple through Earth’s molten core.
The melting of the polar ice sheet since the end of the last ice age, 12,000 years ago, has also made Earth spin faster.
Their weight squashed the poles; their subsequent disappearance allowed Earth’s crust to rebound and become more spherical.
This caused an acceleration in the planet’s spin, an effect familiar to skaters tucking in their arms to rotate faster.
Dr Agnew also found effects pulling in the other direction.
In recent decades, climate change has been shrinking the Greenland and Antarctic ice sheets, shifting water mass off the land and into the oceans where it can be redistributed.
By reducing both regions’ mass, the melt decreases their gravitational pull, with the net effect of “pushing” water away from their shores.
Water lost from the Greenland ice sheet ends up pooling most noticeably around the equator and in the southern hemisphere.
The opposite, more or less, is true for water released from the Antarctic ice sheet.
Glaciologists who have tracked how all this water mass moves around from land to oceans have consequently found a shift away from the poles and towards the equator.
That means Earth’s waistline is thickening, says Jonathan Bamber, a glaciologist at the University of Bristol.
The effect is not huge—it is measured in millimetres per year—but is nonetheless enough to exert a braking effect on Earth’s spin.
Not a second too soon
It is also delaying the need for a negative leap-second.
Without climate change, current trends suggest iers will need to implement one within just two years.
Dr Agnew’s calculations suggest they have until 2029.
That time will allow software engineers running systems reliant on the precision of atomic clocks to devise new programs capable of handling the negative leap second.
Alternatively, as some have suggested, iers could use that time to eliminate the concept entirely.
Solar seconds and atomic ones are already allowed to differ by one second.
Extending that tolerance to one minute would probably eliminate the need for leap seconds of all kinds for decades to come.
For timekeepers the world over, that day may be as close to perfect as it is ever possible to get
Links :
- Scientific America : Global warming is slowing the Earths'rotation
- Popular Mechanics : Earth’s Rotation Is Alarmingly Slowing Down
- Fast Company : Climate change is slowing Earth’s rotation. Here’s what that means for the length of our days
- Smithsonian : Melting Polar Ice Sheets Are Slowing Earth’s Rotation. That Could Change How We Keep Time
- Forbes : Earth Is Suddenly Slowing And Days Now Last Longer, Scientists Say
- WP : Climate change is altering Earth’s rotation enough to mess with our clocks
- CNN : Polar ice is melting and changing Earth’s rotation. It’s messing with time itself
- Space : Climate change and polar ice melting could be impacting the length of Earth's day
- Phys : Why do we need a leap second? A physicist explains what is messing with the Earth's rotation / Climate change is messing with how we measure time: Study
- ZME Science : Melting polar ice is changing Earth’s rotation and slowing down time. Here’s how this will affect the leap second
Wednesday, May 15, 2024
Understanding the coastal zone’s multiple dimensions with DEA Intertidal product suite

From DEA
The new Digital Earth Australia Intertidal product suite captures Australia’s dynamic coastal regions in unprecedented detail
Digital Earth Australia (DEA) has launched a new intertidal product suite that will help better characterise and understand the strand between land and sea, including the ability to map this complex zone in multiple dimensions.
DEA’s intertidal products have been used across government and industry.
With the release of our next generation product suite, DEA Intertidal , it will become the first DEA product to incorporate Landsat and Sentinel-2 data.
DEA Intertidal maps the changing elevation, exposure and tidal characteristics of Australia’s exposed intertidal zone.
The product suite provides an annual 10m resolution elevation product for the intertidal zone, enabling users to better monitor and understand some of the most dynamic regions of Australia’s coastlines.

Before and after: See the enhanced detail in this comparison between the timeseries models of DEA Intertidal Elevation Model (also known as the National Intertidal Digital Elevation Model or NIDEM) and the new DEA Intertidal.

DEA Intertidal core product layers (left to right): Elevation, with low elevation values shown in dark colours and high elevation shown in light colours; Elevation Uncertainty, with high uncertainty shown in light colours, and; DEA Intertidal Exposure, showing percentage of time regions of the intertidal zone are exposed, with low exposure values (i.e.
rarely exposed pixels) shown in dark colours.
rarely exposed pixels) shown in dark colours.
“Our latest product suite adds a temporal component to the elevation product for the intertidal zone,” said Stephen Sagar, manager of the Coastal Environments team in DEA.
“That means DEA Intertidal will enable users to better monitor and understand some of the most dynamic regions of Australia’s coastlines.”
Utilising an improved tidal modelling capability, the product suite includes continental-scale mapping of intertidal exposure over time, enabling scientists and managers to integrate the data into ecological and migratory species applications and modelling.
This kind of data can shed light on the changing extents and availability of foraging grounds for endangered species, such as migratory shore birds that use Australian intertidal mudflats as a stopover on global migrations.
Earlier iterations of the DEA Intertidal products, such as the DEA Intertidal Elevation Model (also known as the National Intertidal Digital Elevation Model or NIDEM), are already widely used to measure the interface between land and sea, a highly dynamic and difficult to access zone.
NIDEM was the first 3D model of Australia’s intertidal zone.

DEA Intertidal Elevation mapped across Dugong Bay in the Kimberley, Western Australia (left) and an aerial view of Dugong Bay (right).
With the new time series data included in our latest product suite, DEA Intertidal can assist with understanding how Australia’s coastlines have changed over time, and potentially how they will continue to evolve into the future.
“DEA Intertidal will provide baseline elevation data to monitor changing patterns of erosion and sediment movement, and coastal hazard impacts from extreme weather and inundation events,” said Robbi Bishop-Taylor, co-lead of the project from the Coastal Environments team in DEA.
Australian intertidal areas support a vast array of habitats and species that are dependent on the conditions of these unique environments.
The DEA Intertidal product suite has been expanded to include continental-scale mapping of intertidal exposure over time, enabling scientists and managers to integrate the data into ecological and migratory species applications and modelling.
“Intertidal environments are diverse and contain many important ecological habitats such as sandy beaches, tidal flats, rocky shores, and reefs,” said Claire Phillips, co-lead of the project, adding that the environments also provide many valuable benefits such as carbon storage and natural resources.

Seven years of migrating sand banks and tidal flats near Cape Capricorn, Queensland.
You can use DEA Intertidal to create 3D maps over time to examine these ever-changing environments.
Compared with earlier static versions of our Intertidal products, we can now visualise the shifting sands of these dynamic regions of Australia’s coast.
You can use DEA Intertidal to create 3D maps over time to examine these ever-changing environments.
Compared with earlier static versions of our Intertidal products, we can now visualise the shifting sands of these dynamic regions of Australia’s coast.
Intertidal zones face increased threats from natural and man-made influences, including coastal erosion, land reclamation such as port construction, and sea level rise.
Given this region is already in constant flux, DEA Intertidal is a necessary tool for recording and understanding these changes with accurate, up-to-date elevation data describing the changing topography and extent of these environments.
DEA Intertidal interactive map
Visit DEA Maps to get the full interactive map with DEA Intertidal and other DEA products.
Other advances delivered with DEA Intertidal
The DEA Intertidal product suite is the next generation of intertidal products developed in DEA.
It combines data from both Landsat and Sentinel-2 satellite sensors, leveraging our approach of combining time-series Earth observation data with tidal modelling to create continental-scale products for the intertidal region, and supersedes the DEA Intertidal Elevation Model (NIDEM).
The DEA Intertidal suite fundamentally changes the way the intertidal zone is modelled when compared to the original NIDEM elevation model.
Improvements include:
- The addition of Sentinel-2 data which improves the spatial resolution of the model to 10m, compared to the 25 m of the original NIDEM.
- Incorporation of a new pixel-based method that supports a reduction in the temporal epoch of the product to 3 years (in comparison to 28 years in NIDEM), improving the ability to capture the current state of dynamic coastal environments, and enabling ‘change-over-time' applications using annual epochs.
- Quantification of the vertical uncertainty of the elevation model.
- An Intertidal Exposure model at 10 m resolution to examine the spatiotemporal patterns of exposure and inundation across the intertidal zone, supporting migratory species studies and habitat mapping applications.
- Tidal metrics to enable users to understand the varied ranges and distributions of tidal stages observed by the Landsat and Sentinel-2 satellites across Australia, and how this information can be used to better understand and interpret the products.
- The implementation of an ensemble tidal modelling approach, acknowledging the wide range of global and regional tide models available and their varying performance across different regions of Australia.
Tuesday, May 14, 2024
A Switzerland-size hole opened in Antarctica's sea ice in 2016-17. Now we know why
A mysterious 'hole' larger than Maryland has reappeared in the middle of Antarctica after 42 years. Scientists aren't sure how it got there.
But this isn't the first time it's appeared. The hole is a type of polynya.
Polynyas are a region of open water surrounded by sea ice.
But the Weddell polynya is unlike any other.
While most polynyas form near the shore, this polynya is located hundreds of kilometers from the coast. Scientists first saw it in 1974.
Back then, the opening was as large as Oregon.
But in 1976, the opening closed up seemingly for good.
Then, in 2016, a NASA satellite spotted a small opening.
It was the first sighting of the polynya in over 40 years.
Since then, the opening has grown considerably larger.
Now, it's large enough to fit Maryland.
It's still 5X smaller than it was in the '70s.
But this polynya's reappearance is a mystery to scientists.
One expert said it was like someone had punched a hole in the ice.
From Space By Stefanie Waldek
The abnormally large 'Maud Rise polynya' has finally been explained.
Each austral winter, Antarctica undergoes a radical change.
Sea ice surrounding the continent expands outward, effectively doubling Antarctica's size.
But during the winters of 2016 and 2017, a rare hole called a polynya opened in the middle of the sea ice — one about the size of Switzerland.
And scientists have just now figured out how it came to be.

Localization of the Maud seamount with the GeoGarage platform (NGA nautical raster chart)
The hole was named the Maud Rise polynya for the seamount, or underwater mountain, located beneath it in the Weddell Sea.
According to a new study, it ultimately formed due to a combination of wind, ocean currents and underwater geography that created the perfect salty conditions to melt the sea ice.
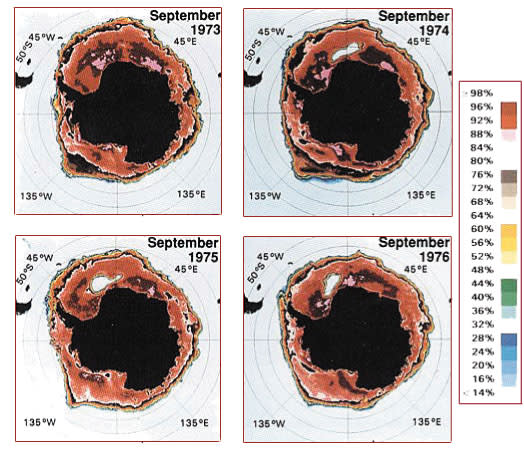
The Maud Rise polynya goes back further than 2016.
It was first identified by Earth-sensing satellites in the 1970s, most notably during the winters from 1974 to 1976.
Scientists assumed that the polynya would return each winter, but that hasn't been the case — it has only reappeared sporadically, and for brief periods.
"2017 was the first time that we’ve had such a large and long-lived polynya in the Weddell Sea since the 1970s," study leader Aditya Narayanan, a postdoctoral research fellow at the University of Southampton in England, said in a statement. 
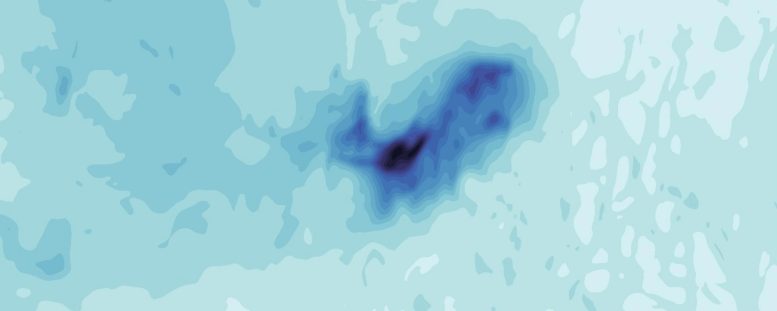 The image shows a data image of the Maud Rise polynya and concentration of its surrounding sea ice. Credit: Birte Gülk
"2017 was the first time that we’ve had such a large and long-lived polynya in the Weddell Sea since the 1970s," study leader Aditya Narayanan, a postdoctoral research fellow at the University of Southampton in England, said in a statement.
(Image credit: NASA Earth Observatory)
In 2016 and 2017, the circular ocean current in the Weddell Sea was stronger than usual.
As such, upwelling around Maud Rise brought warmer, saltier water closer to the surface.
"This upwelling helps to explain how the sea ice might melt. But as sea ice melts, this leads to a freshening of the surface water, which should in turn put a stop to the mixing," study team member Fabien Roquet, a physical oceanography professor at the University of Gothenburg in Sweden, said in the same statement.
"This upwelling helps to explain how the sea ice might melt. But as sea ice melts, this leads to a freshening of the surface water, which should in turn put a stop to the mixing," study team member Fabien Roquet, a physical oceanography professor at the University of Gothenburg in Sweden, said in the same statement.
"So, another process must be happening for the polynya to persist. There must be an additional input of salt from somewhere."
Using data from satellites, autonomous floats and tagged marine mammals, the team determined that turbulent eddies around Maud Rise brought more salt into the area, which was then transferred to the surface through a process called Ekman transport.
Using data from satellites, autonomous floats and tagged marine mammals, the team determined that turbulent eddies around Maud Rise brought more salt into the area, which was then transferred to the surface through a process called Ekman transport.

Polynya off the coast of Antarctica, near Ross Island.
Image: NASA, November 16, 2011.
Through Ekman transport, water moves at a 90-degree angle to the wind above and influences ocean currents.
"The imprint of polynyas can remain in the water for multiple years after they’ve formed," said study team member Sarah Gille, a professor at the University of California, San Diego.
"They can change how water moves around and how currents carry heat towards the continent. The dense waters that form here can spread across the global ocean."
The new study was published online (May 1) in the journal Science Advances.
The new study was published online (May 1) in the journal Science Advances.
Links :
- LiceScience : Antarctic ice hole the size of Switzerland keeps cracking open. Now scientists finally know why
- Science Alert : Scientists Solved a 50-Year Mystery of What Punched The Giant Hole in Antarctic Ice
- Science Daily : Cold Case: Scientific Sleuths Solve the Case of the Mysterious Giant Opening in Antarctic Sea Ice / Mysterious Polynya: Scientists Finally Explain Huge Hole in Antarctic Sea Ice
- Earth : Experts solve the mystery of a giant hole in Antarctic sea ice
Monday, May 13, 2024
Solar storm Intensifies, filling skies with northern lights
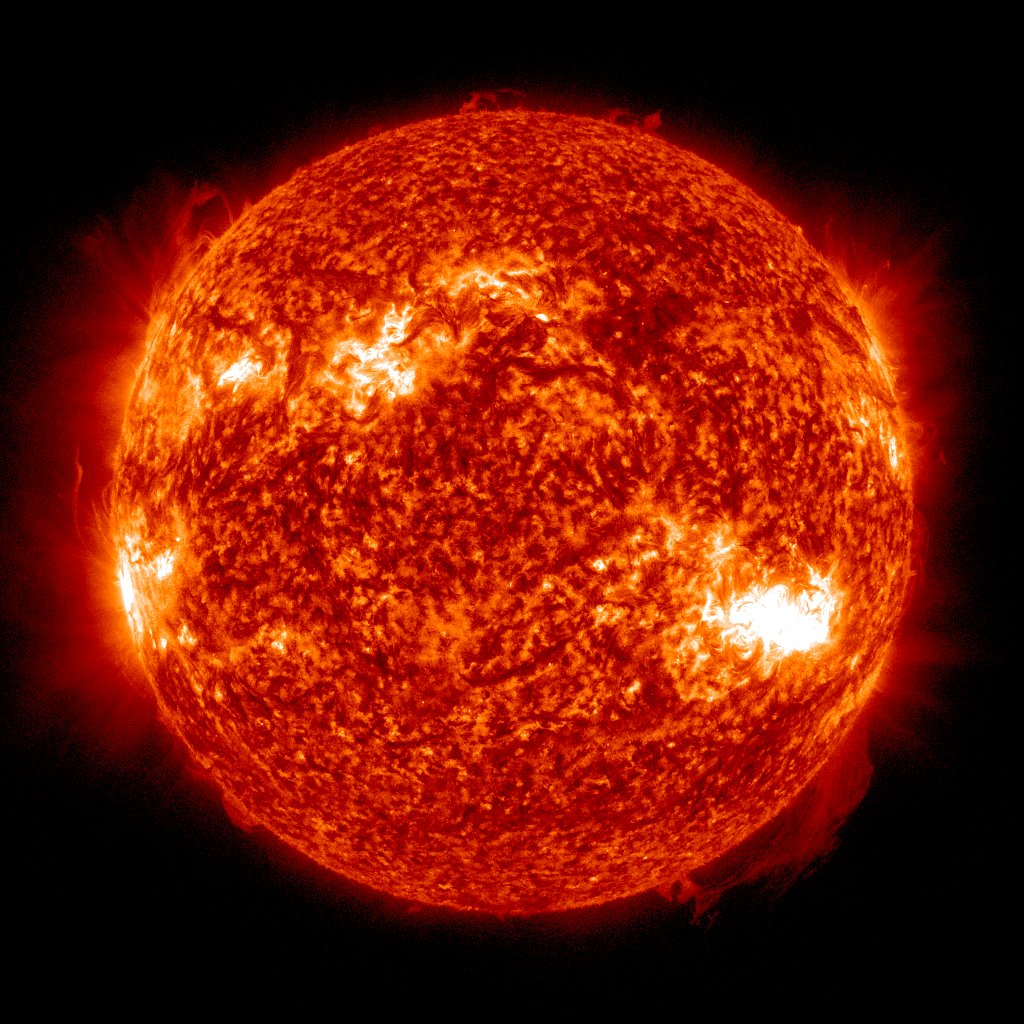
 NASA’s Solar Dynamics Observatory captured these images of the solar flares, as seen in the bright flashes in the upper right, on May 5 and May 6.
The image shows a subset of extreme ultraviolet light that highlights the extremely hot material in flares, colorized in teal.
Credit...NASA/SDO
From NYTimes by Katrina Miller and Judson Jones
Blasts of particles from the sun have prompted officials to issue a
severe geomagnetic storm warning.
The storm could disrupt power grids and GPS — and create northern lights.
Officials warned of potential blackouts or interference with navigation and communication systems this weekend, as well as auroras as far south as Southern California or Texas.
A dramatic blast from the sun set off the highest-level geomagnetic storm in Earth’s atmosphere on Friday that is expected to make the northern lights visible as far south as Florida and Southern California and could interfere with power grids, communications and navigations system.
It is the strongest such storm to reach Earth since Halloween of 2003.
That one was strong enough to create power outages in Sweden and damage transformers in South Africa.
The effects could continue through the weekend as a steady stream of emissions from the sun continues to bombard the planet’s magnetic field.
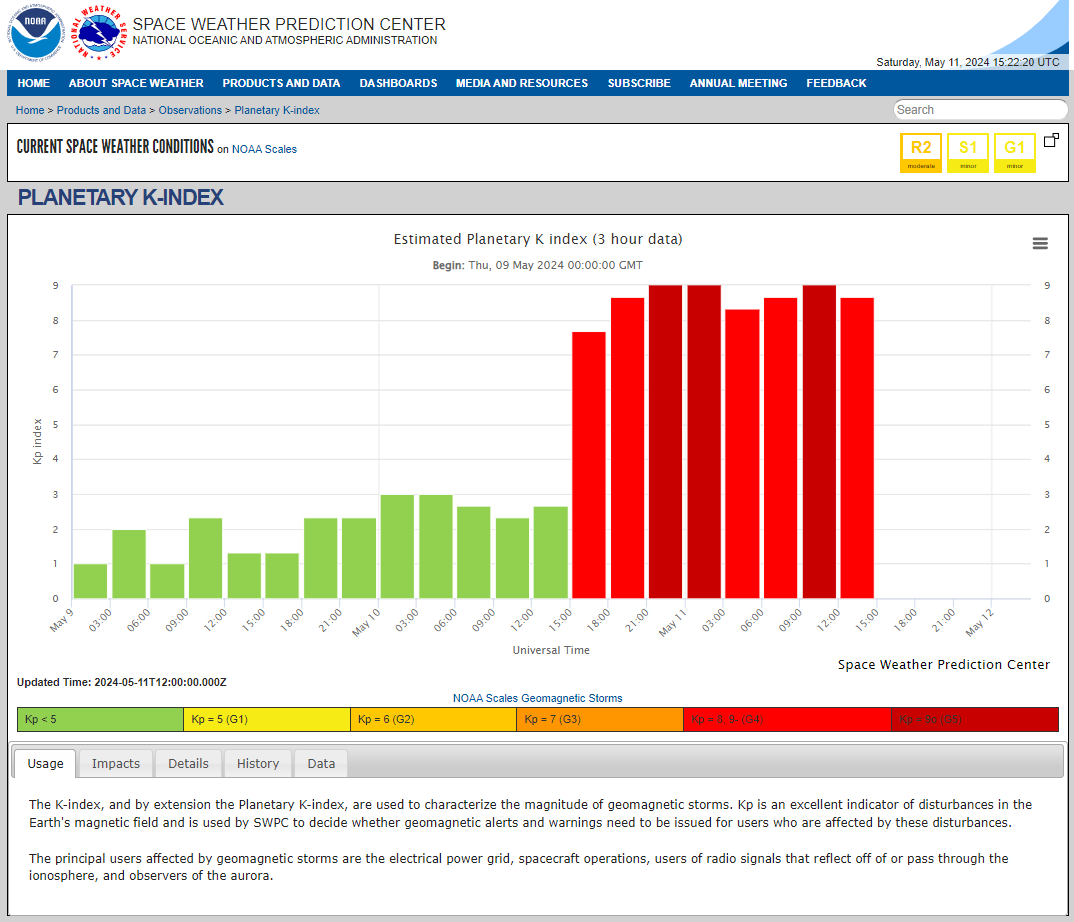
source : NOAA SWPC
The solar activity is so powerful that the National Oceanic and Atmospheric Administration, which monitors space weather, issued an unusual storm watch for the first time in 19 years, which was then upgraded to a warning.
The agency began observing outbursts on the sun’s surface on Wednesday, with at least five heading in the direction of Earth.
“What we’re expecting over the next couple of days should be more significant than what we’ve seen certainly so far,” Mike Bettwy, the operations chief at NOAA’s Space Weather Prediction Center, said at a news conference on Friday morning.
For people in many places, the most visible part of the storm will be the northern lights, known also as auroras.
But authorities and companies will also be on the lookout for the event’s effects on infrastructure, like global positioning systems, radio communications and even electrical power.
While the northern lights are most often seen in higher latitudes closer to the North Pole, people in many more parts of the world are already getting a show this weekend that could last through the early part of next week.

Northern Lights (Aurora Borealis) illuminate the sky of San Francisco North Bay as seen from China Camp Beach in San Rafael, California, United States on May 11, 2024.
(Photo by Tayfun Coskun/Anadolu via Getty Images)
As Friday turned to Saturday in Europe, people across the continent described skies hued in a mottling of colors.
Alfredo Carpineti, an astrophysicist, journalist and author in North London, saw them with his husband from the rooftop of their apartment building.
“It is incredible to able to see the aurora directly from one’s own backyard,” he said.
“I was hoping to maybe catch a glimpse of green on the horizon, but it was all across the sky in both green and purple.”
Here’s what you need to know about this weekend’s solar event.
How will the storm affect people on Earth?
A geomagnetic storm watch or warning indicates that space weather may affect critical infrastructure on or orbiting near Earth.
It may introduce additional current into systems, which could damage pipelines, railroad tracks and power lines.
According to Joe Llama, an astronomer at Lowell Observatory, communications that rely on high frequency radio waves, such as ham radio and commercial aviation, are most likely to suffer.
That means it is unlikely that your cellphone or car radio, which depend on low frequency radio waves, will conk out.
Still, it is possible for blackouts to occur.
As with any power outage, you can prepare by keeping your devices charged and having access to backup batteries, generators and radio.
The most notable solar storm recorded in history occurred in 1859.
Known as the Carrington Event, it lasted for nearly a week, creating aurora that stretched down to Hawaii and Central America and impacting hundreds of thousands of miles of telegraph lines.
But that was technology of the 19th century, used before scientists fully understood how solar activity disrupted Earth’s atmosphere and communication systems.
“That was an extreme level event,” said Shawn Dahl, a forecaster at NOAA’s Space Weather Prediction Center.
“We are not anticipating that.”
Unlike tornado watches and warnings, the target audience for NOAA’s announcements is not the public.
“For most people here on planet Earth, they won’t have to do anything,” said Rob Steenburgh, a space scientist at NOAA’s Space Weather Prediction Center.
The goal of the announcements is to give agencies and companies that operate this infrastructure time to put protection measures in place to mitigate any effects.
“If everything is working like it should, the grid will be stable and they’ll be able to go about their daily lives,” Mr. Steenburgh said.
 NASA’s Solar Dynamics Observatory captured these images of the solar flares, as seen in the bright flashes in the left image (a May 8 flare) and the right image (a May 7 flare).
The image shows a subset of extreme ultraviolet light that highlights the extremely hot material in flares, colorized in orange.CreditCredit...NASA/SDO
Will I be able to see the northern lights?
It is possible that the northern lights may grace the skies this week over places that don’t usually see them.
The best visibility is outside the bright lights of cities.
Clouds or stormy weather could post a problem in some places.
But if the skies are clear, even well south of where the aurora is forecast to take place, snap a picture or record a video with your cellphone.
The sensor on the camera is more sensitive to the wavelengths produced by the aurora and may produce an image you can’t see with the naked eye.
Another opportunity could be viewing sunspots during the daytime, if your skies are clear.
As always, do not look directly at the sun without protection.
But if you still have your eclipse glasses lying around from the April 8 event, you may try to use them to try to spot the cluster of sunspots causing the activity.
This is how an Auroras created pic.twitter.com/luRsJ3es7d
— Physics & Astronomy Zone (@zone_astronomy) June 4, 2021
This is how an Auroras created
Giant explosions on the surface of the sun, known as coronal mass ejections, send streams of energetic particles into space.
But the sun is large, and such outbursts may not cross our planet as it travels around the star.
But when these particles create a disturbance in Earth’s magnetic field, it is known as a geomagnetic storm.
NOAA classifies these storms on a “G” scale of 1 to 5, with G1 being minor and G5 being extreme.
The most extreme storms can cause widespread blackouts and damage to infrastructure on Earth.
Satellites may also have trouble orienting themselves or sending or receiving information during these events.
The current storm is classified as G5, or “extreme.” It is caused by a cluster of sunspots — dark, cool regions on the solar surface — that is about 16 times the diameter of Earth.
The cluster is flaring and ejecting material every six to 12 hour.
“We anticipate that we’re going to get one shock after another through the weekend,” said Brent Gordon, chief of the space weather services branch at NOAA’s Space Weather Prediction Center.
NOAA’s Space Weather Prediction Center (SWPC) — a division of the National Weather Service — is monitoring the sun following a series of solar flares and coronal mass ejections (CMEs) that began on May 8.
Space weather forecasters have issued a Severe (G4) Geomagnetic Storm Watch for the evening of Friday, May 10.
Additional solar eruptions could cause geomagnetic storm conditions to persist through the weekend. A large sunspot cluster has produced several moderate to strong solar flares since Wednesday at 5:00 am ET. At least five flares were associated with CMEs that appear to be Earth-directed.
SWPC forecasters will monitor NOAA and NASA’s space assets for the onset of a geomagnetic storm. CMEs are explosions of plasma and magnetic fields from the sun’s corona.
They cause geomagnetic storms when they are directed at Earth. Geomagnetic storms can impact infrastructure in near-Earth orbit and on Earth’s surface, potentially disrupting communications, the electric power grid, navigation, radio and satellite operations.
SWPC has notified the operators of these systems so they can take protective action.
Geomagnetic storms can also trigger spectacular displays of aurora on Earth.
A severe geomagnetic storm includes the potential for aurora to be seen as far south as Alabama and Northern California.
Why is this happening now?
The sun’s activity ebbs and flows on an 11-year cycle, and right now, it is approaching a solar maximum.
Three other severe geomagnetic storms have been observed so far in the current activity cycle, which began in December 2019, but none were predicted to cause effects strong enough on Earth to warrant a watch or warning announcement.
The cluster of sunspots generating the current storm is the largest seen in this solar cycle, NOAA officials said.
They added that the activity in this cycle has outperformed initial predictions.
More flares and expulsions from this cluster are expected, but because of the sun’s rotation the cluster will be oriented in a position less likely to affect Earth.
In the coming weeks, the sunspots may appear again on the left side of the sun, but it is difficult for scientists to predict whether this will cause another bout of activity.
“Usually, these don’t come around packing as much of a punch as they did originally,” Mr.
Dahl said.
“But time will tell on that.”
Links :
- The Hill : Solar storm puts on brilliant light show across the globe, but no serious problems reported / A huge solar storm is hitting the US: 6 big questions and answers
- The Weather channel : Solar Storm, Auroras This Weekend: 3 Things To Know
- Earth : Another "Extreme" and very rare G5-level solar storm hits Earth on Saturday / "Severe Geomagnetic Storm" hits Earth, NOAA warning in effect all weekend
- Reuters : Musk's Starlink satellites disrupted by major solar storm
- CNN : Why tonight’s massive solar storm could disrupt communications and GPS systems
- NOAA : Solar flares (radio blackouts)
- GeoGarage blog : How NASA, NOAA and AI might save the internet from ... / A bad solar storm could cause an 'Internet apocalypse' / Solar storm's effects to lash Earth until today / Get a closer look at the big solar flares that keep coming / Recent solar flare may disrupt your GPS
Sunday, May 12, 2024
Aurores boréales in France
𝑨𝑼𝑹𝑶𝑹𝑬𝑺 𝑩𝑶𝑹𝑬𝑨𝑳𝑬𝑺 𝑬𝑵 𝑭𝑹𝑨𝑵𝑪𝑬 - Comme si vous y étiez en accéléré !
— Mathieu Rivrin - Photographies (@mathieurivrin) May 11, 2024
Timelapse d'une heure - Mont Saint-Michel - Nuit du 10 au 11 Mai 2024
𝑀𝑎𝑡ℎ𝑖𝑒𝑢 𝑅𝑖𝑣𝑟𝑖𝑛 / Tous Droits Réservés#aurore #auroreboreale #france #northernlights #aurores #nuit pic.twitter.com/ipL1k9onGr

see Mathieu Rivrin
Nuit féerique au Pays Basque #Auroraborealis #auroreboreale #AURORE #auroresboreales pic.twitter.com/QrqLVS4wr3
— Marco Urrutia (@MU_RU1) May 11, 2024
Subscribe to:
Posts (Atom)