Saturday, October 28, 2017

How did early sailors navigate the Oceans ?

Do you know how the early sailors navigate the oceans?
The technology today makes it real easy to navigate the oceans.
But it's very interesting to know how the early sailors managed to navigate without it.
There's a lot of history on it.
I tried my best to compile some important and interesting parts of it into this video.

How did Polynesian wayfinders navigate the Pacific Ocean ?
by Alan Tamayose and Shantell De Silva

Friday, October 27, 2017

US NOAA layer update in the GeoGarage platform

7 nautical raster charts updated

A spacecraft graveyard exists in the middle of the ocean — here's what's down there


Point Nemo on Google Earth

From Business Insider by Dave Mosher

  • Large satellites, space stations, and other objects can pose a threat when they fall to the ground.
  • As a result, many nations de-orbit old spacecraft over the most remote place on Earth, called Point Nemo.
  • This "spacecraft cemetery" is about 1,450 miles away from any piece of land and home to hundreds of dead satellites.
  • Space agencies and companies are concerned about space junk and working on ways to prevent its formation and clean it up.

The most remote location on Earth has many names:
It's called Point Nemo (Latin for "no one") and the Oceanic Pole of Inaccessibility.
Most precisely, its exact coordinates are 48 degrees 52.6 minutes south latitude and 123 degrees 23.6 minutes west longitude.

The spot is about 1,450 nautical miles from any spot of land — and the perfect place to dump dead or dying spacecraft, which is why its home to what NASA calls its "spacecraft cemetery."
"It's in the Pacific Ocean and is pretty much the farthest place from any human civilization you can find," NASA said.
Bill Ailor, an aerospace engineer and atmospheric reentry specialist, put it another way: "It's a great place you can put things down without hitting anything," he said.

To "bury" something in the cemetery, space agencies have to time a crash over that spot.
Smaller satellites don't generally end up at Point Nemo, since, as NASA explains, "the heat from the friction of the air burns up the satellite as it falls toward Earth at thousands of miles per hour. Ta-da! No more satellite."

The problem is larger objects, like Tiangong-1: the first Chinese space station, which launched in September 2011 and weighs about 8.5 tons.

A scale model of China's Tiangong-1 space station.
Jason Lee/Reuters

China lost control of the 34-foot-long orbital laboratory in March 2016, and it is now doomed to crash by early 2018.

Where, exactly?
No one yet knows.
Ailor, who works for the nonprofit Aerospace Corporation, said his company likely won't generate a forecast until five days before the space station is expected to break apart in Earth's atmosphere.

When it does, hundreds of pounds of the spacecraft — like titanium scaffolding and glass-fiber-wrapped fuel tanks — could be falling at more than 180 miles per hour just before slamming into the ground (and thousands of miles per hour faster in the upper atmosphere).

Since China doesn't have control of Tiangong-1, it can't assure the space station will disintegrate over Point Nemo.


Footage courtesy of NASA
The dead-spacecraft dumping zone

Astronauts living aboard the International Space Station actually live closer to the graveyard of spacecraft than anyone else.
This is because the ISS orbits about 250 miles above Earth — and Point Nemo, when the orbital laboratory flies overhead. (The nearest island, meanwhile, is much farther away.)

Between 1971 and mid-2016, space agencies all over the world dumped at least 260 spacecraft into the region, according to Popular Science.
That tally has risen significantly since the year 2015, when the total was just 161, per Gizmodo.

Buried under more than two miles of water is the Soviet-era MIR space station, more than 140 Russian resupply vehicles, several of the European Space Agency's cargo ships (like the Jules Verne ATV), and even a SpaceX rocket, according to Smithsonian.com.

These dead spacecraft aren't neatly tucked together, though.

Ailor said a large object like Tiangong-1 can break apart into an oval-shaped footprint of debris that extends 1,000 miles long and dozens of miles wide.
Meanwhile, the land-free zone around Point Nemo stretches more than 6.6 million square miles — so paying your respects to a specific item isn't easy.

While not all spacecraft wind up in the cemetery, the chances are extremely slim that anyone would get hit by debris regardless of where the spacecraft break up on Earth, Ailor said.

"It's not impossible, but since the beginning of the space age .... a woman who was brushed on the shoulder in Oklahoma is the only one we're aware of who's been touched by a piece of space debris," he said.

A bigger risk is leaving dead spacecraft in orbit.

An illustration of space junk. Satellites and debris are not to scale.
ESA

The pernicious threat of space junk

Some 4,000 satellites currently orbit Earth at various altitudes.
There's space for more — even the 4,425 new internet-providing satellites that Elon Musk and SpaceX wish to launch in the near future.

But it's getting crowded up there when considering the threat of space junk.

In addition to all those satellites, there are thousands of uncontrolled rocket bodies orbiting earth, along with more than 12,000 artificial objects larger than a fist, according to Space-Track.org.
That's not to mention countless screws, bolts, flecks of paint, and bits of metal.

"Countries have learned over the years that when they create debris, it presents a risk to their own systems just as it does for everybody else," Ailor said.

The worst kind of risk, according to the European Space Agency, is when a piece of space junk accidentally hits another piece, especially if the objects are large.

Such satellite collisions are rare but do happen; one occurred in 1996, another in 2009, and two in 2013.
These accidents — along with the intentional destruction of space satellites — have generated countless pieces of space debris that can threaten satellites in nearby orbits years later, leading to a kind of runaway effect.

"We've figured out that this debris can stay up there for hundreds of years," Ailor said, later clarifying that some objects in higher orbits, like geosynchronous satellites, can stay in orbit for thousands of years.

Getting old spacecraft out of orbit is a key to preventing the formation of space junk, and many space agencies and corporations now build spacecraft with systems to de-orbit them (and land them in the spacecraft cemetery).

But Ailor and others are pushing for the development of new technologies and methods that can lasso, bag, tug, and otherwise remove the old, uncontrolled stuff that's already up there and continues to pose a threat.
"I've proposed something like an XPRIZE or a Grand Challenge, where would you identify three spacecraft and give a prize to an entity to remove those things," he said.

The most important hurdle to clear, though, may be politics on Earth.
"It's not just a technical issue. This idea of ownership gets to be a real player here," Ailor said.
"No other nation has permission to touch a US satellite, for instance. And if we went after a satellite ... it could even be deemed an act of war."

Ailor said someone needs to get nations together to agree on a treaty that spells out laws-of-the-sea-like salvage rights to dead or uncontrollable objects in space.
"There needs to be something where nations and commercial [companies] have some authority to go after something," he said.

Links :

Thursday, October 26, 2017

Map provides high-resolution look at nearly entire Arctic region

A color-shaded relief image made from the 5-meter mosaic of ArcticDEM shows a portion of the Brooks Range on the North Slope of Alaska.
Colors suggest elevation, from lower (green) to higher (brown).
Credit: Paul Morin, PGC

From EOS by Randy Showstack

Researchers highlight the value of the time element incorporated into imagery and having a baseline for revisiting and comparing topography.


“The Arctic, before we started, was one of the most poorly mapped places on Earth.
It’s not anymore,” said Paul Morin, co–principal investigator of the ArcticDEM initiative, which has now released high-resolution digital elevation models (DEM) of 97.4% of the region.
With this latest release, “we have a uniform product at 2-meter [resolution]” for all the land area north of 60°N latitude, plus those parts of Alaska, Greenland, and Russia’s Kamchatka Peninsula that are south of that point.

ArcticDEM Explorer produces digital elevation models to show change over time

The public-private initiative plans to fill in the gaps with a final release in May 2018, according to Morin, director of the Polar Geospatial Center (PGC) at the University of Minnesota.

The initiative, which has produced a 3-D digital representation of terrain surface, is an important tool for studying, understanding, and making decisions about the Arctic, including resources, natural hazards, and infrastructure, scientists and environmental managers told Eos. It is “a game changer for high-latitude science and modeling,” said Laurence Smith, professor of geography at the University of California, Los Angeles.

Released on 6 September, the publicly available ArcticDEM incorporates satellite-acquired imagery, high-performance computing, and open-source photogrammetry software to stitch together a terrain model that governments, commercial entities, and the academic community could find useful for many applications.

The ArcticDEM release consists of two products, Morin told Eos. One is a time-stamped, 2-meter-resolution collection of overlapping DEMs of the Arctic, with each DEM having the date and time associated with it.
The other is a 5-meter-resolution DEM product, which is not time stamped, of the entire region.
The products build on earlier ArcticDEM versions by adding 32% more terrain data, including sizable portions of Russia and Scandinavia.

(top) The newly released Arctic digital elevation model, or DEM, depicts 97.4% of the region’s terrain.
Colors show elevation: green for near sea level, brown for higher topography such as mountains, and white for the highest-altitude areas, such as the Greenland ice sheet. 
(bottom) A silhouette of the full ArcticDEM shows the 32% additional Arctic terrain (orange) included in the DEM since its last release.
Credit: Paul Morin, PGC

Temporal Aspect of Topography

The products provide two significant advances, according to Morin.
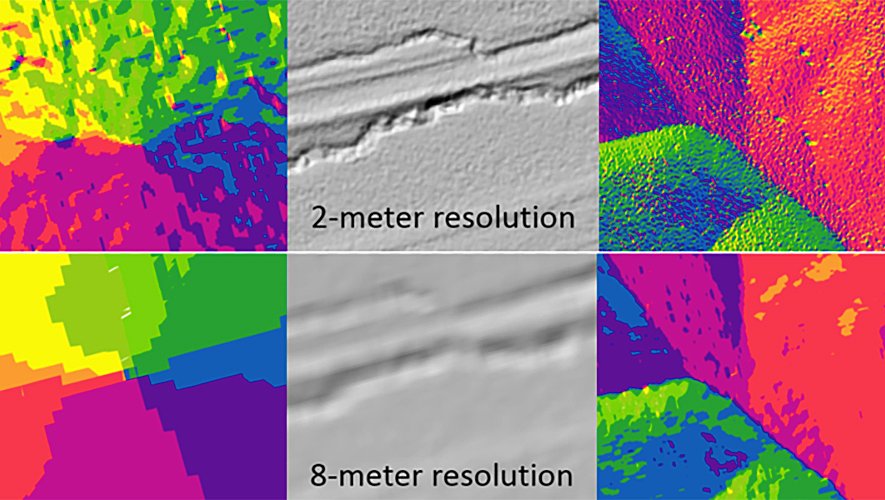
The first is that the resolution for just about the entire Arctic is much higher than in other models.
For instance, compared with the U.S.-Japanese Advanced Spaceborne Thermal Emission and Reflection Radiometer’s (ASTER) Global Digital Elevation Model (GDEM), which came out with updated versions in 2011 and 2016, the 5-meter ArcticDEM has 36 times the resolution of ASTER’s GDEM, which has 30-meter pixels, whereas the 2-meter ArcticDEM has 225 times greater resolution.


The second major advance, Morin said, is the time element incorporated into the 2-meter-resolution DEMs obtained from multiple satellite passes over regions.
This allows for a comparison of topography over time in the rapidly changing Arctic region, including changes in glaciers and permafrost, he said.
The difference between the 5- and 2-meter-resolution products is “the difference between a map and a time series of measurements,” he said.
Morin added that the 5-meter-resolution product is beneficial for providing a view of an entire watershed or other large region, whereas the time-stamped 2-meter-resolution product is more useful for studies of smaller areas over time.

  Scientists are using data of the Lena Delta at the end of a remote river in Siberia
to study river systems that are otherwise inaccessible.
see on ArcticDEM explorer

“Probably the biggest leap forward here for science is that we’ve proven that topography can be produced continuously,” Morin said.
This means that whenever the Sun is at least 7° above the horizon, satellites are gathering stereo imagery that then gets processed and released in short order, he explained. Every year, about 75% of the entire Arctic gets reimaged, he said.
For some high-priority areas, such as outlet glaciers in Greenland, the reimaging happens more frequently.
Satellites collect each stereo image as a pair of mono images taken at specific, known angles.

Previous DEM production projects were “one-offs,” Morin noted.
A large mapping effort would produce a DEM of a region like Alaska with the intention of not repeating the mapping for an extended period of time, he noted.

Ragnar Heidar Thrastarson, geographic information system coordinator for the Icelandic Meteorological Office, said, “Previously, we thought of DEMs as a fixed spatial entity that needed to be collected once and then maybe again in 20 years or so. But there are a lot of natural phenomena that change faster than that,” he told Eos.

The new temporal aspect of ArcticDEM “is a huge benefit” for modeling those and following changes in glaciated areas, he said.


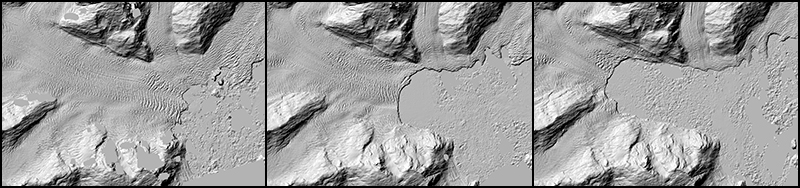
A time series (left to right) of images of the West Branch of the Columbia Glacier in Alaska, showing the glacier’s retreat from 2010 to 2015.
Credit: Paul Morin, PGC

Public-Private Partnership


The U.S. National Geospatial-Intelligence Agency (NGA) and the National Science Foundation (NSF) have supported the initiative, which grew out of a January 2015 executive order from then president Barack Obama. The four satellites used for collecting imagery—Worldview-1, -2, and -3 as well as GeoEye-1—are all owned by DigitalGlobe and licensed by NGA, which provides the imagery for the initiative.

NSF is providing $2.5 million through its Directorate for Geosciences. In addition, the NSF-funded Blue Waters petascale supercomputer at the National Center for Supercomputing Applications at the University of Illinois at Urbana-Champaign processes the stereo imagery into elevation models. The products, which are produced on a supercomputer, are distributed through arcticdem.org and are also available through Amazon Web Services.

The project also has involved other academic partners and Esri, a mapping company based in Redlands, Calif., that developed an online application, ArcticDEM Explorer, to analyze data.

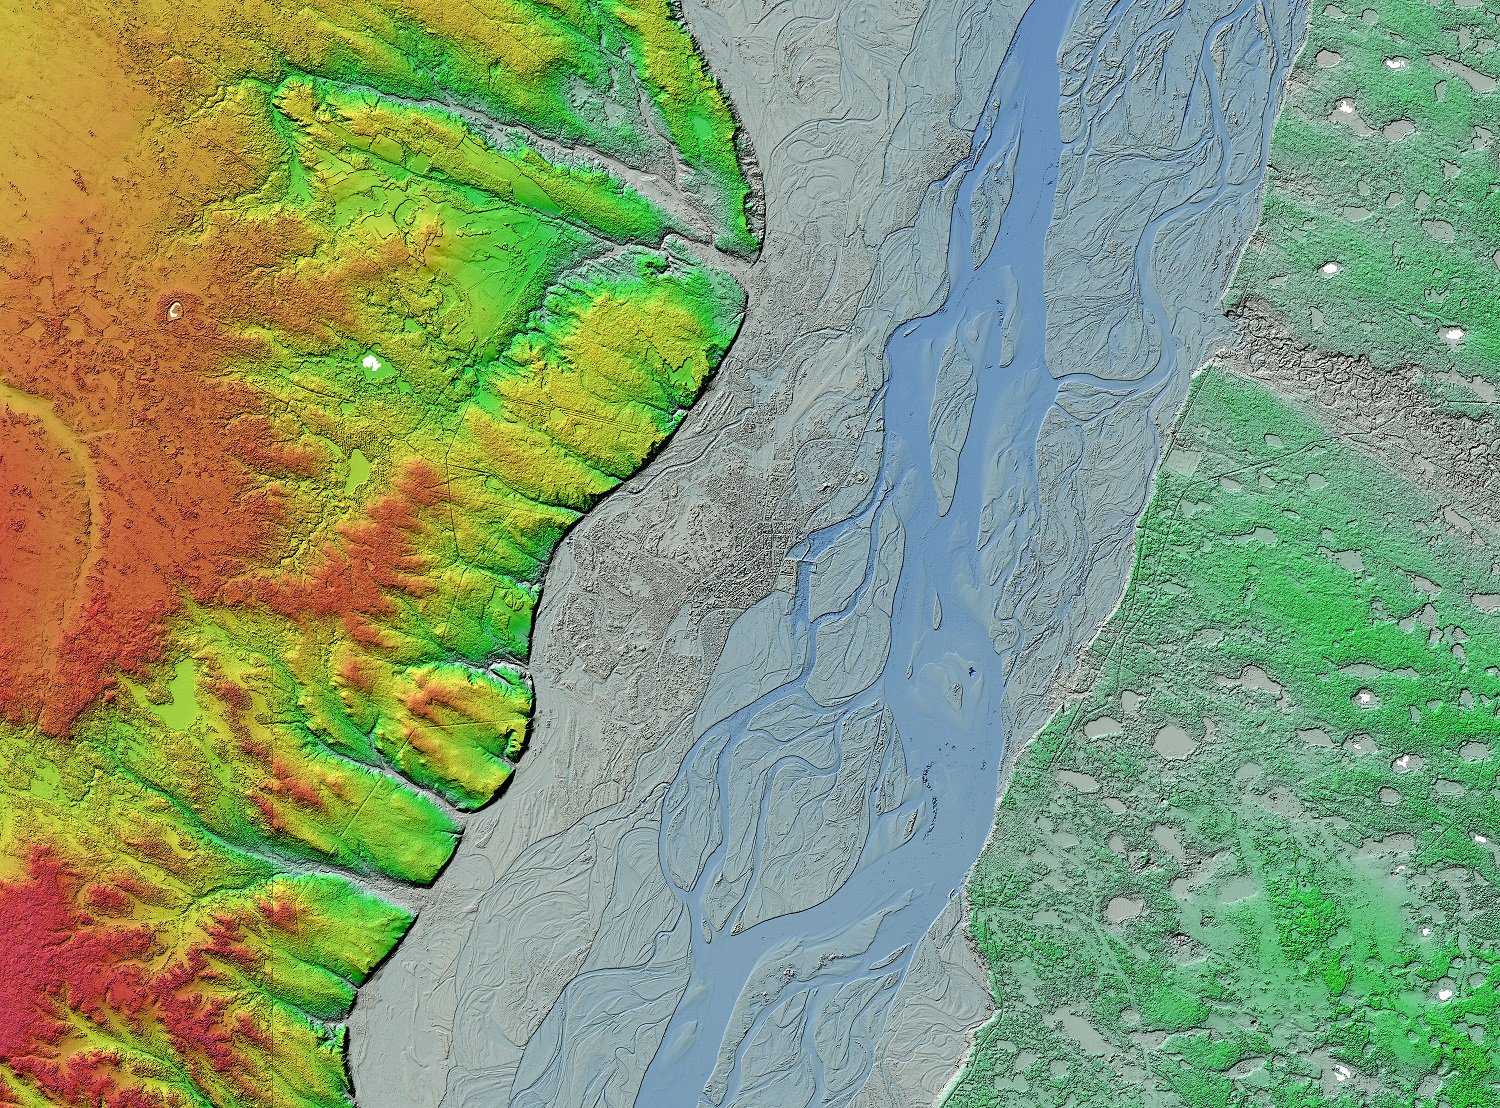
Visible as a darker gray region in the center of this image made from ArcticDEM, the remote Siberian city of Yakutsk stretches between wilderness (green, yellow, and orange areas to the left) and the Lena River (blue) in northern Russia.
Credit: Paul Morin, PGC

An Important Tool for Arctic Science and Modeling Hazards

Scientists and environmental managers told Eos that ArcticDEM is an important tool for Arctic science and other applications.
“It’s a tremendous baseline of information for basic research related to land surface processes,” said Scott Borg, acting deputy assistant director for geosciences at NSF.

Eric Rignot of the University of California, Irvine, and NASA’s Jet Propulsion Laboratory in Pasadena, Calif., told Eos that he will use ArcticDEM to process ice velocity on glaciers and ice sheets and said it will also help clarify drainage boundaries between glaciers.
It “will finally provide a useful reference in time from which we can measure changes in ice volume,” he said.

The Asiaq Greenland Survey used ArcticDEM to make a detailed topographic map and a tsunami model after an 18 June landslide and tsunami at Karrat Fjord.
One motivation was “to look for other areas in the same region that could fail in the same way,” Morin said.

“Earth science is about change,” he noted.
“The surface is key to the past, and being able to measure changes in the surface is going to enable all different kinds of science, from coastal erosion and landslides, to forest management and civil engineering. Because we now have created a baseline for topography for about 10% of the land surface of the Earth, measurements in the future of topography can be measured against this data set.”

Links :

Wednesday, October 25, 2017

Astrolabe: Shipwreck find 'earliest navigation tool'

The instrument was once used by mariners to measure the altitude of the Sun during their voyages
photo : Philip Koch

From BBC by Rebecca Morelle

An artefact excavated from a shipwreck off the coast of Oman has been found to be the oldest known example of a type of navigational tool.

Ghubbat ar Rahib bay where the wreck is being excavated
with the GeoGarage platform (UKHO chart)

This copper-alloy disc, bearing the Royal coat of arms and the armillary sphere of Dom Manuel I is an important object although its precise identity & function is still unknown.
It does have features suggesting it could be an astrolabe, or part thereof. 
The item was found in 2014 in a shipwreck in the Indian Ocean as one of nearly 3,000 objects recovered from the wreck, but it had no visible signs of navigational markings - until now.Esmeralda Shipwreck - The Official Vasco da Gama Expedition

Marine archaeologists say the object is an astrolabe, an instrument once used by mariners to measure the altitude of the Sun during their voyages.

It is believed to date from between 1495 and 1500.
The item was recovered from a Portuguese explorer which sank during a storm in the Indian Ocean in 1503.
The boat was called the Esmeralda and was part of a fleet led by Portuguese explorer Vasco da Gama, the first person to sail directly from Europe to India.

Using an astrolabe

David Mearns, from Blue Water Recovery, who led the excavation and is the author of The Shipwreck Hunter, told the BBC: "It's a great privilege to find something so rare, something so historically important, something that will be studied by the archaeological community and fills in a gap."

The astrolabe was discovered by Mr Mearns in 2014, and was one of nearly 3,000 artefacts recovered during a series of dives.
The bronze disc measures 17.5cm in diameter and is less than 2mm thick.
"It was like nothing else we had seen and I immediately knew it was something very important because you could see it had these two emblems on it," said Mr Mearns.
"One I recognised immediately as a Portuguese coat of arms... and another which we later discovered was the personal emblem of Don Manuel I, the King of Portugal at the time."

The excavation team believed the object was an astrolabe, but they could not see any navigational markings on it.

However, a later analysis uncovered its hidden details.
Laser scanning work carried out by scientists at the University of Warwick revealed etches around the edge of the disc, each separated by five degrees.


The University of Warwick used laser scans to uncover etches on the astrolabe,
which helped navigators work out the height of the sun

This would have allowed mariners to measure the height of the sun above the horizon at noon to determine their location so they could find their way on the high seas.
Mariners' astrolabes are relatively rare, and this is only the 108th to be confirmed catalogued. It is also the earliest known example by several decades.

Mr Mearns said: "We know it had to have been made before 1502, because that's when the ship left Lisbon and Dom Manuel didn't become King until 1495, and this astrolabe wouldn't have carried the emblem of the King unless he was King.
"I believe it's probably fair to say it dates roughly to between 1495 to 1500. Exactly what year we don't know - but it is in that narrow period."
He added: "It rolls back this history by at least 30 years - it adds to evolution, it adds to the history, and hopefully astrolabes from this period can be found."

Links :

Tuesday, October 24, 2017

Ocean acidification is deadly threat to marine life, finds eight-year study

Scientists haul in samples of seawater in Svalbard, Norway.
Greenpeace is working with the German marine research institute to investigate ocean acidification.
Photograph: Nick Cobbing/Greenpeace

From The Guardian by Fiona Harvey

Plastic pollution, overfishing, global warming and increased acidification from burning fossil fuels means oceans are increasingly hostile to marine life

If the outlook for marine life was already looking bleak – torrents of plastic that can suffocate and starve fish, overfishing, diverse forms of human pollution that create dead zones, the effects of global warming which is bleaching coral reefs and threatening coldwater species – another threat is quietly adding to the toxic soup.

Ocean acidification is progressing rapidly around the world, new research has found, and its combination with the other threats to marine life is proving deadly.
Many organisms that could withstand a certain amount of acidification are at risk of losing this adaptive ability owing to pollution from plastics, and the extra stress from global warming.

 Satellite animation of ocean salinity made using one of the same satellites
used to create the new estimates of ocean acidification.
Credit: ESA

The conclusions come from an eight-year study into the effects of ocean acidification which found our increasingly acid seas – a byproduct of burning fossil fuels – are becoming more hostile to vital marine life.

“Since ocean acidification happens extremely fast compared to natural processes, only organisms with short generation times, such as micro-organisms, are able to keep up,” the authors of the study Exploring Ocean Change: Biological Impacts of Ocean Acidification found.

Marine life such as crustaceans and organisms that create calcified shelters for themselves in the oceans were thought to be most at risk, because acid seas would hinder them forming shells. However, the research shows that while these are in danger, perhaps surprisingly, some – such as barnacles – are often unaffected, while the damage from acidification is also felt much higher up the food chain, into big food fish species.


An unhealthy pteropod shows the effects of ocean acidification, including dissolving shell ridges on its upper surface, a cloudy shell, and severe abrasions.
Photograph: Courtesy of NOAA

Ocean acidification can reduce the survival prospects of some species early in their lives, with knock-on effects.
For instance, the scientists found that by the end of the century, the size of Atlantic cod in the Baltic and Barents Sea might be reduced to only a quarter of the size they are today, because of acidification.

Peter Thomson, UN ambassador for the oceans and a diplomat from Fiji, which is hosting this year’s UN climate change conference in Bonn, urged people to think of the oceans in the same terms as they do the climate.
“We are all aware of climate change, but we need to talk more about ocean change, and the effects of acidification, warming, plastic pollution, dead zones and so on,” he said.
“The world must know that we have a plan to save the ocean. What is required over the next three years is concerted action.”

credit : WHOI
 
The eight-year study was carried out by the Biological Impacts of Ocean Acidification group (known as Bioacid), a German network of researchers, with the support of the German government, and involved more than 250 scientists investigating how marine life is responding to acidification, and examining research from around the world.
The study was initiated well before governments signed a global agreement on climate change at Paris in 2015, and highlights how the Paris agreement to hold warming to no more than 2C may not be enough to prevent further acidification of the world’s seas.

Governments will meet in Bonn in November to discuss the next steps on the road to fulfilling the requirements of the Paris agreement, and the researchers are hoping to persuade attendees to take action on ocean acidification as well.

courtesy of NOAA

Ocean acidification is another effect of pouring carbon dioxide into the atmosphere, as the gas dissolves in seawater to produce weak carbonic acid.
Since the industrial revolution, the average pH of the ocean has been found to have fallen from 8.2 to 8.1, which may seem small but corresponds to an increase in acidity of about 26%.
Measures to reduce the amount of carbon dioxide reaching the atmosphere can help to slow down this process, but only measures that actively remove carbon already in the atmosphere will halt it, because of the huge stock of carbon already in the air from the burning of fossil fuels.

Worse still, the effects of acidification can intensify the effects of global warming, in a dangerous feedback loop.
The researchers pointed to a form of planktonic alga known as Emiliania huxleyi, which in laboratory experiments was able to adapt to some extent to counter the negative effects acidification had upon it.
But in a field experiment, the results were quite different as the extra stresses present at sea meant it was not able to form the extensive blooms it naturally develops.
As these blooms help to transport carbon dioxide from the surface to the deep ocean, and produce the gas dimethyl sulfide that can help suppress global warming, a downturn in this species “will therefore severely feed back on the climate system”.

Links :

Monday, October 23, 2017

ECDIS not being used as anticipated

Extract of original and revised passage plans  (note: all times UTC+1)
Reproduced from Admiralty Charts BA 1406-0 and 1408-0
by permission of the Controller of HMSO and the UK Hydrographic Office

From MarEx

The U.K. Marine Accident Investigation Branch (MAIB) has announced that it is conducting a safety study, in collaboration with the Danish Maritime Accident Investigation Board, to understand why operators are not using ECDIS as envisaged by regulators and the system manufacturers.

General cargo vessel MUROS ran aground at around 0700 UTC Dec 3 off Happisburgh, Norfolk, UK, North Sea, while en route from Tees UK to Rochefort France.
Vessel grounded on a sandbank on even keel, no damages reported, authorities said she may be refloated ot around 2030 LT with high tide.

The news follows the release of a MAIB investigation report into the grounding of the bulk carrier Muros.
In the early hours of December 3, 2016, the Muros ran aground on Haisborough Sand, eight miles off the Norfolk coast.

 Muros bridge layout

When Muros grounded, she was following a passage plan shown on its electronic chart and display information system (ECDIS).

 Reconstruction of ECDIS display at 02:50
previously 00:25 / 02:08 / 02:20 / 02:48
image courtesy of Maris / Red Ensigh Training / UKHO


The MAIB investigation found that:
  • The vessel was following a planned track across Haisborough Sand. The passage plan in the ECDIS had been revised by the second officer less than three hours before the grounding and it had not been seen or approved by the master.
  • A visual check of the track in the ECDIS using a small-scale chart did not identify it to be unsafe, and warnings of the dangers over Haisborough Sand that were automatically generated by the system’s ‘check route’ function were ignored.
  • The second officer monitored the vessel’s position using the ECDIS but did not take any action when the vessel crossed the 10-meter safety contour into shallow water.
  • The effectiveness of the second officer’s performance was impacted upon by the time of day and a very low level of arousal, and she might have fallen asleep periodically.
  • The disablement of the ECDIS alarms removed the system’s barriers that could have alerted the second officer to the danger in time for successful avoiding action to be taken.
Muros’s passage plan on ENC GB300106

The MAIB has recently investigated several grounding incidents in which the way the vessels' ECDIS was configured and utilized was contributory.
There is increasing evidence to suggest that first generation ECDIS systems were designed primarily to comply with the performance standards required by the IMO, as these systems became a mandatory requirement on ships, with insufficient attention being given to the needs of the end user, states the report.

“As a consequence, ECDIS systems are often not intuitive to use and lack the functionality needed to accommodate accurate passage planning in confined waters. This situation has led to seafarers using ECDIS in ways which are at variance with the instructions and guidance provided by the manufacturers and/or expected by regulators.”

Links :

Sunday, October 22, 2017

Volvo Ocean Race : version 2017-18

The new 2017-1018 route around the world


"If you are determined to be in the sailing game you have to do this Race" - Sir Peter Blake. 

See the Volvo Ocean 70s and their crews slamming through some of the roughest, most terrifying, and dangerous conditions on the planet while competing in the Volvo Ocean Race 2011-12.

The Volvo Ocean Race when it was previously called the Whitbread Round the World Race

Links :